Navigating the EdgeBreak Platform
EdgeBreak combines educational resources with powerful NASDAQ research tools. This lesson provides an overview of every major feature within the platform and explains how they work together to support a structured breakout research process.
What You'll Learn
- How the EdgeBreak platform is organised.
- When to use each research tool.
- How the scanners work together.
- How to organise your research inside My Workspace.
- A simple daily research workflow.
The EdgeBreak Workflow
Every feature inside EdgeBreak has been designed to support a structured research process rather than encouraging impulsive decision-making. Instead of searching hundreds of charts manually, the platform helps organise market information into a logical workflow that can be repeated each day.
While every investor develops their own research routine, the workflow taught throughout the Academy follows the same basic process:
- Scan the market for developing opportunities.
- Research market structure.
- Review Smart Money characteristics.
- Save promising stocks to My Workspace.
- Continue monitoring them over time.
NASDAQ Scanner
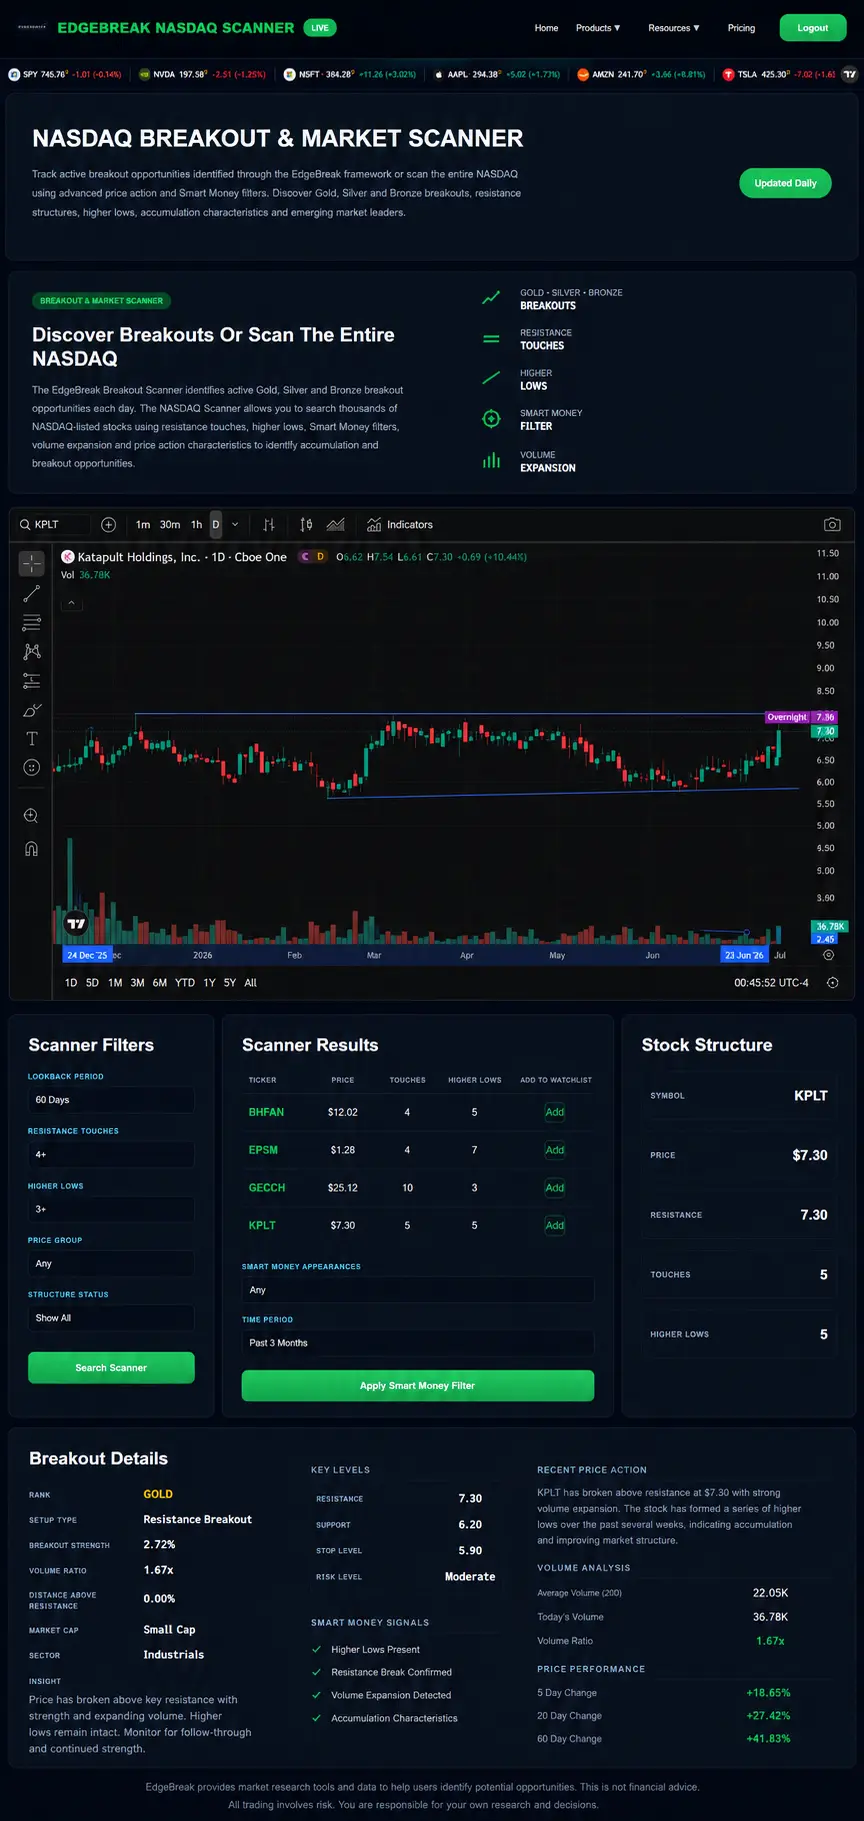
The NASDAQ Scanner is the starting point for most research. It searches thousands of NASDAQ-listed stocks using structured market characteristics including resistance touches, higher lows, price groups and additional research filters.
Rather than searching charts one by one, the scanner helps narrow the market to stocks already displaying characteristics that may deserve further investigation.
Breakout Scanner
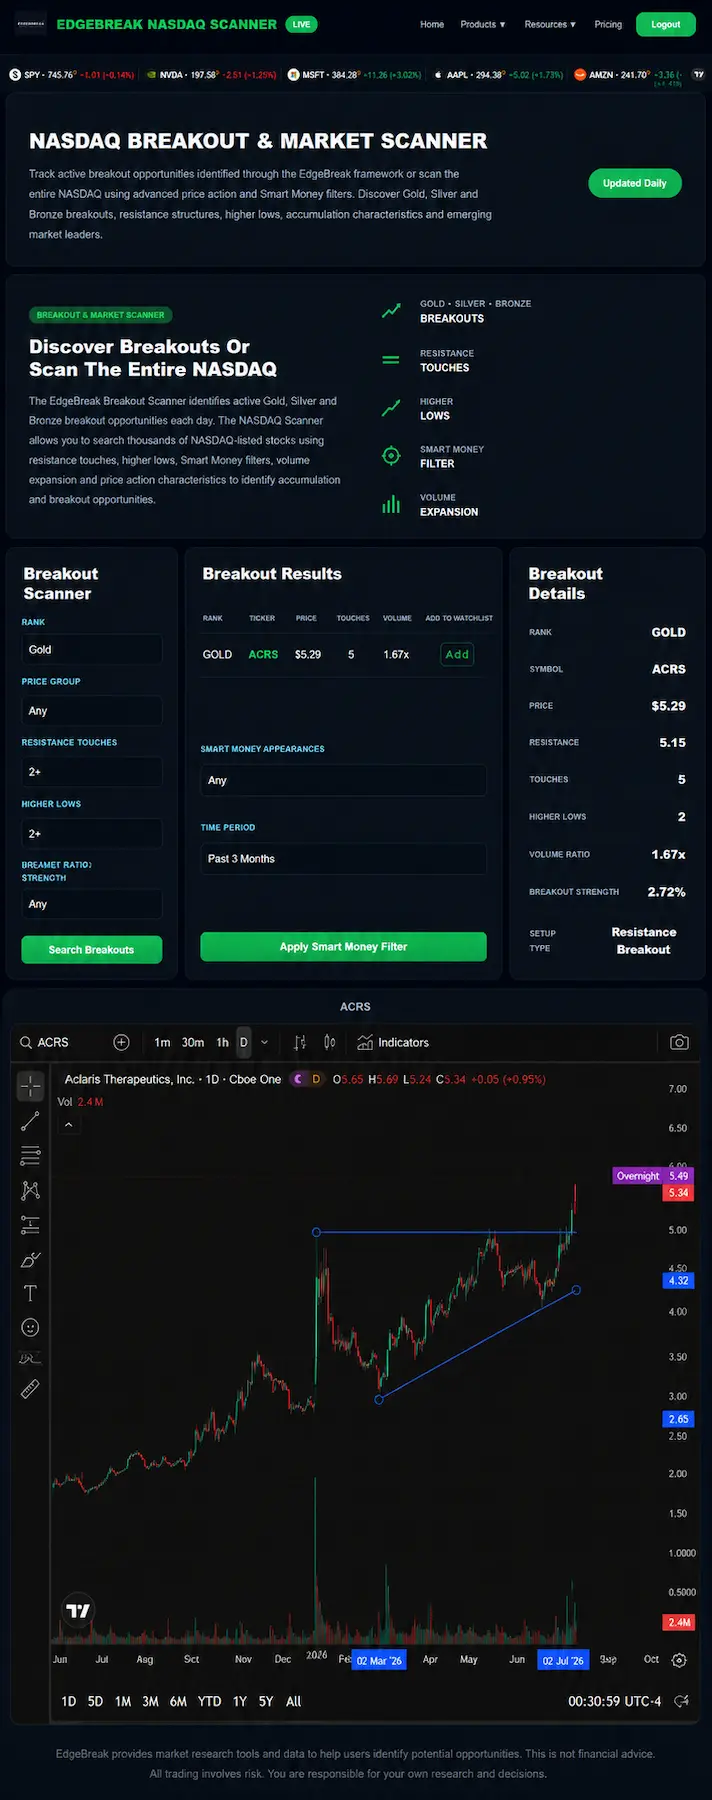
While the NASDAQ Scanner focuses on developing opportunities, the Breakout Scanner highlights stocks that have already broken above resistance according to the EdgeBreak breakout model.
Breakouts are grouped into Gold, Silver and Bronze categories based on the strength of their overall breakout characteristics, making it easier to organise ongoing research.
Smart Money Filter
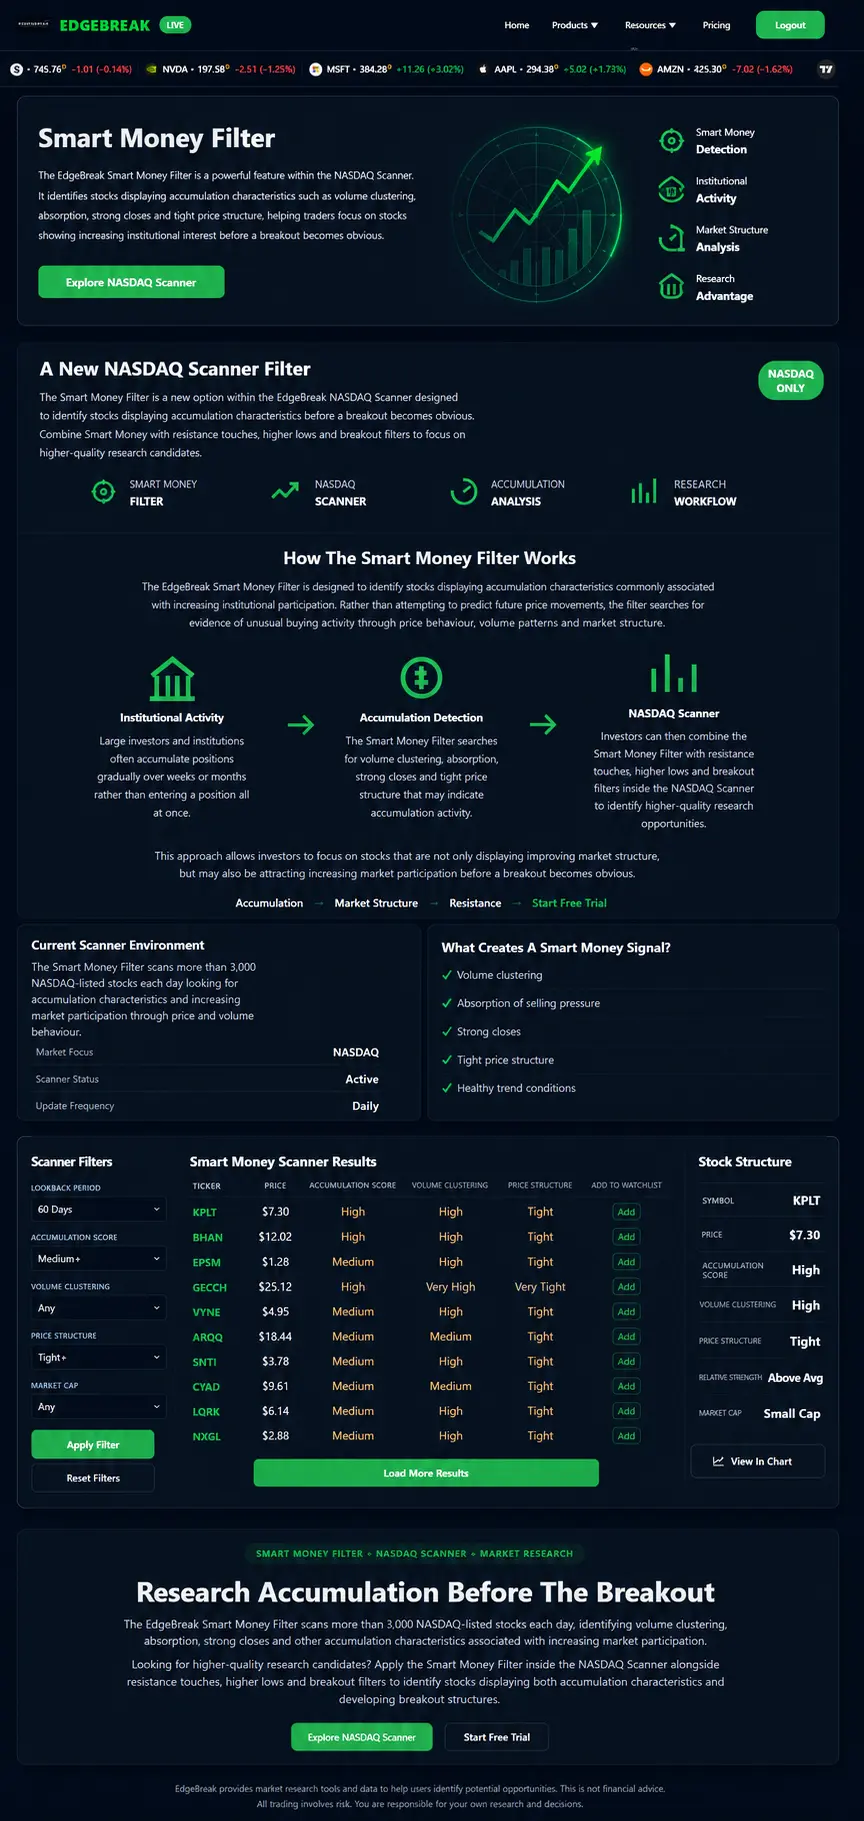
The Smart Money Filter allows members to narrow research candidates further by identifying stocks displaying additional accumulation characteristics. Rather than replacing your own analysis, it provides another layer of structured market research that can be combined with the scanners.
Strong research often comes from combining multiple characteristics rather than relying on a single indicator.
My Workspace
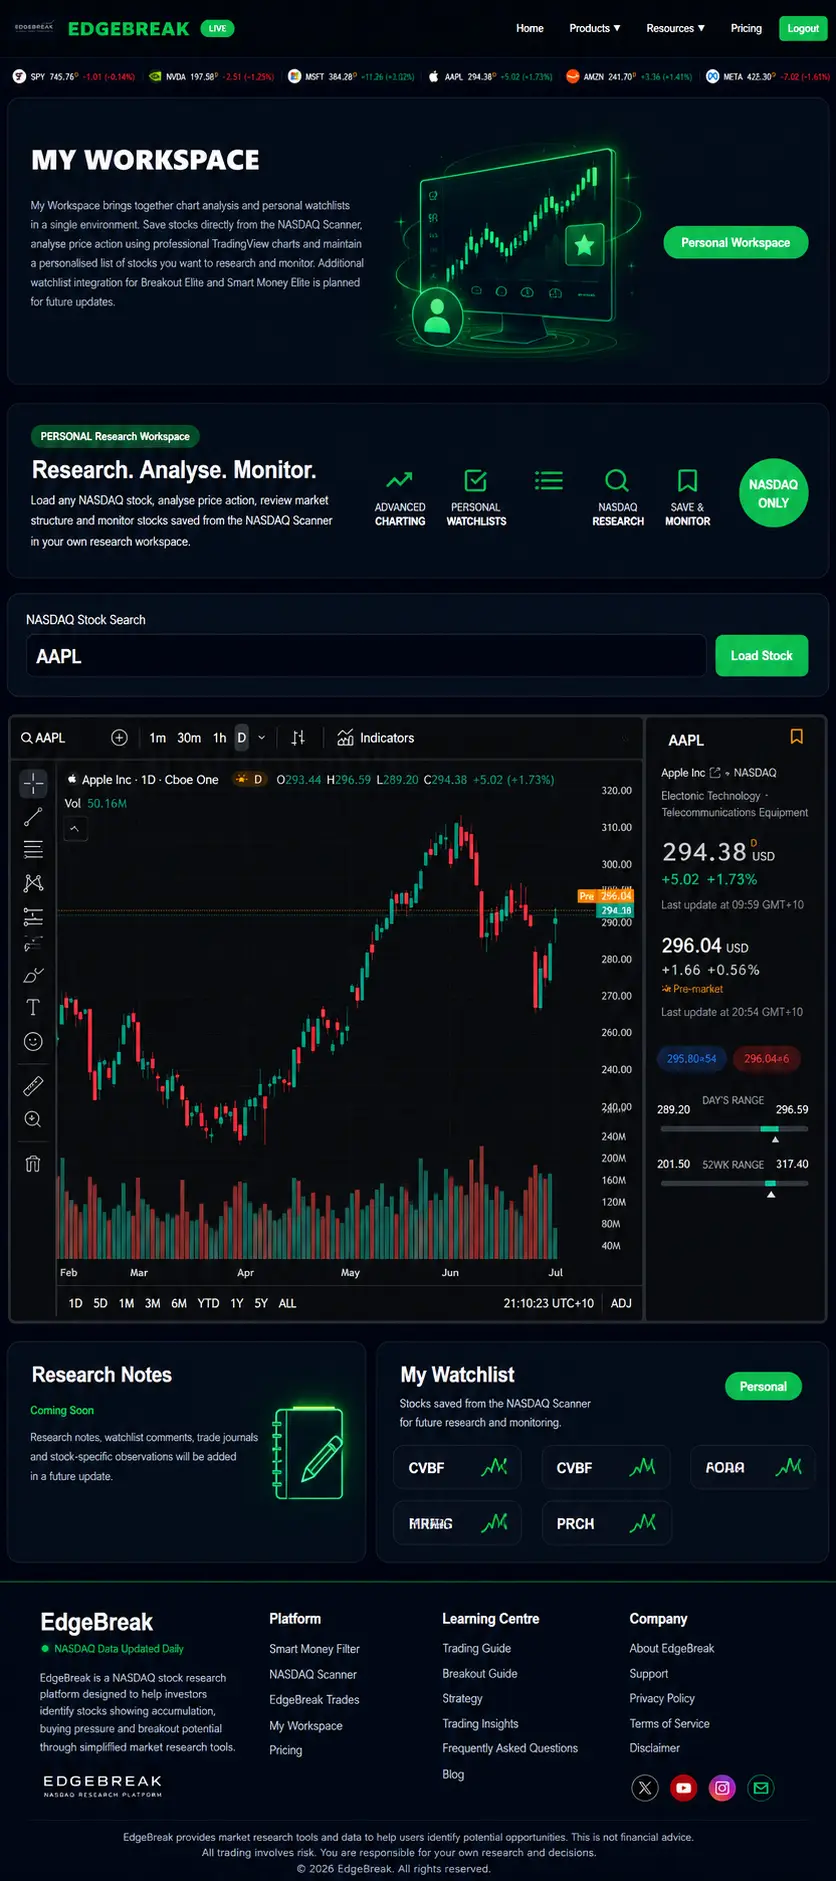
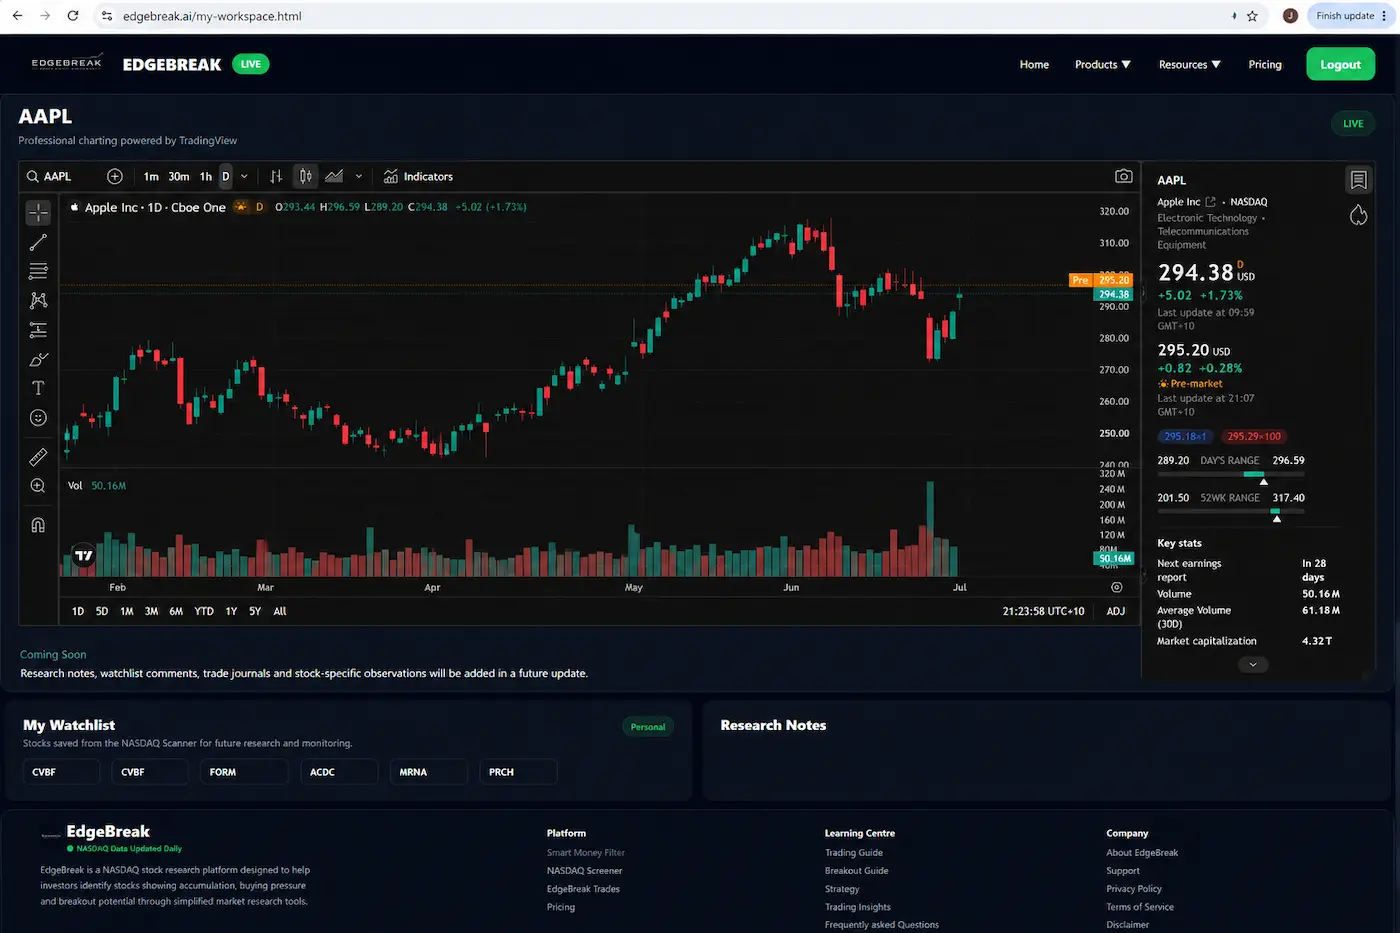
My Workspace is your personal research area within EdgeBreak. Here you can save stocks from the scanners, review TradingView charts, organise your watchlist and continue researching opportunities over time.
The goal is to create a repeatable workflow where interesting stocks are saved, reviewed and monitored rather than forgotten after a single scan.
Interactive Charts
Every saved stock can be analysed using interactive TradingView charts. Members can zoom through historical price action, study market structure and use TradingView drawing tools to mark important resistance levels, trend lines and areas of interest.
Charts allow investors to apply the concepts taught throughout the Academy to real market examples.
Building a Daily Research Routine
Consistency is one of the biggest advantages EdgeBreak provides. Rather than constantly searching for new opportunities throughout the day, many investors benefit from following a structured research routine.
- Review the Breakout Scanner.
- Search the NASDAQ Scanner.
- Apply the Smart Money Filter.
- Open charts for interesting stocks.
- Save promising candidates to My Workspace.
- Review your watchlist regularly.
Over time, this routine helps build consistency while reducing unnecessary market noise.
Lesson Summary
Every feature within EdgeBreak has been designed to support a structured research process. By combining the NASDAQ Scanner, Breakout Scanner, Smart Money Filter and My Workspace, members can organise their research more efficiently and develop a repeatable workflow focused on quality rather than quantity.
Key Takeaways
- Begin your research using the NASDAQ Scanner.
- Review active opportunities with the Breakout Scanner.
- Use the Smart Money Filter to refine research candidates.
- Save promising stocks to My Workspace.
- Follow a consistent daily research routine.
Research Reminder
EdgeBreak provides educational content and structured market research tools designed to support independent analysis. The platform does not provide financial advice, investment recommendations or predictions of future market performance.
Continue Your Journey
Lesson 2.1 – Understanding Candlesticks
Learn how candlesticks represent buying and selling pressure, identify bullish and bearish market sentiment, and build the foundation needed to interpret price action throughout the EdgeBreak framework.