Understanding Candlesticks
Every price chart is built from candlesticks. Learning how to read them is one of the first steps towards understanding market behaviour. While a single candle never predicts what will happen next, groups of candlesticks provide valuable information about buying pressure, selling pressure and overall market sentiment.
What You'll Learn
- What a candlestick represents.
- How to identify bullish and bearish candles.
- What candle bodies and wicks tell us.
- Why closing prices matter.
- How candlesticks fit into breakout research.
What Is a Candlestick?
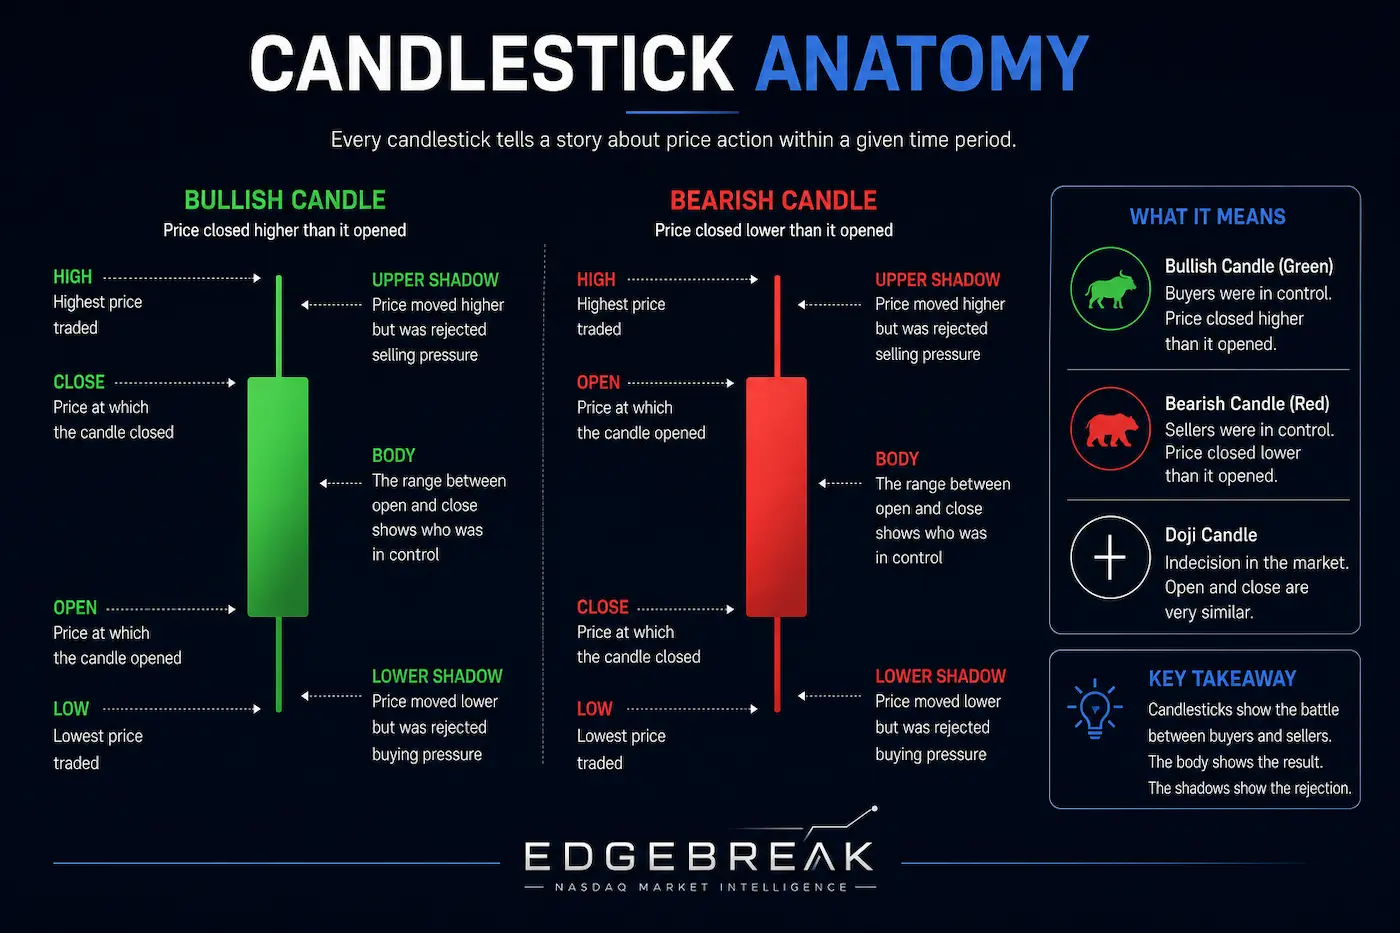
A candlestick represents the price movement of a stock over a specific period of time. Depending on the chart you're viewing, each candlestick may represent one minute, one hour, one day or even one week of trading activity.
Every candlestick contains four important pieces of information:
- Opening Price
- Highest Price
- Lowest Price
- Closing Price
Together, these values provide a visual summary of how buyers and sellers interacted during that period.
Bullish Candles
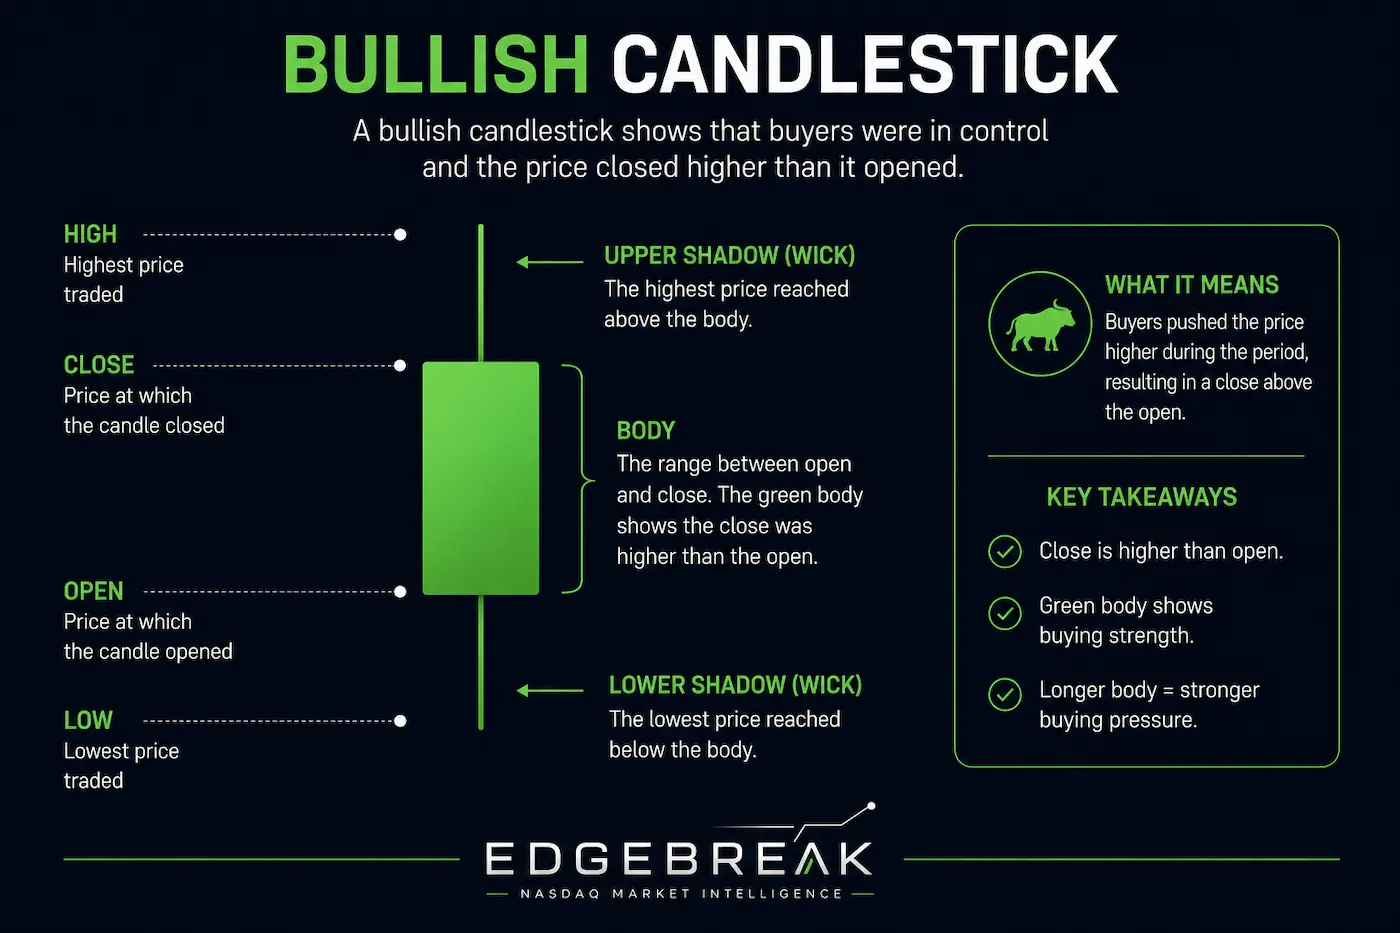
A bullish candlestick closes above its opening price. This shows that buyers were able to push the price higher during the trading session.
Large bullish candles often indicate strong buying pressure, particularly when they occur near important resistance levels or during confirmed breakout moves.
However, one bullish candle alone does not confirm a trend. Candlesticks should always be viewed within the context of the broader market structure.
Bearish Candles
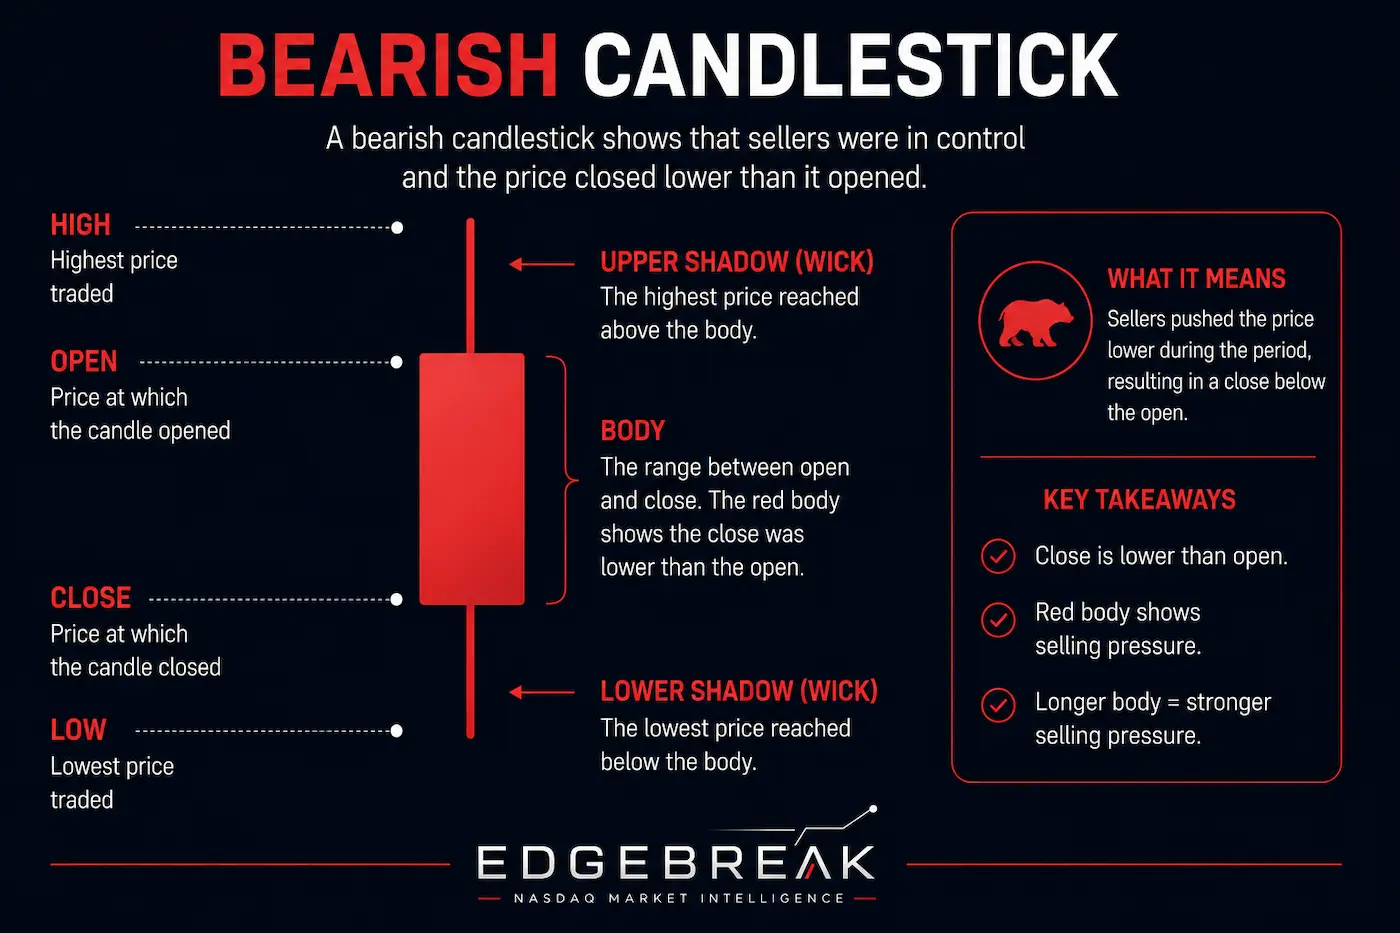
A bearish candlestick closes below its opening price, indicating that sellers controlled the session.
During healthy uptrends, bearish candles are completely normal. Markets rarely move in a straight line, and temporary pullbacks often occur before trends continue.
The key is understanding whether bearish candles represent normal consolidation or genuine weakness within the broader market structure.
Understanding Wicks
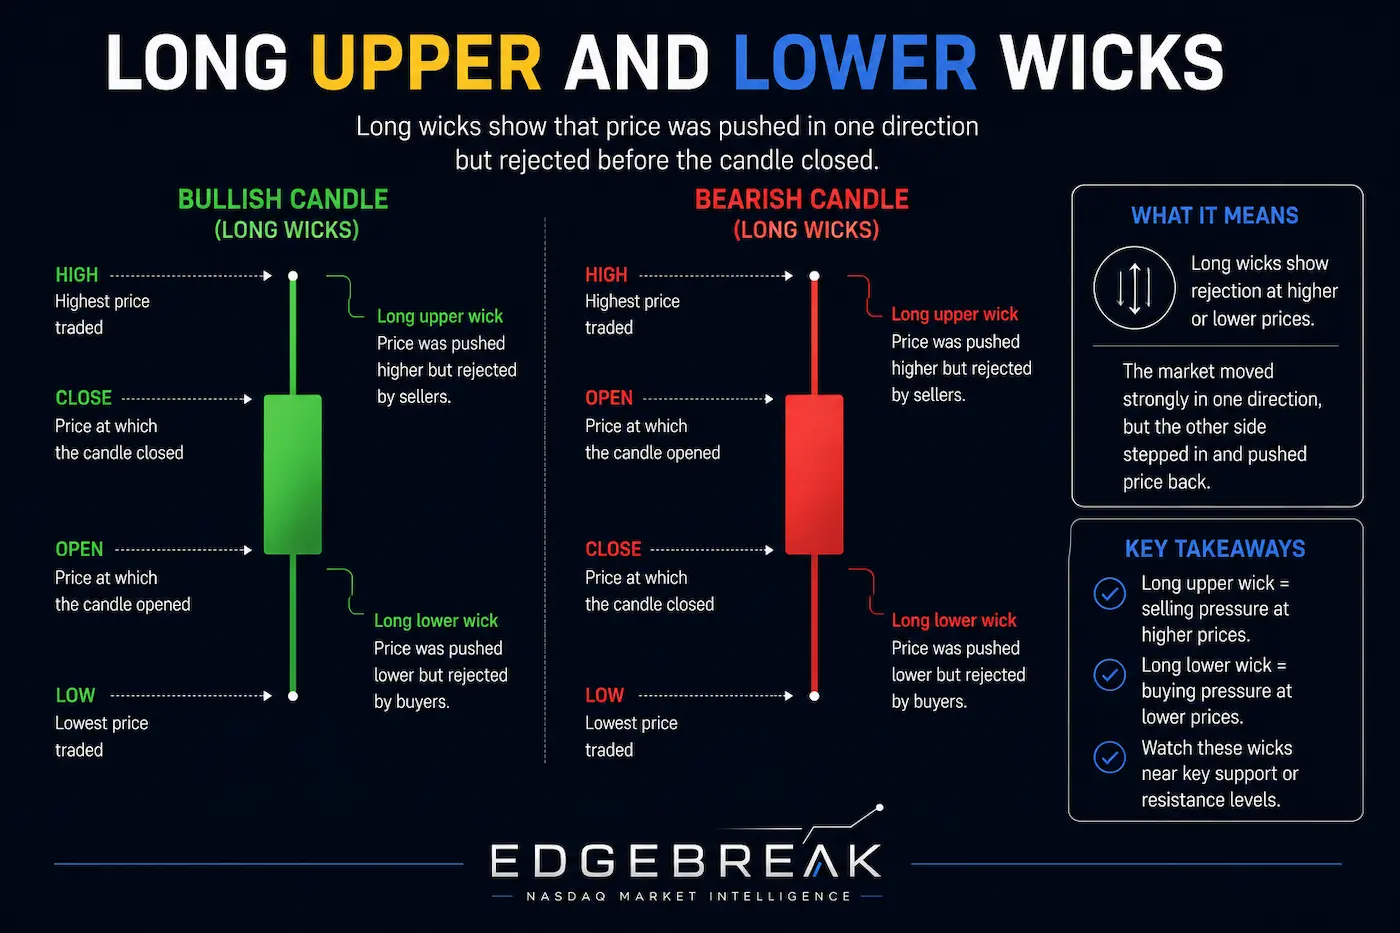
The thin lines extending above and below the candle body are called wicks (sometimes referred to as shadows).
Wicks show where price traded before buyers or sellers pushed it back toward the closing price.
Long upper wicks can indicate selling pressure, while long lower wicks may suggest buyers stepped in after price declined.
Neither automatically predicts future movement, but they provide useful context when combined with market structure.
Why Closing Prices Matter
Many investors pay close attention to where a candlestick closes rather than simply how far price moved during the day.
Strong closes near the session high often demonstrate continued buying interest, while weak closes near the session low may indicate sellers remained in control.
During breakout research, stronger closing prices around resistance levels can provide additional context when analysing potential opportunities.
Looking Beyond Individual Candles
Beginners often spend too much time searching for individual candlestick patterns.
While candlestick formations can provide useful information, EdgeBreak places greater emphasis on the overall market structure. One candle rarely tells the complete story.
Instead, investors should learn to observe how groups of candlesticks form higher lows, test resistance and build orderly price structures over time.
How Candlesticks Support Breakout Research
Throughout the Academy, candlesticks become one piece of a much larger research process.
Rather than analysing candles in isolation, you'll learn to combine them with:
- Market Structure
- Support and Resistance
- Higher Lows
- Volume Behaviour
- Accumulation Characteristics
- EdgeBreak Scanner Results
When these factors work together, they often provide a much clearer picture than any individual candlestick pattern.
Lesson Summary
Candlesticks provide a visual representation of buying and selling activity over time. Understanding candle bodies, wicks and closing prices helps investors interpret price action, but the greatest value comes from combining candlestick analysis with broader market structure and other research tools.
Key Takeaways
- Every candlestick shows the open, high, low and close.
- Bullish candles reflect buying pressure.
- Bearish candles reflect selling pressure.
- Wicks provide additional information about market behaviour.
- Never analyse candlesticks in isolation.
- Always combine candlesticks with market structure and price action.
Common Beginner Mistakes
- Believing one candlestick predicts the future.
- Ignoring the overall market trend.
- Trading purely on candlestick patterns.
- Overlooking resistance and higher lows.
- Ignoring volume and market context.
Research Reminder
Candlestick analysis is one part of technical analysis and should always be considered alongside broader market structure and independent research. EdgeBreak provides educational content and research tools only and does not provide financial advice or investment recommendations.
Continue Your Journey
Lesson 2.2 – Support vs Resistance
Learn how support and resistance levels form, why price repeatedly reacts around these key areas, and why resistance is one of the most important concepts in researching potential breakout opportunities.