Learn how investors research breakout opportunities using resistance levels, higher lows, volume expansion and market structure. This guide explains the concepts behind breakout analysis and the factors many investors consider when evaluating potential opportunities.
EdgeBreak helps investors research NASDAQ stocks displaying accumulation, buying pressure and breakout characteristics through a structured, data-driven approach.
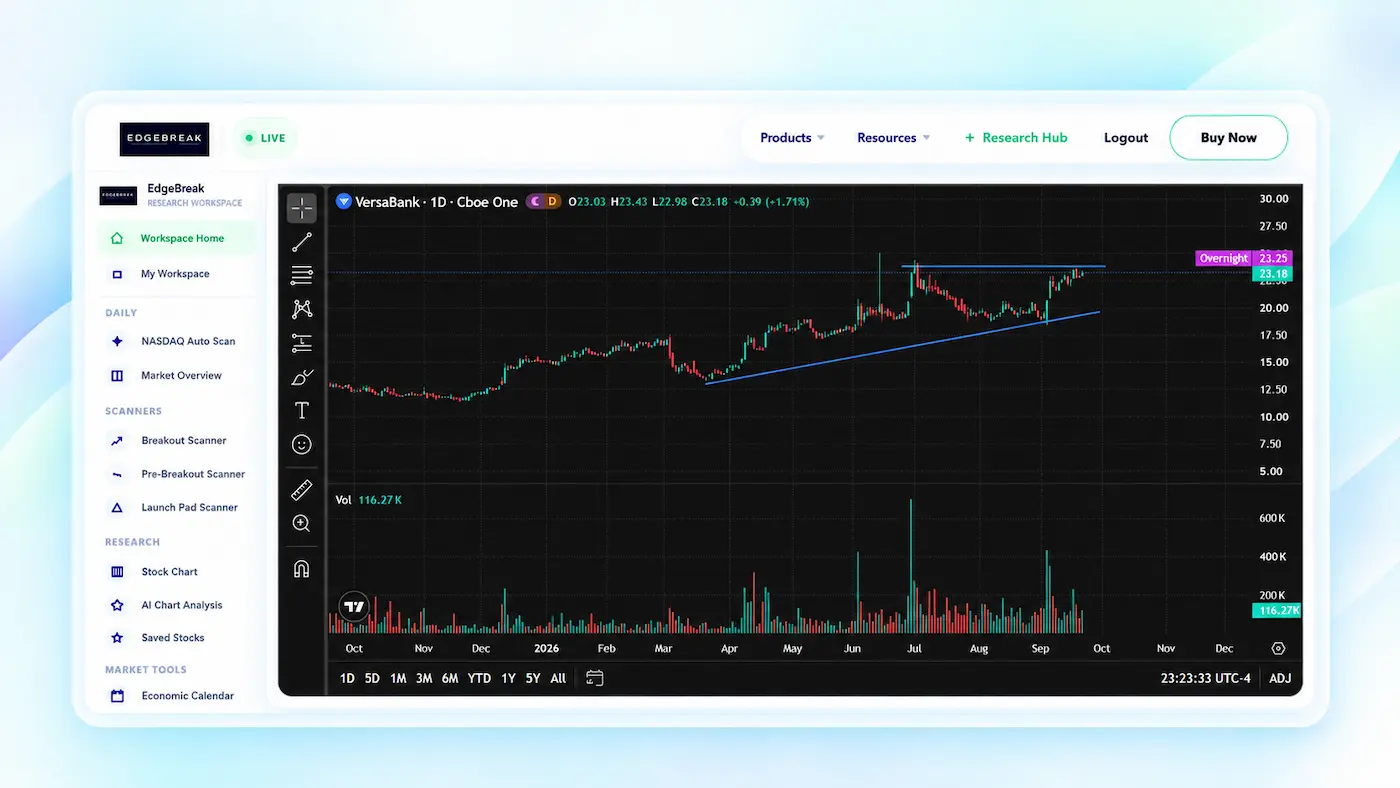
A breakout occurs when a stock moves above a well-defined resistance level after a period of consolidation.
Many investors monitor breakouts because they can indicate increasing demand, improving market sentiment and a potential shift in market structure.
Not all breakouts succeed. This is why many investors also analyse volume, price action and broader market conditions before researching opportunities further.
Resistance is a price level where selling pressure has historically prevented a stock from moving higher.
When a stock repeatedly tests resistance without breaking through, investors often pay close attention because it may signal increasing buying pressure.
Higher lows occur when buyers step in at progressively higher prices during a consolidation phase.
This behaviour can indicate increasing demand and may suggest that buying pressure is gradually absorbing available supply.
Volume provides insight into participation and conviction behind a price move.
Many investors analyse volume because stronger participation can help validate price action and provide additional context around potential breakouts.
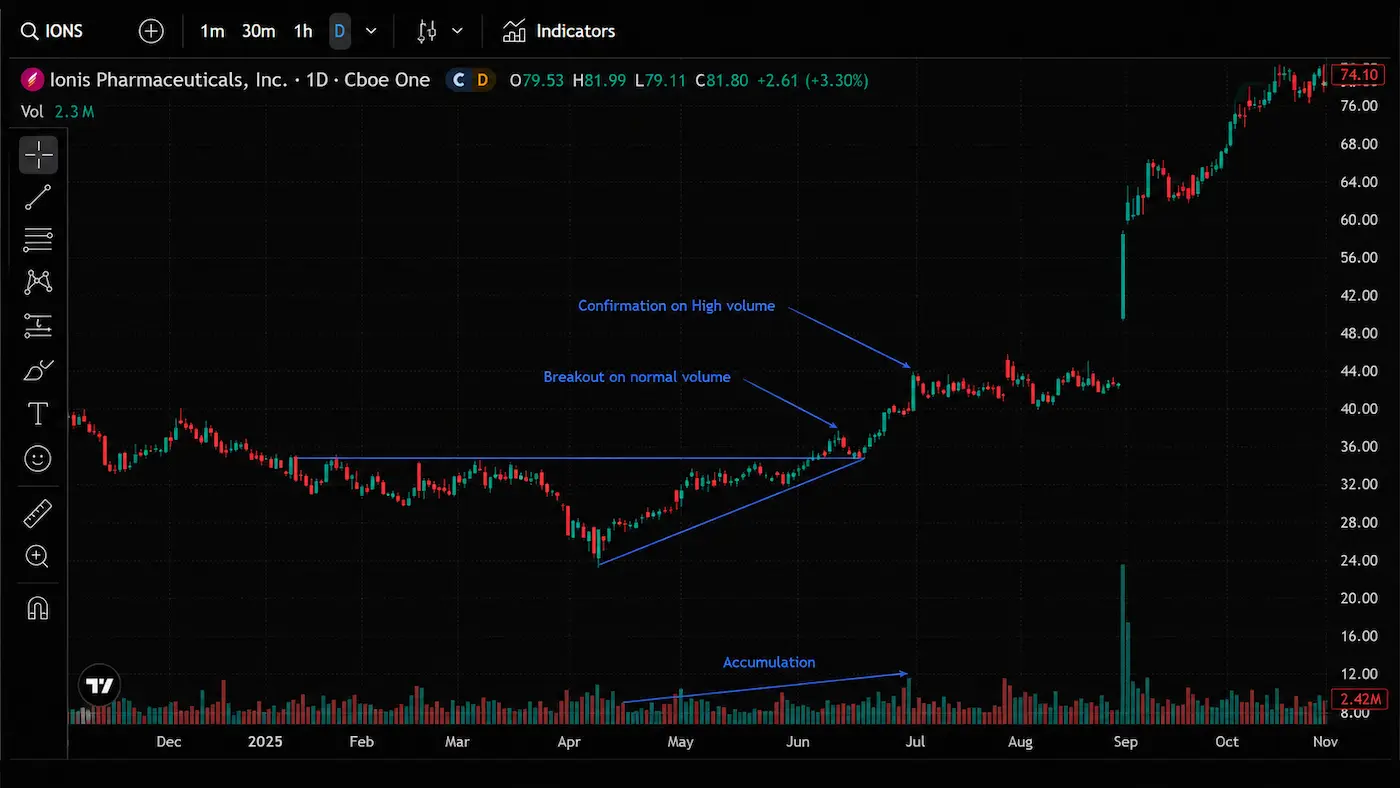
Many breakout opportunities do not appear suddenly. In many cases, stocks spend weeks or even months building a foundation before attempting to move higher.
This process is often referred to as accumulation. During accumulation, buyers gradually absorb available supply while price remains within a relatively defined range.
Although accumulation can take many forms, investors often look for characteristics such as improving price structure, repeated support at higher levels and increasing participation as a stock approaches resistance.
Accumulation does not guarantee a breakout will occur. However, many investors monitor these characteristics because they may indicate growing interest in a stock before a significant price move develops.
The EdgeBreak Smart Money Filter focuses on identifying stocks displaying accumulation characteristics and increasing market participation across the NASDAQ market. By analysing volume clustering, absorption, strong closes and tight price structure, the filter helps investors identify stocks that may be experiencing accumulation before a breakout becomes obvious.
While breakout opportunities can attract significant attention, many breakouts fail to produce sustained upward movement. Understanding why breakouts fail can be just as important as understanding why they succeed.
A breakout occurs when price moves above resistance, but a successful breakout typically requires continued demand after the initial move. Without sufficient buying pressure, price can quickly return back into its previous trading range.
Investors often research several factors when evaluating breakout quality, including market structure, volume participation and the strength of the build-up beneath resistance.
Many unsuccessful breakouts show signs of weakness before the breakout attempt occurs. For this reason, investors often analyse the quality of the setup rather than focusing solely on the breakout itself.
The EdgeBreak framework places significant emphasis on structure, accumulation characteristics and volume behaviour because these factors can provide additional context when researching breakout opportunities.
A breakout alone does not necessarily indicate strength. Many investors place greater importance on the structure leading into the breakout than on the breakout event itself.
Many of the strongest historical opportunities tracked by EdgeBreak spent weeks building beneath resistance before eventually breaking higher. Understanding accumulation can help investors better recognise developing market structure.
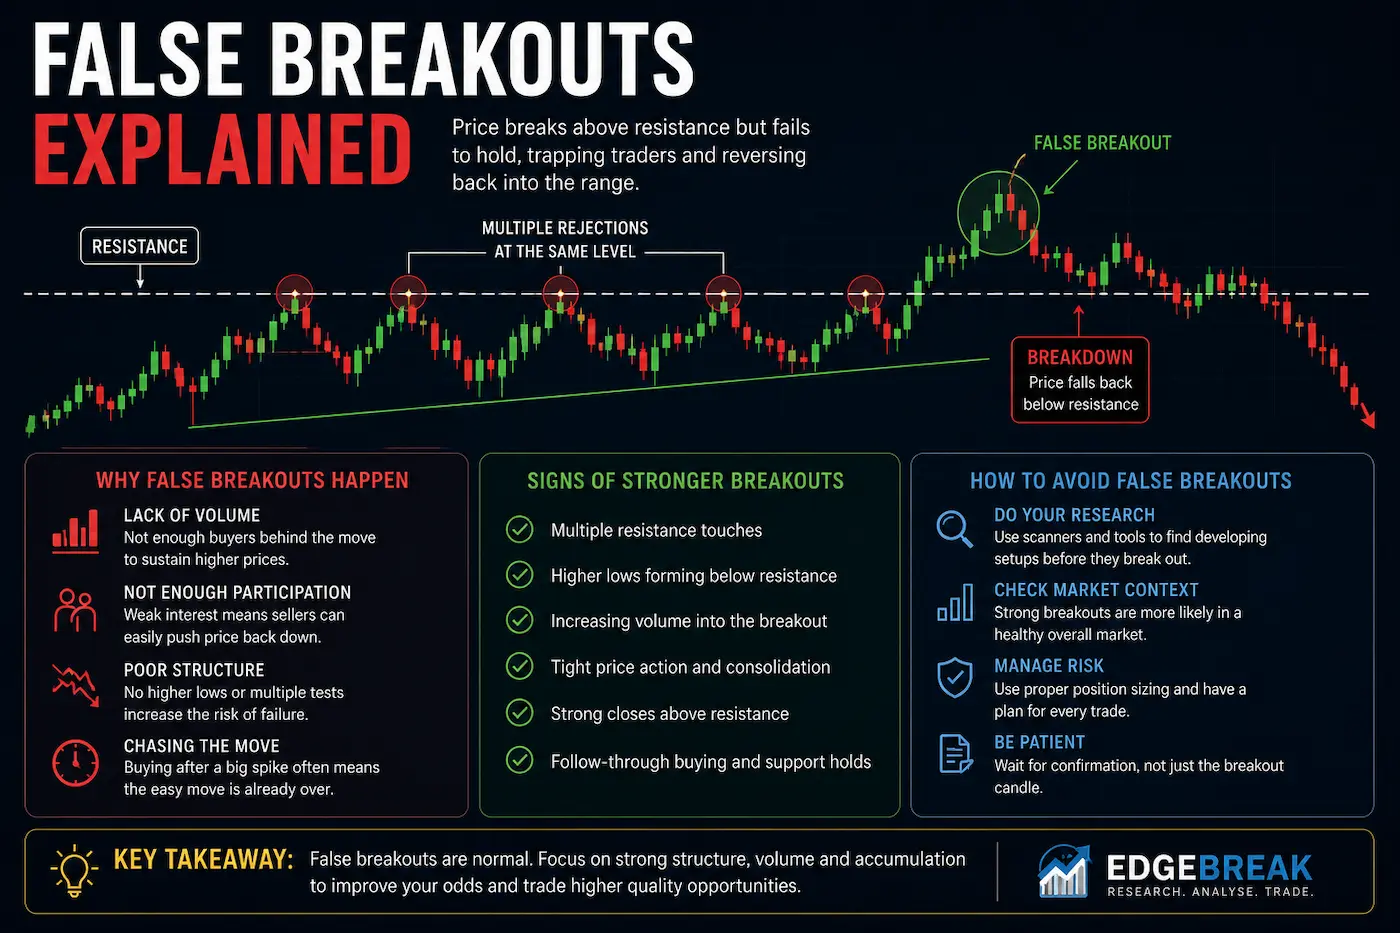
Not every breakout continues higher. Some stocks briefly move above resistance before reversing back into their previous range.
These situations are often referred to as false breakouts.
Researching breakout opportunities manually can be time-consuming. Investors often need to review hundreds or even thousands of charts looking for resistance levels, higher lows, accumulation characteristics and volume expansion.
EdgeBreak was built to simplify this process by applying a structured research framework across the NASDAQ market each day.
Rather than manually searching for opportunities, investors can use EdgeBreak to identify stocks displaying characteristics commonly associated with accumulation, buying pressure and breakout potential.
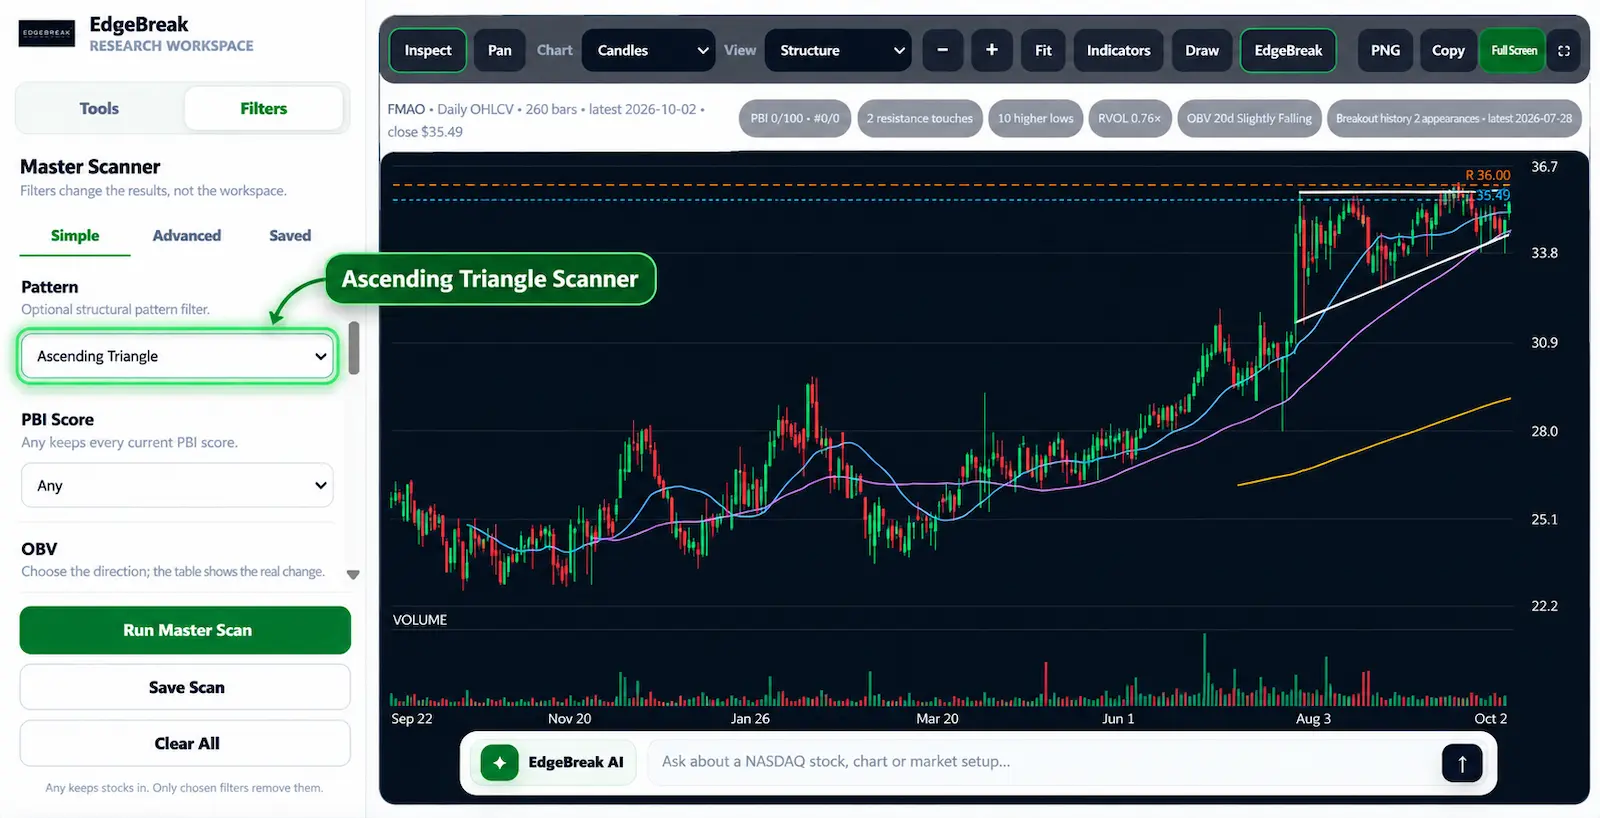
Search thousands of NASDAQ stocks using resistance touches, higher lows, volume expansion and market structure filters.
Identify stocks displaying accumulation characteristics, increasing market participation and signs of sustained buying pressure before a breakout becomes obvious.
Review opportunities currently being tracked through the EdgeBreak research framework.
Every tracked opportunity remains part of the historical record, helping investors understand both successful and unsuccessful outcomes.
The goal is not to predict future market outcomes. The goal is to provide a structured and transparent way to research NASDAQ stocks displaying specific market characteristics.
By combining scanners, watchlists, historical tracking and educational resources, EdgeBreak helps investors build a more consistent research process over time.
A breakout stock is a stock that moves above a significant resistance level after a period of consolidation. Many investors monitor breakouts because they can indicate increasing demand and changing market structure.
Breakouts are often associated with increasing demand, improving market sentiment and sustained buying pressure. However, multiple factors can contribute to a breakout and no single factor guarantees success.
Breakouts may fail when there is insufficient buying pressure, weak volume participation or poor market structure leading into resistance. Many investors analyse these factors before researching opportunities further.
Higher lows occur when buyers consistently step in at progressively higher prices. Many investors view higher lows as a sign of improving market structure and increasing demand.
Volume provides insight into participation behind a price move. Many investors use volume analysis to better understand the strength of consolidation, accumulation and breakout activity.
Accumulation refers to a period where buying activity gradually absorbs available supply while a stock remains within a defined range. Some investors monitor accumulation characteristics when researching potential breakout opportunities.
EdgeBreak applies a structured research framework across NASDAQ-listed stocks, analysing factors such as resistance touches, higher lows, volume behaviour, accumulation characteristics and market structure.
No. EdgeBreak is a stock research platform that provides educational content, market analysis and research tools. It does not provide financial advice, investment recommendations or personal financial services.
EdgeBreak focuses exclusively on NASDAQ-listed stocks, allowing the platform to apply a consistent research framework across a specialised universe of companies.
EdgeBreak operates using an end-of-day process. Market data, scanners, watchlists and tracked opportunities are updated after each trading session.