EdgeBreak pricing

Choose how far you want to take your stock research.

Analyse charts with AI, unlock the full NASDAQ scanning and research platform, or bring the complete EdgeBreak workflow into ChatGPT.

✓ Clear monthly pricing ✓ Standard & Pro include an eligible 7-day trial ✓ Cancel anytime
EdgeBreak AI

Chart Analyzer

Analyse the charts you find with a dedicated chart workspace, AI analysis and similar-setup search.

$25
USD / month
1,000 EdgeBreak AI Credits per billing cycle
  • ✓Dedicated Chart Analyzer workspace
  • ✓Upload, drag, drop or paste chart images
  • ✓AI-assisted descriptive chart analysis
  • ✓Find Similar Setups across EdgeBreak's current NASDAQ universe
  • ✓Watchlist integration and first-party EdgeBreak charts
Chart tools only • Scanner platform not included
EdgeBreak

Standard

The complete EdgeBreak website with scanners, Chart Analyzer, Stock Hub, Workspace and AI research.

$35
USD / month
After your eligible 7-day free trial
  • ✓Everything in Chart Analyzer
  • ✓Automated Daily NASDAQ Scan
  • ✓NASDAQ Stock Scanner with Breakout, Pre-Breakout and Base filters
  • ✓PBI, OBV, RVOL and technical structure research
  • ✓Off-exchange and accumulation-style participation context
  • ✓Stock Hub, Workspace, watchlists and AI company research
No charge during the eligible 7-day trial
Chart Analyzer • $25/month

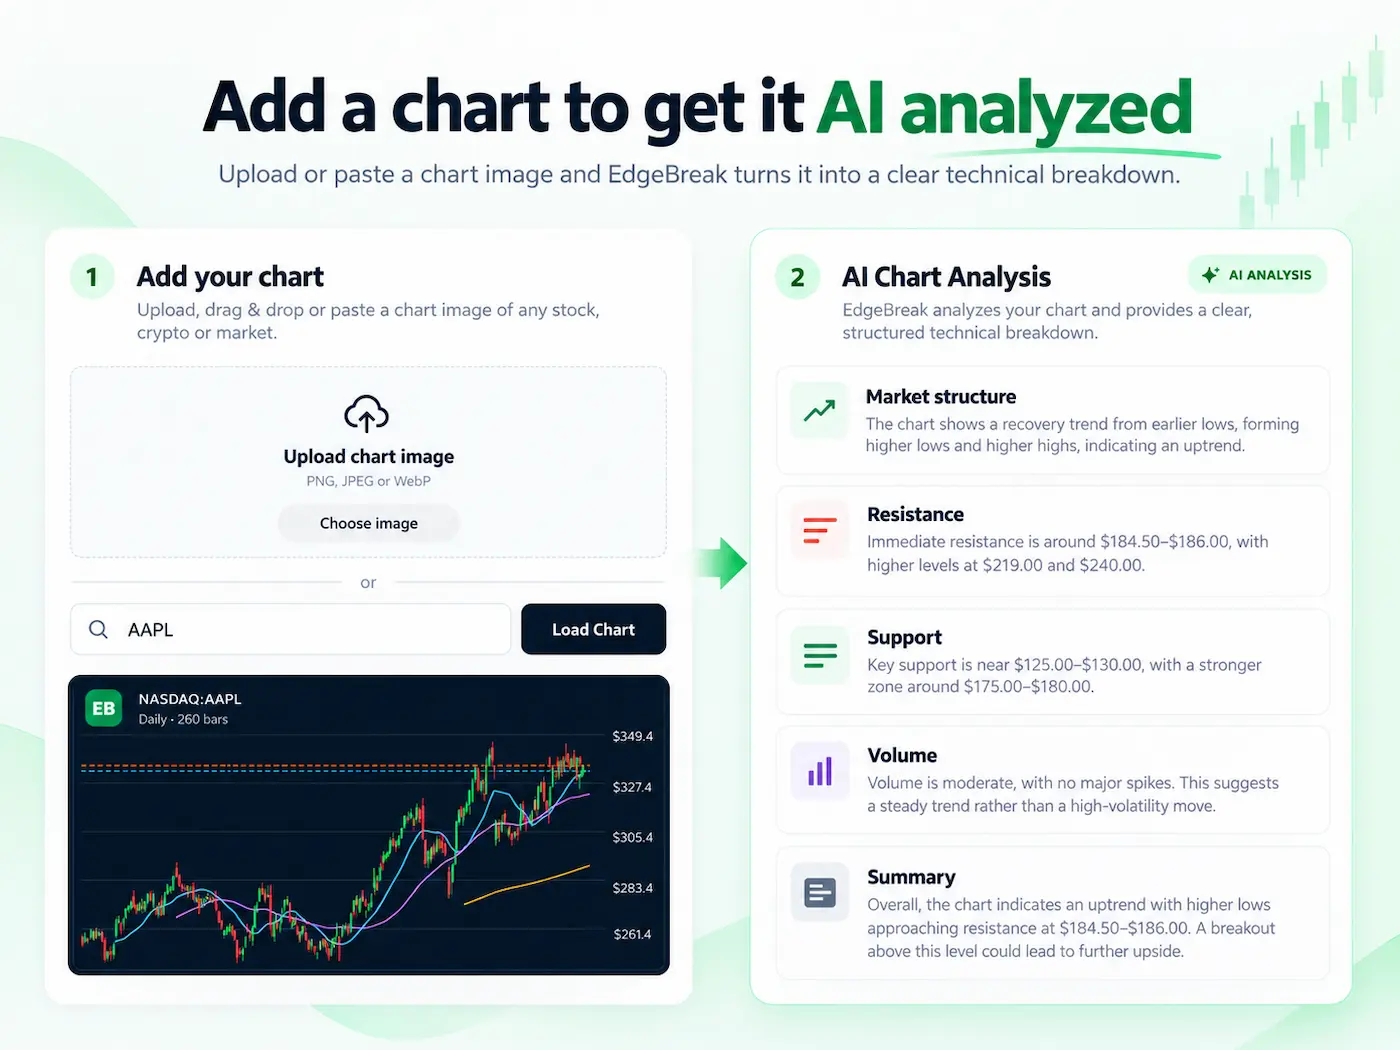
Drop in a chart. Let EdgeBreak do the first technical pass.

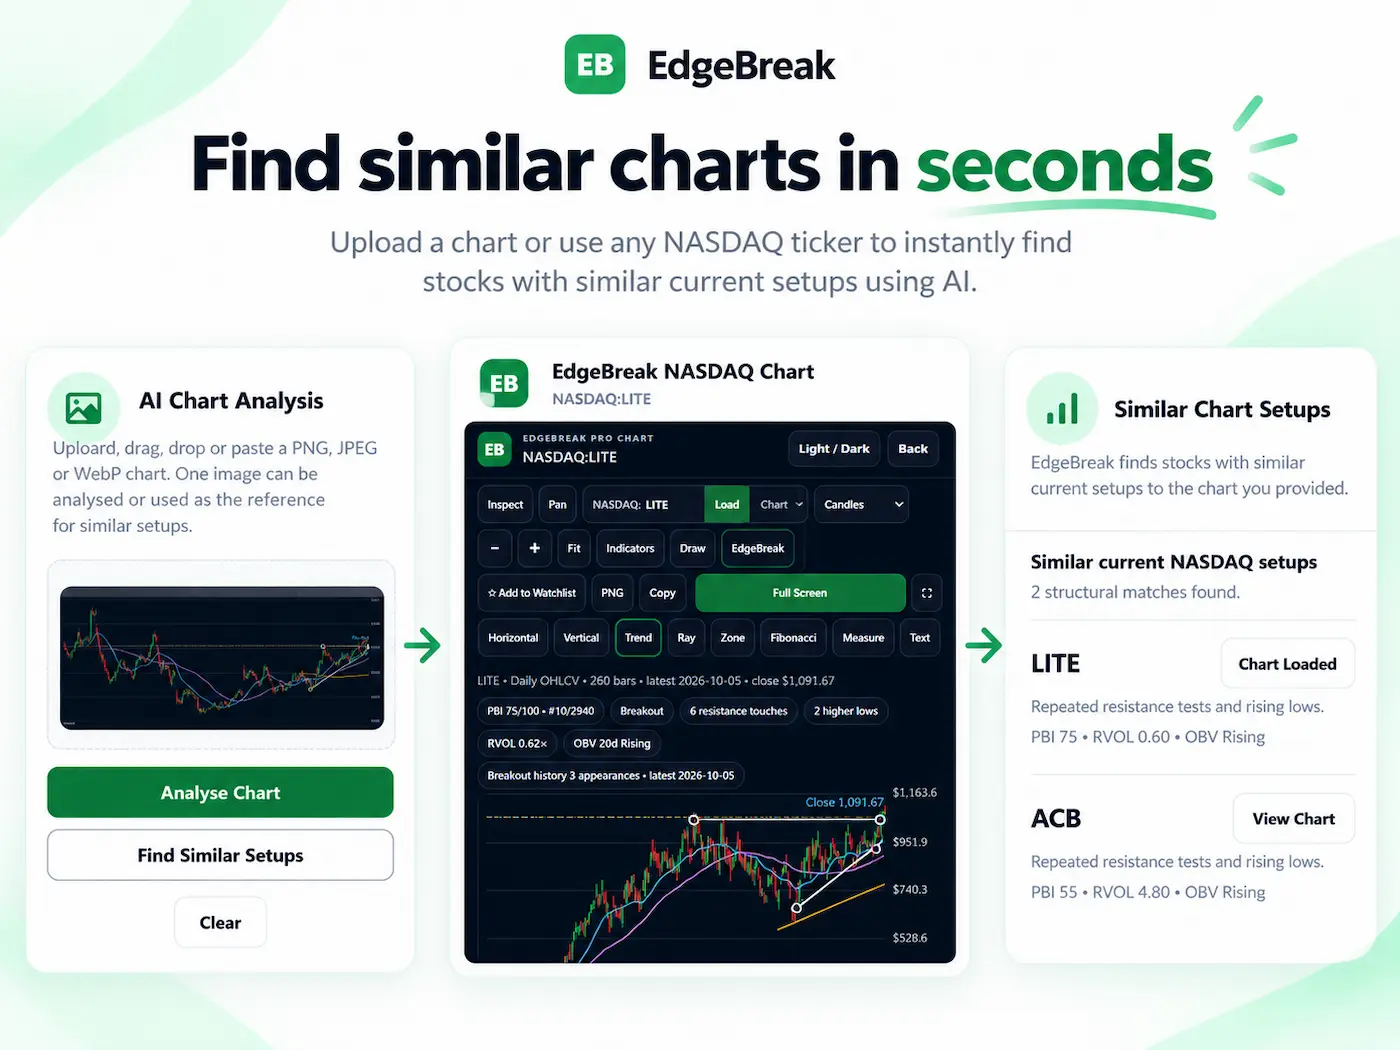
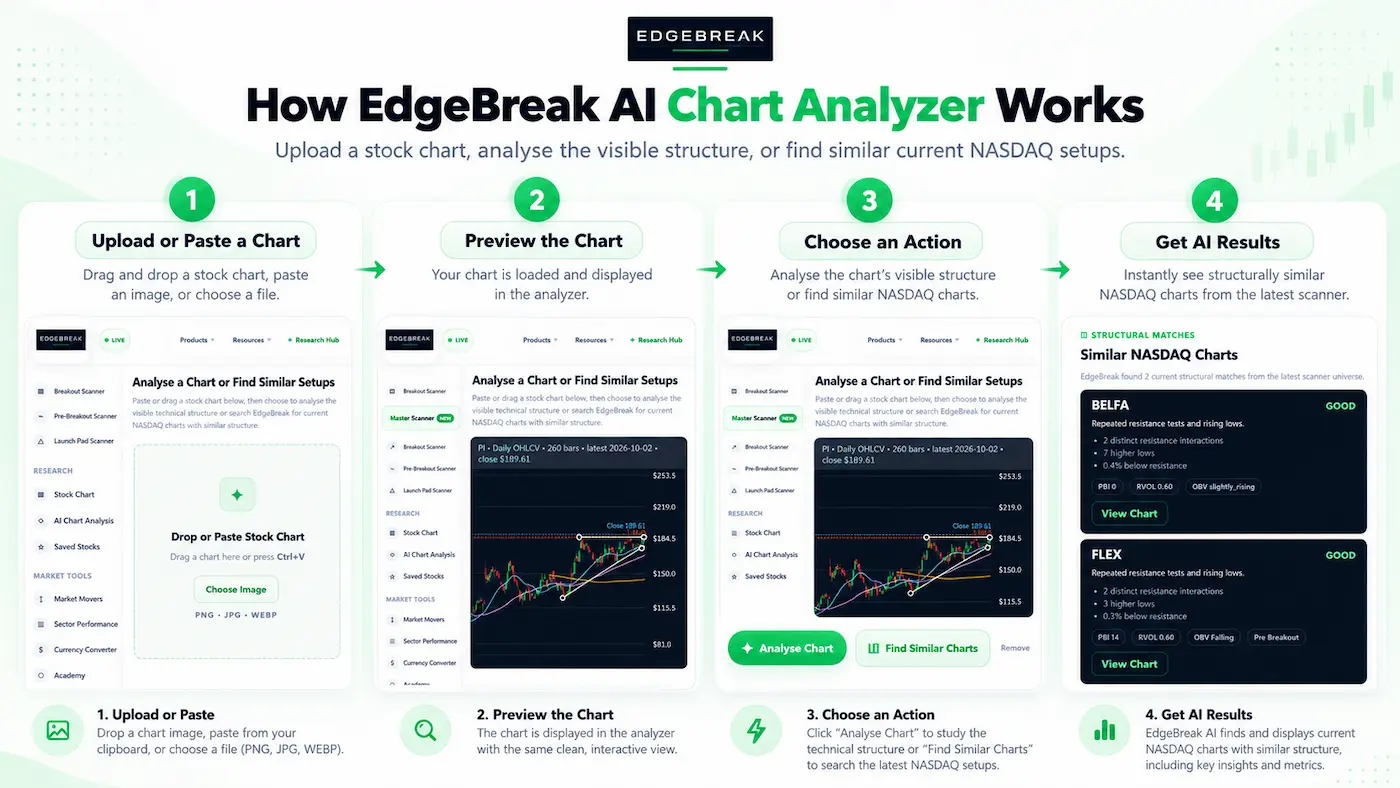
Chart Analyzer is for traders who already find charts and want a faster way to understand the setup. Upload or paste a chart, get structured AI analysis, then use that chart to search the current NASDAQ universe for similar structures.

✓AI breakdown of market structure, support, resistance and volume behaviour.
✓Find Similar Setups using the chart you supplied as the reference.
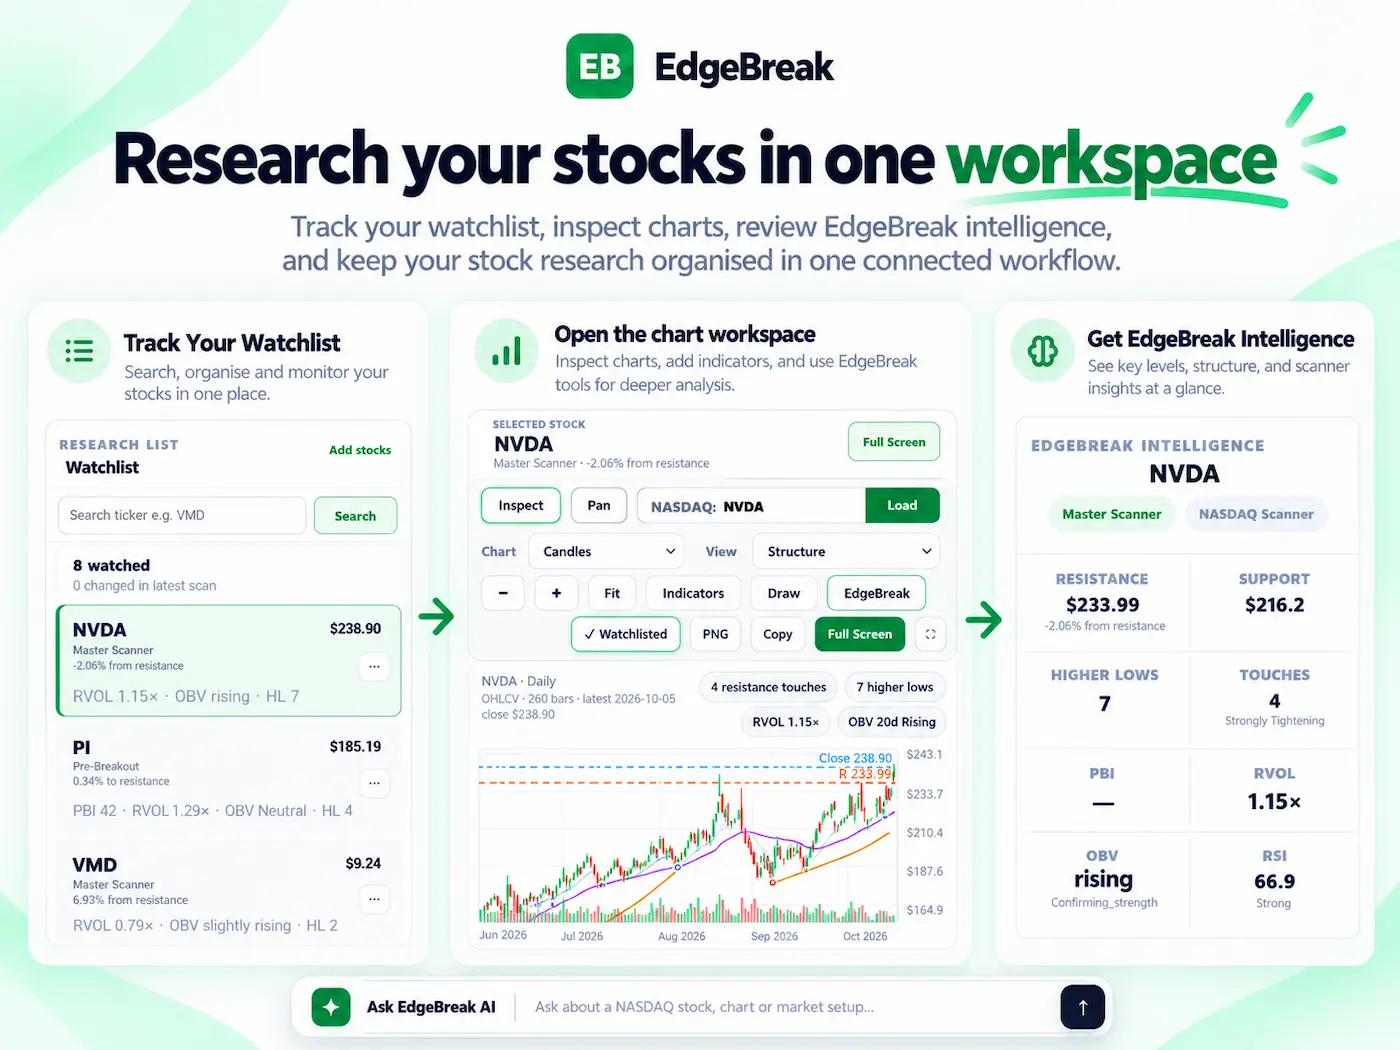
✓Open supported NASDAQ charts directly inside the EdgeBreak chart workspace.
$25USD / month
EdgeBreak AI chart analysis dashboard AI chart analysis
EdgeBreak find similar charts workflow Find similar charts
EdgeBreak Chart Analyzer workspace Chart workspace
Standard • $35/month

The complete EdgeBreak website research platform.

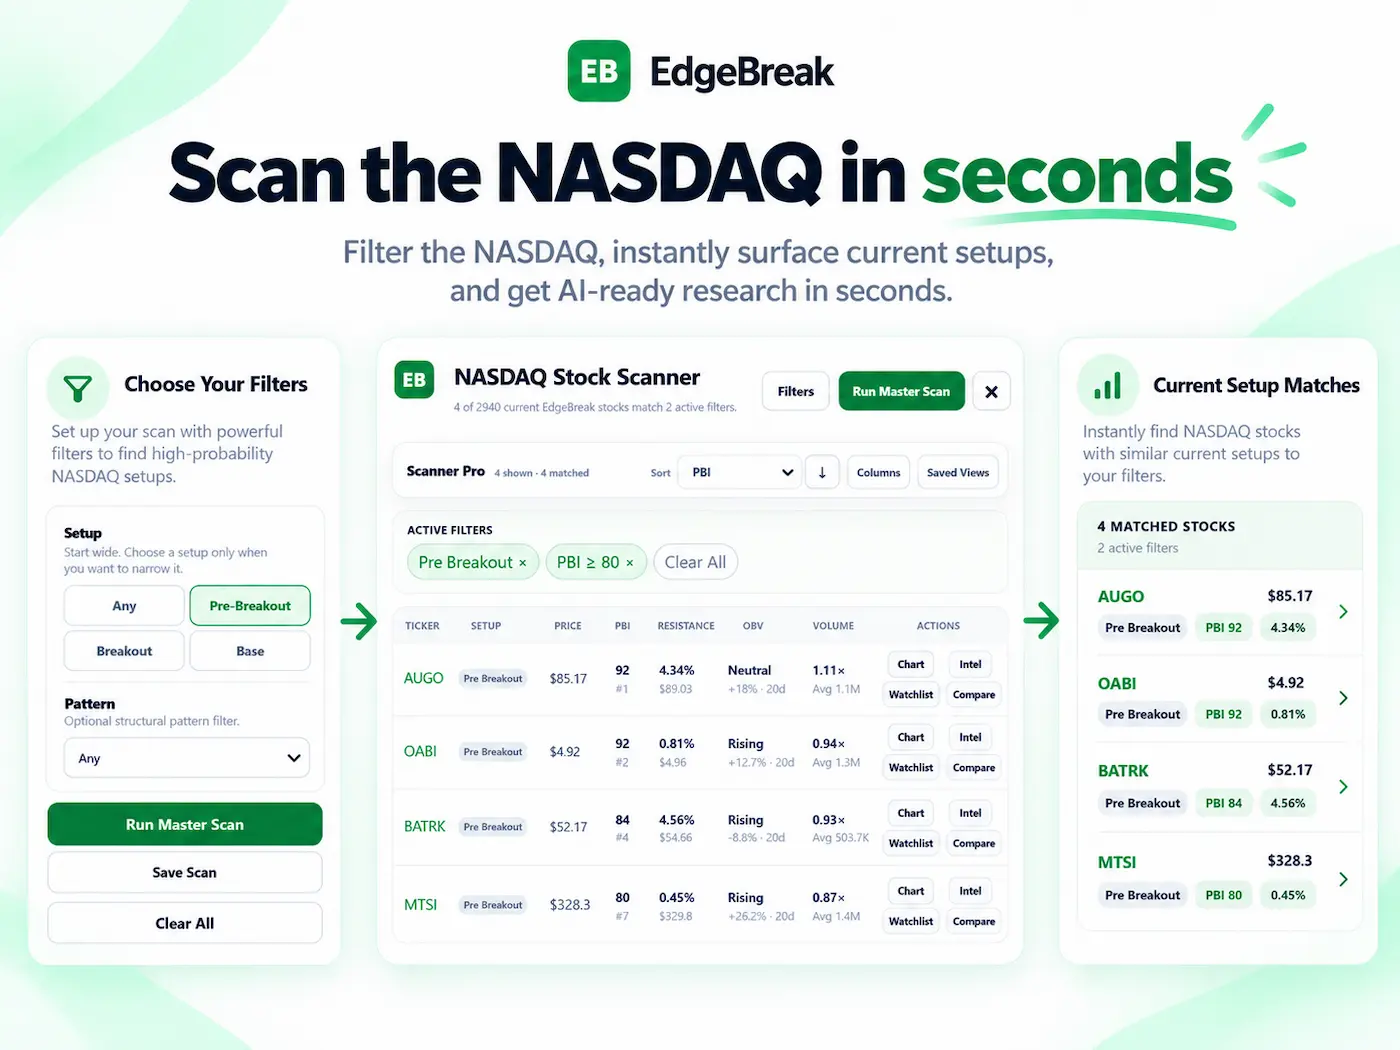
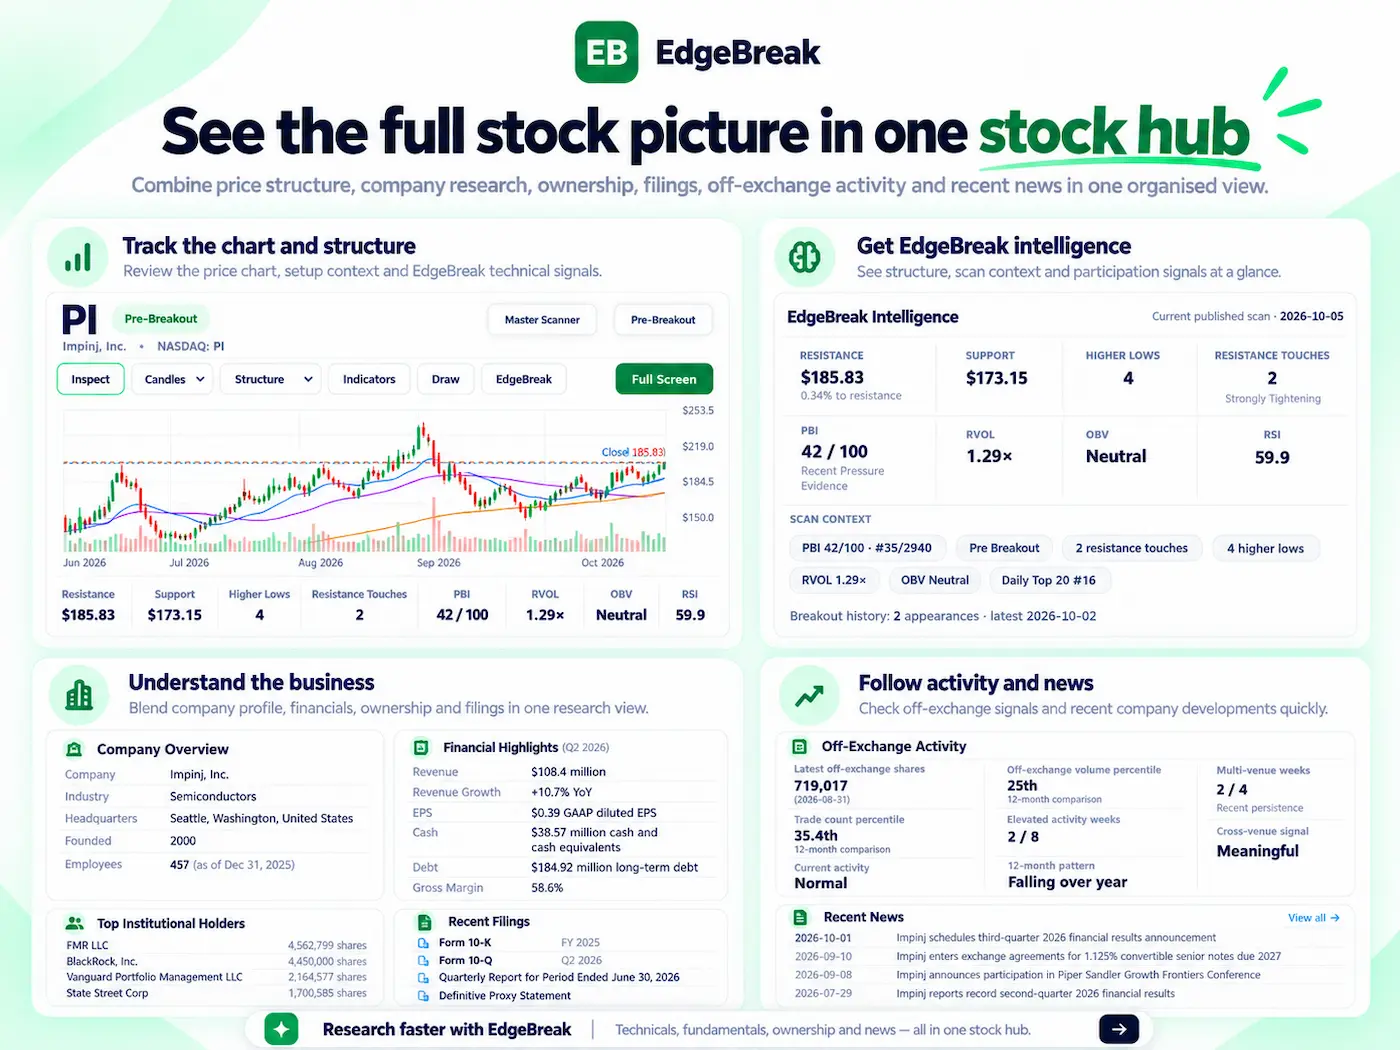
Standard adds discovery to the chart tools. EdgeBreak scans the NASDAQ for current setups, gives you a focused automated shortlist, and connects scanner results to charts, Stock Hub, Workspace, watchlists and AI company research.

✓NASDAQ Stock Scanner: Breakout, Pre-Breakout and Base setup filters plus advanced technical conditions.
✓Automated Daily Scan: a focused post-market research shortlist produced from the wider NASDAQ universe.
✓Participation research: PBI, OBV, RVOL, resistance, higher lows, off-exchange context and accumulation-style evidence where published.
✓Connected research: Chart Analyzer, Stock Hub, Workspace, watchlists and AI company research.
$35USD / month after eligible 7-day trial
EdgeBreak NASDAQ Stock Scanner dashboard NASDAQ Stock Scanner
EdgeBreak Workspace Workspace
EdgeBreak Stock Hub Stock Hub
Pro • $50/month

Everything in Standard, plus EdgeBreak inside ChatGPT.

Pro is the complete EdgeBreak workflow. Use the website when you want the visual scanner and research workspace, then continue inside ChatGPT when you want to ask for setups, charts, stock intelligence or refine a search conversationally.

✓Everything included in Standard.
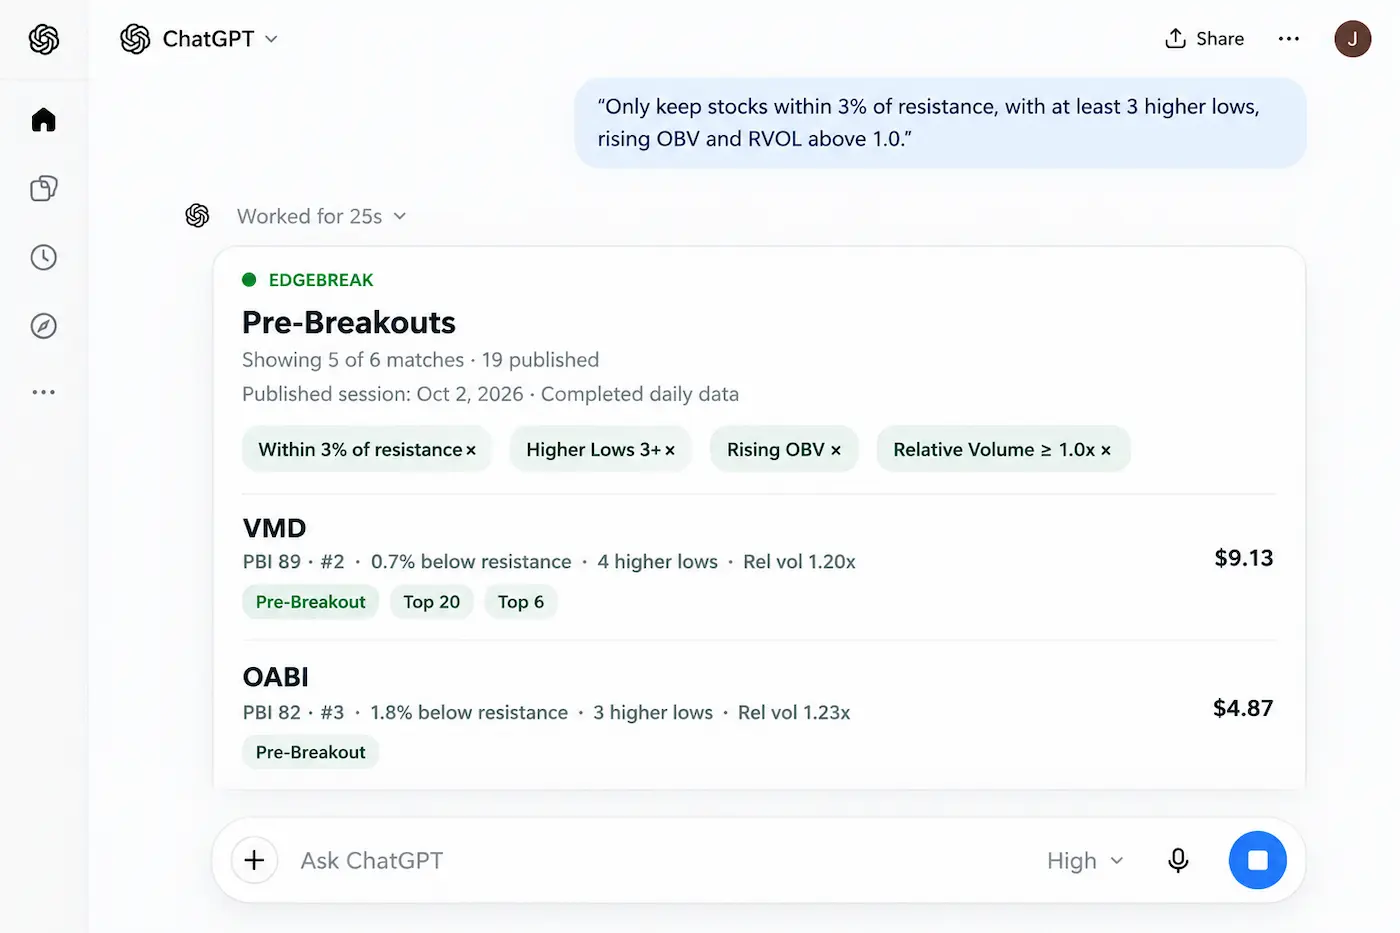
✓Ask EdgeBreak for scanner results and narrow them with natural follow-up instructions.
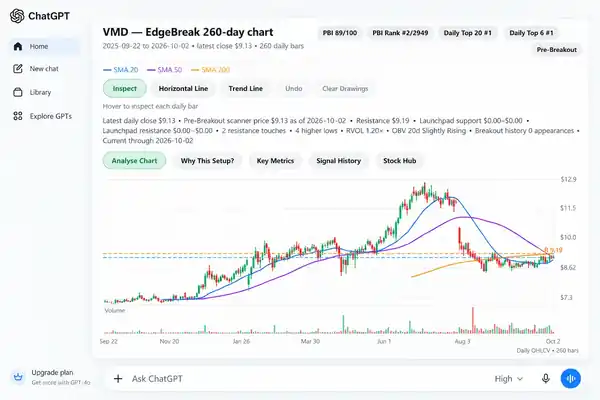
✓Open EdgeBreak charts and stock intelligence inside the ChatGPT workflow.
✓Move from discovery to deeper research without rebuilding the context each time.
$50USD / month after eligible 7-day trial
EdgeBreak scanner results inside ChatGPT Scanner results in ChatGPT
EdgeBreak chart results inside ChatGPT Charts in ChatGPT
EdgeBreak Standard website platform Everything in Standard
What Standard & Pro actually scan

More than a basic stock screener.

The NASDAQ Stock Scanner is built to narrow thousands of NASDAQ stocks into technical setups worth investigating, then connect those setups to participation and market-activity context.

EdgeBreak NASDAQ Stock Scanner with technical filters
Breakouts

Research stocks that have moved through established resistance, with structure and participation context available for follow-through review.

Pre-Breakouts

Find developing structures still beneath resistance, including higher lows, compression and improving setup quality.

Base setups

Surface organised bases and established trading ranges before they become obvious breakout events.

Off-exchange context

Review unusual off-exchange participation, persistence and multi-venue activity where EdgeBreak has published evidence.

Accumulation-style evidence

Compare price structure with OBV, participation and off-exchange footprints that may be consistent with accumulation-style activity.

Technical confirmation

Filter and sort with resistance, higher lows, RVOL, OBV, moving averages, pattern structure and other supported conditions.

Compare plans

Pick the workflow you actually need.

Chart Analyzer is focused on charts. Standard unlocks the full EdgeBreak website. Pro adds EdgeBreak inside ChatGPT.

Feature
Chart Analyzer
Standard
Pro
AI chart analysis
Included
Included
Included
Find Similar Setups
Included
Included
Included
NASDAQ Stock Scanner
Not included
Included
Included
Breakout / Pre-Breakout / Base filters
Not included
Included
Included
Automated Daily NASDAQ Scan
Not included
Included
Included
PBI / OBV / RVOL / structure research
Not included
Included
Included
Off-exchange & accumulation-style context
Not included
Included
Included
Stock Hub, Workspace & watchlists
Watchlist integration
Included
Included
AI company research
Not included
Included
Included
EdgeBreak inside ChatGPT
Not included
Not included
Included
Common questions

Know exactly what you're paying for.

What does the NASDAQ Stock Scanner look for?

Standard and Pro include EdgeBreak's NASDAQ Stock Scanner with Breakout, Pre-Breakout and Base setup filters, plus supported filters for resistance, higher lows, PBI, RVOL, OBV, moving averages, patterns and market-activity context.

What is PBI?

PBI is EdgeBreak's proprietary Pressure Building Index. It summarises aspects of technical pressure, participation and structure into a published research measure. A higher PBI represents stronger measured context under EdgeBreak's methodology, not a breakout probability, expected return or buy signal.

What does off-exchange or accumulation context mean?

EdgeBreak can surface unusual off-exchange participation, persistence and multi-venue activity where published. These footprints may be consistent with accumulation-style participation, but off-exchange data does not identify buy/sell direction or confirm a specific institution.

Which plan should I choose?

Choose Chart Analyzer if you mainly want to analyse charts you find. Choose Standard if you want EdgeBreak to scan the NASDAQ and give you the full website research platform. Choose Pro if you want everything in Standard plus EdgeBreak inside ChatGPT.

Does EdgeBreak tell me what to buy?

No. EdgeBreak provides stock discovery, technical and company research, market information and educational context. It does not provide buy, sell or hold recommendations.

Start your EdgeBreak workflow

Charts. Scanner. Research.
Choose how much you need.

Chart Analyzer $25 • Standard $35 • Pro $50 USD per month. Standard and Pro include the eligible 7-day trial flow.

Research and educational information only. PBI and scanner classifications are research measures, not predictions or recommendations. Market-activity data can provide context but cannot prove who is buying or selling or their intent.