Market structure
Examine visible trends, swings, higher highs, higher lows, lower highs and changes in technical structure.
Upload, paste or drag and drop a stock chart and use EdgeBreak AI to examine visible market structure, support, resistance, consolidation, volume behaviour and breakout structure.
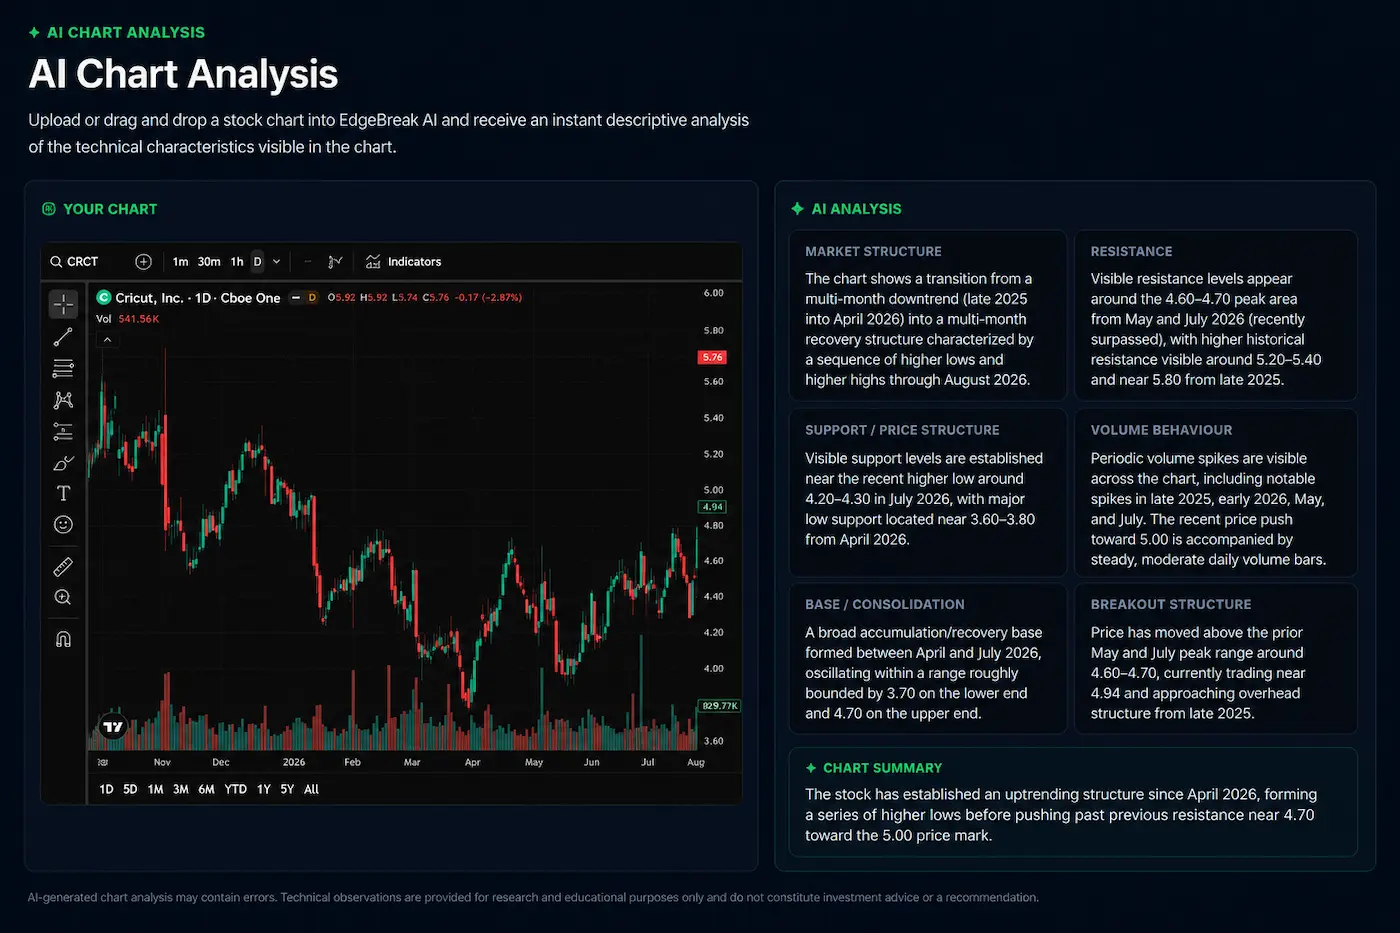
EdgeBreak AI describes what is visible in the chart so you can examine the technical picture in a more structured and consistent way.
Examine visible trends, swings, higher highs, higher lows, lower highs and changes in technical structure.
Identify visible price areas that may be acting as support, resistance or important levels within the current structure.
Examine tightening price action, consolidation, visible volume behaviour and whether a breakout structure is developing.
Chart Analysis is not limited to stocks surfaced by EdgeBreak. Add a stock chart image directly to the analysis panel and begin from the technical picture you want to investigate.
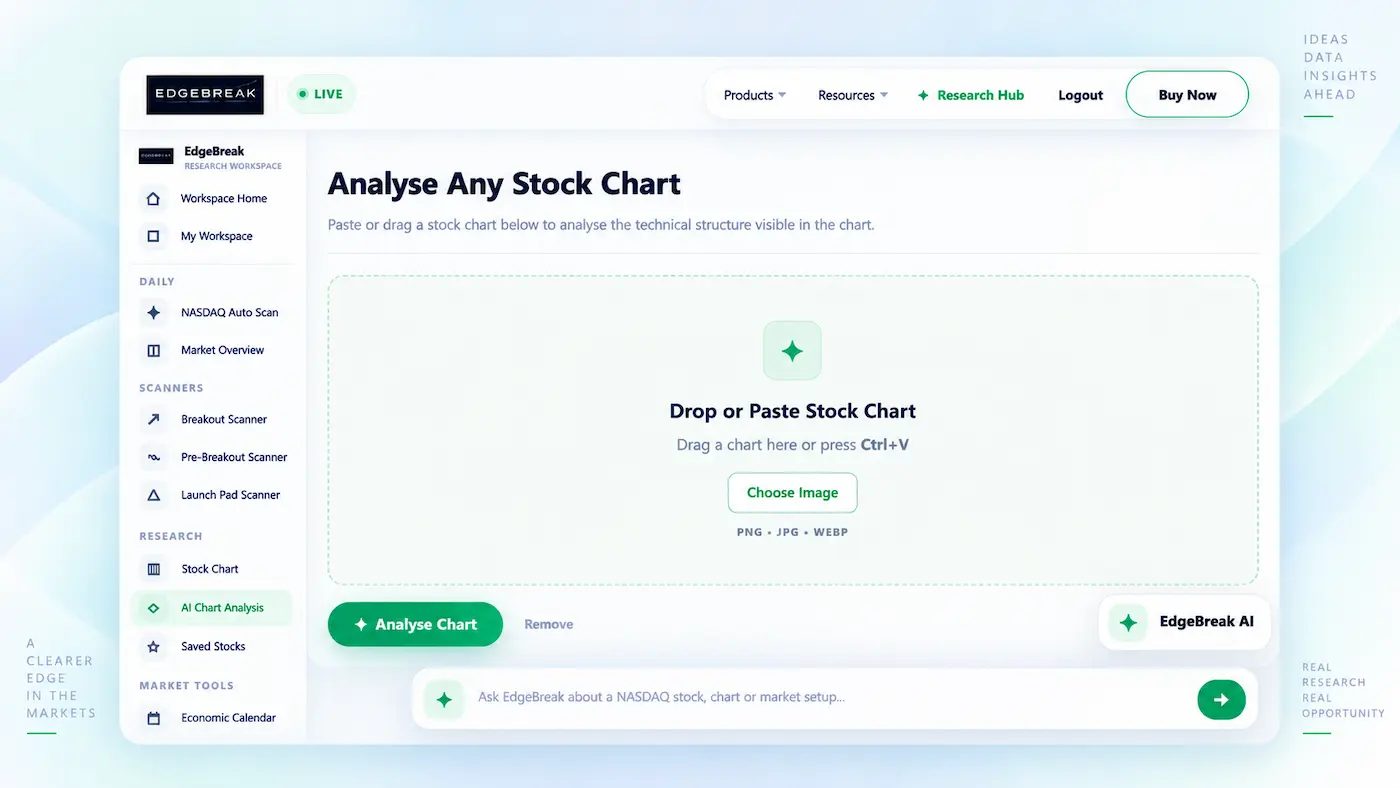
EdgeBreak looks at the visible chart as a whole rather than reducing the analysis to one indicator. The goal is to describe the structure and help you identify areas that deserve further investigation.
Upload, paste or drag and drop the stock chart you want EdgeBreak AI to examine.
AI-assisted analysis examines visible market structure, support, resistance, consolidation, volume behaviour and breakout structure.
Use the analysis to organise what is visible in the chart and decide which areas need closer investigation.
Move into EdgeBreak AI Stock Research, TradingView, scanners or your workspace when you want more context beyond the chart image.
Treat AI output as research assistance and verify important information using reliable data, company disclosures and official sources.
EdgeBreak is a web-based NASDAQ research platform designed for independent investors researching U.S.-listed stocks.
Research NASDAQ-listed stocks with AI-assisted chart analysis, company research and market intelligence in one workflow.
Investigate U.S. NASDAQ stocks from Canada using the same web-based stock research and chart-analysis tools.
Research the U.S. NASDAQ market from Australia with chart analysis, stock discovery and AI-assisted company research.
EdgeBreak AI is designed to help organise and describe visible technical information. It does not know what a stock will do next and should not replace independent judgement.
AI stock chart analysis uses artificial intelligence to describe visible technical features in a stock chart, such as market structure, support, resistance, consolidation, volume behaviour and breakout structure.
Yes. You can upload, paste or drag and drop a chart image into EdgeBreak for descriptive AI-assisted chart analysis.
EdgeBreak can describe visible market structure, support, resistance, consolidation, higher lows, volume behaviour and breakout structure where these features are visible in the supplied chart.
Yes. Chart Analysis is not limited to stocks surfaced by EdgeBreak. You can supply your own stock chart image for analysis.
EdgeBreak is a web-based platform. Investors researching the U.S. market from the United States, Canada, Australia and other supported regions can use the same AI-assisted stock chart analysis workflow.
No. EdgeBreak provides descriptive analysis of the visible chart. It does not provide buy, sell or hold signals, price targets or investment advice.
Yes. AI-generated analysis can contain errors or interpret chart features incorrectly. Always review the original chart and verify important information independently.
Upload your stock chart and use EdgeBreak AI to examine visible technical structure, then continue your research across the wider EdgeBreak platform.