1- and 2-month matching
Compare 21 or 42 completed trading sessions, using the same tool and verified end-of-day data.
Use EdgeBreak's stock chart pattern recognition software to find NASDAQ and NYSE setups that resemble a preset pattern or your own drawn price path. Compare 1-month (21-session) and 2-month (42-session) charts, review up to four genuine matches, and open the charts for further research.
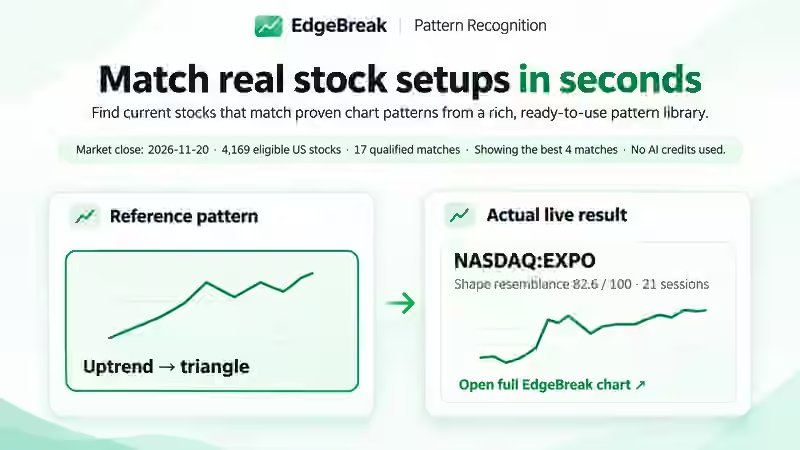
Try an Uptrend Triangle or draw your own chart free at 21 sessions, then try each again at 42 sessions — four genuine searches in total. Choose your timeframe below to get started.
For a free test, choose Uptrend Triangle or Draw a chart. Each is free once for 1 month and once for 2 months. The full pattern library and upload/trace are included with subscriptions.
Trace the price path from left to right across at least half the chart. We sample your line at 21 or 42 points. A traced line cannot reproduce the original OHLC candles.
Select a reference before searching.
Search the latest verified end-of-day NASDAQ and NYSE chart data. Up to four genuine matches.
Ready when you are.
Choose a pattern and run a search to view matching stocks.
Pattern similarity scores rank resemblance, not the probability of a profitable trade. Preset patterns are not AI-analysed. Results are research and educational information, not trading recommendations. Verify the latest chart and dates independently.
Use this reference-based chart pattern scanner to find shapes like the one you're studying across supported NASDAQ and NYSE end-of-day charts. Review up to four ranked matches, or a clear no-match result when nothing qualifies. This is a genuine pattern comparison tool, not an automatic buy signal.
Compare 21 or 42 completed trading sessions, using the same tool and verified end-of-day data.
Choose a pattern preset or draw a price path. Members can also upload a chart screenshot and trace its shape.
Open the ranked NASDAQ and NYSE candidates to investigate the underlying charts, rather than relying on a pattern label.
No signup or card. Test one Uptrend Triangle and one draw-your-own setup in each timeframe.
Try Pattern Recognition freeBoth timeframes, the full preset library, and upload-and-trace. Included with active Chart Analyzer, Swing Trader, Standard and Pro memberships; no separate Pattern Recognition surcharge.
Get full Pattern RecognitionSee current membership pricing and trial eligibility. Pattern Recognition works with verified end-of-day data, not live breakout alerts.
Yes. Four free demo searches are available once per browser: an Uptrend Triangle and a drawn setup for each of the 21- and 42-session timeframes. More patterns and upload-and-trace require membership.
No. Both Pattern Recognition timeframes use zero AI credits for active members. AI Chart Analyzer is a separate tool with separate credit rules.
Members can upload an image and trace its price path as a reference. The traced path approximates shape; it does not reconstruct original OHLC candles or automatically analyse the screenshot. For a written chart assessment, use AI Chart Analyzer.
Yes, it scans supported NASDAQ and NYSE end-of-day charts for price structures similar to a preset or a reference you draw. Unlike a signal scanner, it ranks chart resemblance across 21 or 42 sessions; it does not predict breakouts or issue trade alerts.
Open each returned stock chart and check its latest completed session, support, resistance, volume and stage of the pattern. A shape can look similar even when the stock has already broken support or moved well beyond resistance. Similarity ranks chart resemblance, not the chance of a breakout. See our chart pattern recognition guide for the checks to make before relying on a pattern.
No. Results compare verified end-of-day NASDAQ and NYSE charts by structure. They are research candidates, not real-time alerts, trade recommendations or forecasts.
Start with an available preset, draw your own price path, or use upload-and-trace with an eligible subscription.
Choose a shorter or longer completed-session window. Search supported NASDAQ and NYSE charts for comparable structures.
Review each candidate's latest chart and technical context. Resemblance scores are not breakout probabilities.
Explore Pattern Recognition alongside AI Chart Analyzer, Stock Hub and US market scanning tools.