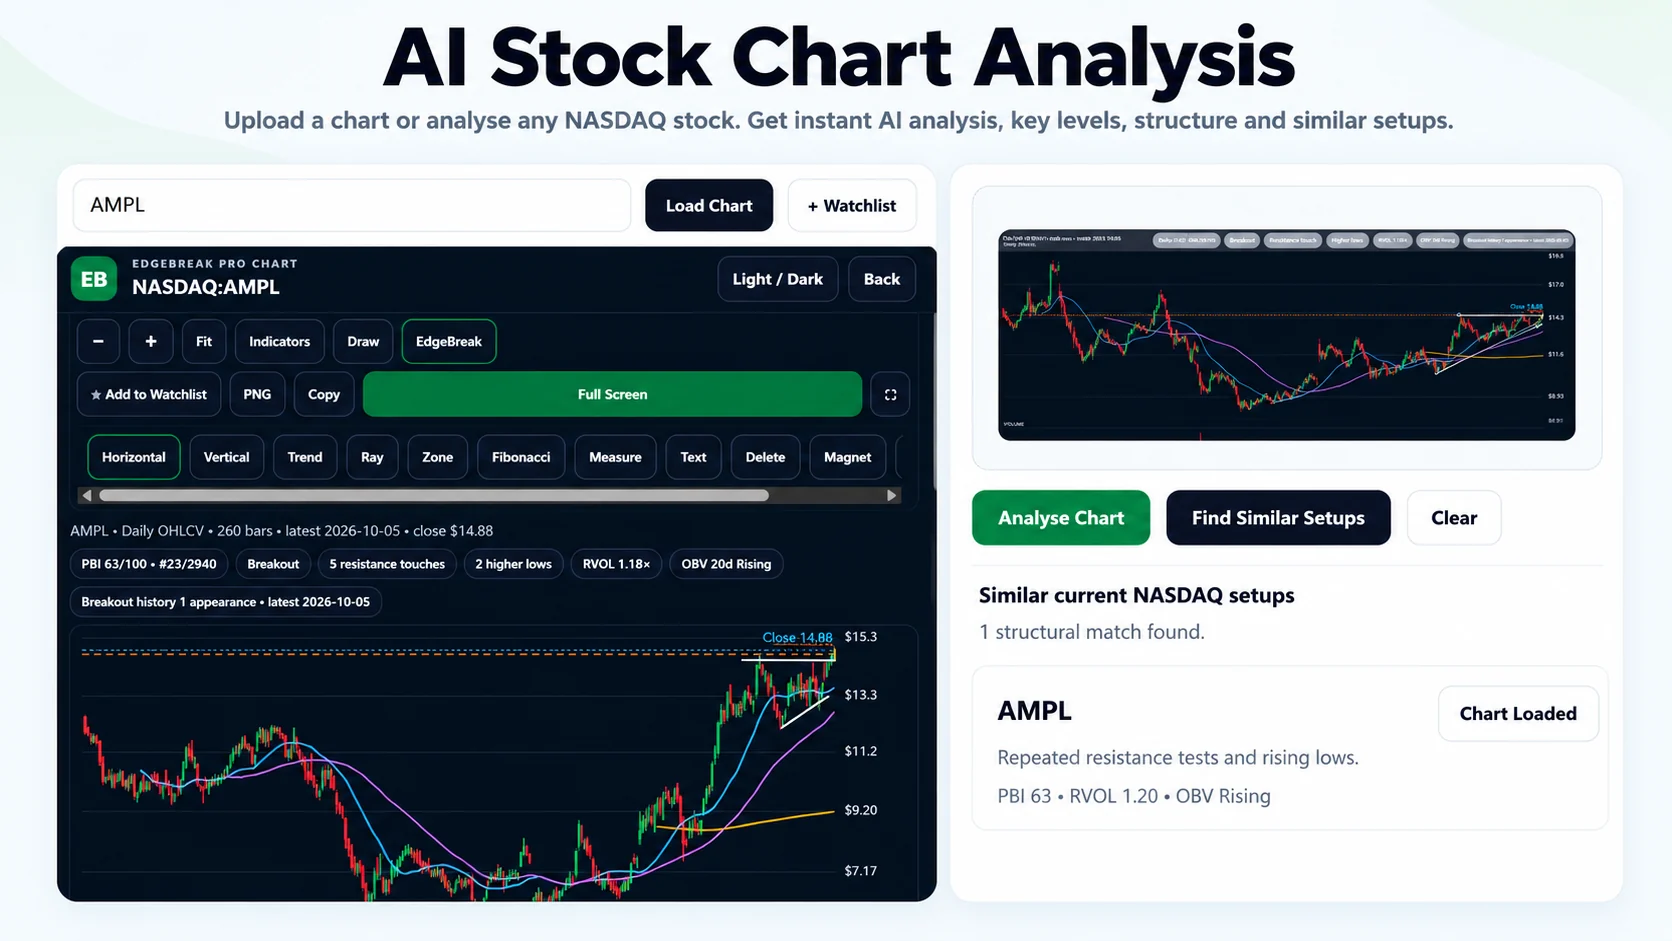
AI chart pattern recognition can describe features in a chart image and help organise searches for comparable market setups. But screenshot analysis, similarity matching and rules-based scanning solve different problems. Here is how to choose the right tool.
What is AI chart pattern recognition?
AI chart pattern recognition applies computational methods to price-chart images or market data to identify or compare price structures. An image-analysis tool may describe visible trend, support, resistance and consolidation. A numerical matcher can instead compare the geometry and stage of a reference setup with other stock charts. A scanner may search for explicit conditions such as proximity to resistance or higher lows.
These tasks should not be confused. Calling every chart-search feature “AI” obscures what users are getting. The strongest research workflow combines clear pattern descriptions, inspectable candidates and up-to-date underlying charts rather than treating a single label as an answer.
Three different tools people call AI pattern recognition
1. AI screenshot analysis
Upload a chart image and ask what the visible price action suggests. The output can describe structure, trend context, support and resistance, but it depends on the quality and contents of the image.
2. Chart-shape matching
Use a reference pattern, drawing or chart to find stocks whose recent paths and structures are comparable. Matching similarity does not estimate future returns.
3. Automated stock screening
Filter a supported stock universe for measurable conditions such as volume, resistance distance or breakout structure. This is distinct from describing an uploaded screenshot.
How EdgeBreak separates these functions
AI Chart Analyzer is intended for a chart screenshot you upload. It provides AI-assisted commentary about the visible technical evidence; it should not be treated as a source of verified live prices or a prediction.
Find Similar Charts uses a user-supplied reference image to look for comparable setups in the supported NASDAQ and NYSE stock-chart universe.
Pattern Recognition is a separate comparison experience offering 21-session and 42-session chart windows, an Uptrend Triangle public reference test and a free draw-your-own reference test for each timeframe. The live page describes member access to additional references and upload-and-trace. The four public searches are one triangle and one drawing at each timeframe, not unlimited searches.
US Stock Scanner helps research stocks by supported scanning filters and published scan data, and Stock Hub provides deeper context for selected tickers. These are complementary tools, not interchangeable labels.
How to use AI chart pattern recognition responsibly
- Define the research question. “What structure is visible in this screenshot?” calls for AI Chart Analyzer. “What other stocks look like this?” calls for a matching tool.
- Pick the chart window. A 21-session base and a 42-session base may be at different structural stages. Do not compare scores across different windows as though they are calibrated probabilities.
- Provide a clear reference. Remove obstructing annotations, retain enough candles and distinguish developing patterns from completed breakouts.
- Review what the system actually returns. A similar-looking chart can be a false positive if price is now far above resistance or the support structure has broken down.
- Check the latest data and context. Review the session date, volume, stock liquidity and broader market conditions rather than acting on a screenshot alone.
- Accept a no-match result. It may be more informative than forcing unrelated stocks into a shortlist.
Illustrative example: searching for a base below resistance
Suppose your reference chart has two clear resistance tests, a sequence of higher lows and a final candle sitting below the upper boundary. An AI description might call it a developing bullish structure. A chart matcher might find stocks with comparable geometry, but a candidate that has already surged well above its former resistance is in a different stage. You should not treat those as equivalent merely because their paths look alike.
This is a hypothetical example, not a verified live result, performance claim or recommendation. Results depend on the data and reference actually supplied.
Important limitations of AI chart recognition
- Images omit context: screenshots can crop out longer trends, corporate actions, volume or session dates.
- AI descriptions can be wrong: text generation may misread price levels or overstate the evidence.
- Similar does not mean predictive: matching structures have no guaranteed common outcome.
- Timeframe matters: a 21-session match and a 42-session match answer different questions.
- Data must be checked: research candidates are only as current and accurate as the market data behind them.
Which EdgeBreak tool should you open?
I have a screenshot
Use AI Chart Analyzer to describe the visible structure, or Find Similar Charts to look for comparable stocks.
I want to draw a setup
Use Pattern Recognition and choose 1 month or 2 months. Public trial modes include a drawn reference at each timeframe.
I want market-wide filters
Use the US Stock Scanner, then inspect candidates in Stock Hub.
Frequently asked questions
Can AI recognise an ascending triangle from a screenshot?
An AI image-analysis tool may describe an ascending-triangle-like structure when the evidence is visible, but the interpretation should be checked against actual resistance touches, higher lows and current price action.
Is EdgeBreak Pattern Recognition the same as AI Chart Analyzer?
No. Pattern Recognition compares 21- or 42-session chart shapes against supported stock data. AI Chart Analyzer focuses on describing an uploaded screenshot.
Can I use Pattern Recognition free?
The public Pattern Recognition page currently describes four test searches: one Uptrend Triangle and one drawn reference for each of its two timeframes. Membership terms and features are shown on the live page.
Can an AI match predict a breakout?
No. A chart comparison can identify resemblance and organise research but cannot establish whether or when a stock will break out.
Explore the pattern on EdgeBreak
Compare a 21-session or 42-session chart reference, then inspect the actual candidate charts and research context. Match quality is not a prediction or trading recommendation.
Open Pattern Recognition →View membership plansFor educational and general research purposes only; not financial advice. Price data, AI observations and matches may be incomplete or inaccurate. Trading involves risk, including loss of capital.