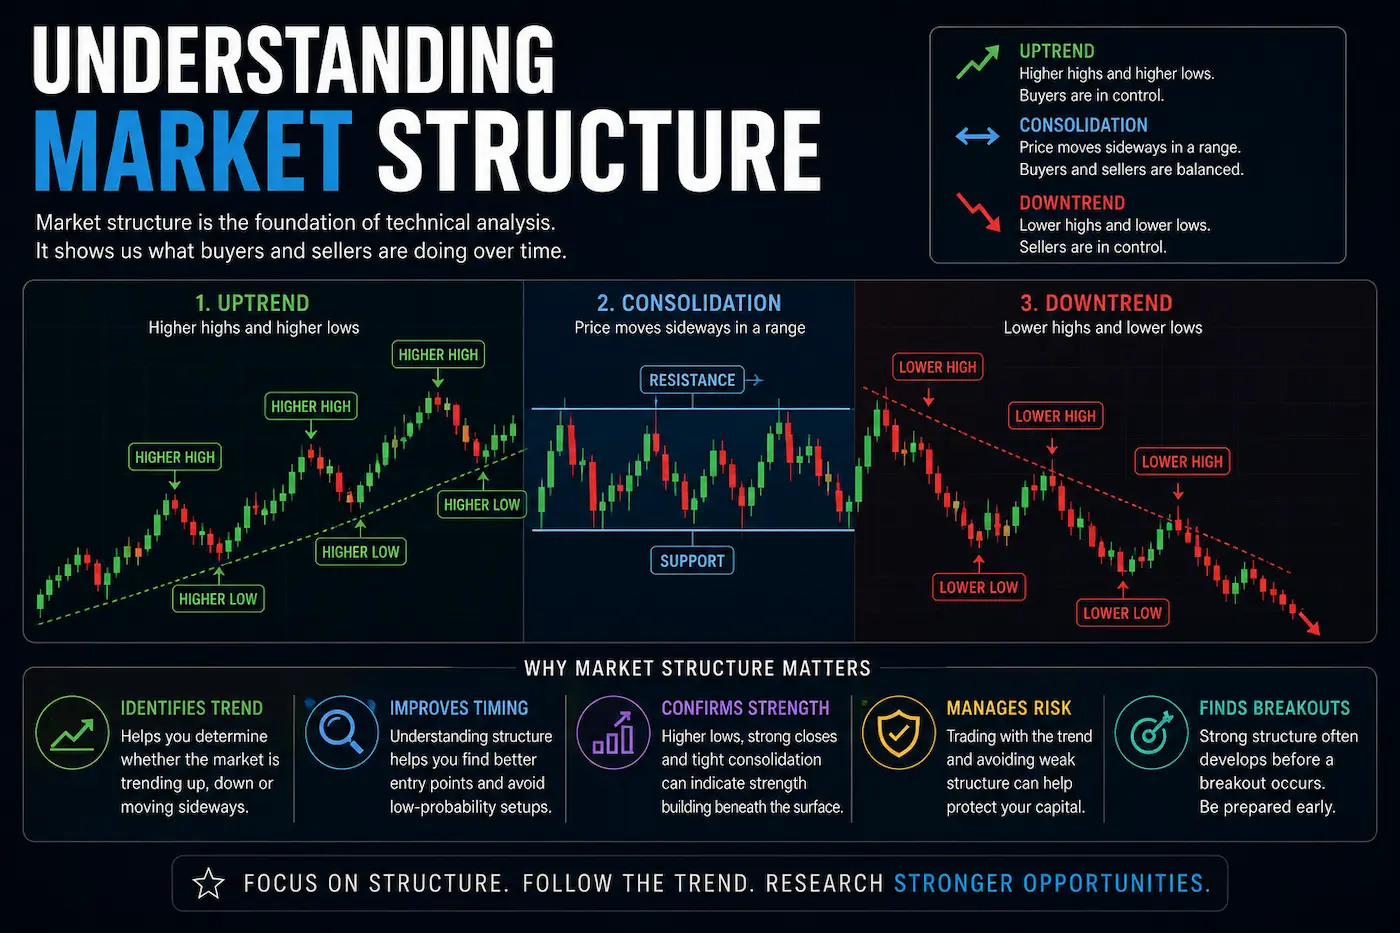
Higher highs and higher lows
An uptrend is commonly described by a sequence of higher highs and higher lows. Each new rally reaches above the previous high, while pullbacks remain above the previous low.
This does not prove who is buying or guarantee that the trend will continue. It simply describes an improving price structure.
Lower highs and lower lows
A downtrend develops when rallies fail below previous highs and declines move through previous lows. The sequence shows that the market is producing progressively weaker price levels.
Breakout research becomes more difficult when the broader structure remains weak because the stock may still be fighting an established downward trend.
Consolidation can be constructive
Markets rarely move in a straight line. Stocks often spend time trading sideways after an advance or decline.
When consolidation becomes orderly, with clearly defined support and resistance and reduced volatility, it can create a useful base for further research.
Support and resistance create reference points
Support and resistance help define the boundaries of a structure. Repeated reactions around similar areas can make those zones useful when monitoring how price is changing over time.
The important point is that these are areas of repeated market behaviour rather than perfectly exact prices.
Structure should be combined with other evidence
Market structure is only one layer of research. Volume, broader market conditions, recent company developments, financial information and unusual market activity can all add context.
None of those layers should be treated as certainty. EdgeBreak uses them together to help narrow the market and identify which stocks deserve deeper investigation.