Trading Insights
Accumulation
vs Distribution.
Learn how price structure, support, resistance and volume can help you distinguish between accumulation-like and distribution-like behaviour without assuming who is buying or selling.
Market Structure
June 2026
7 min read
What is accumulation?
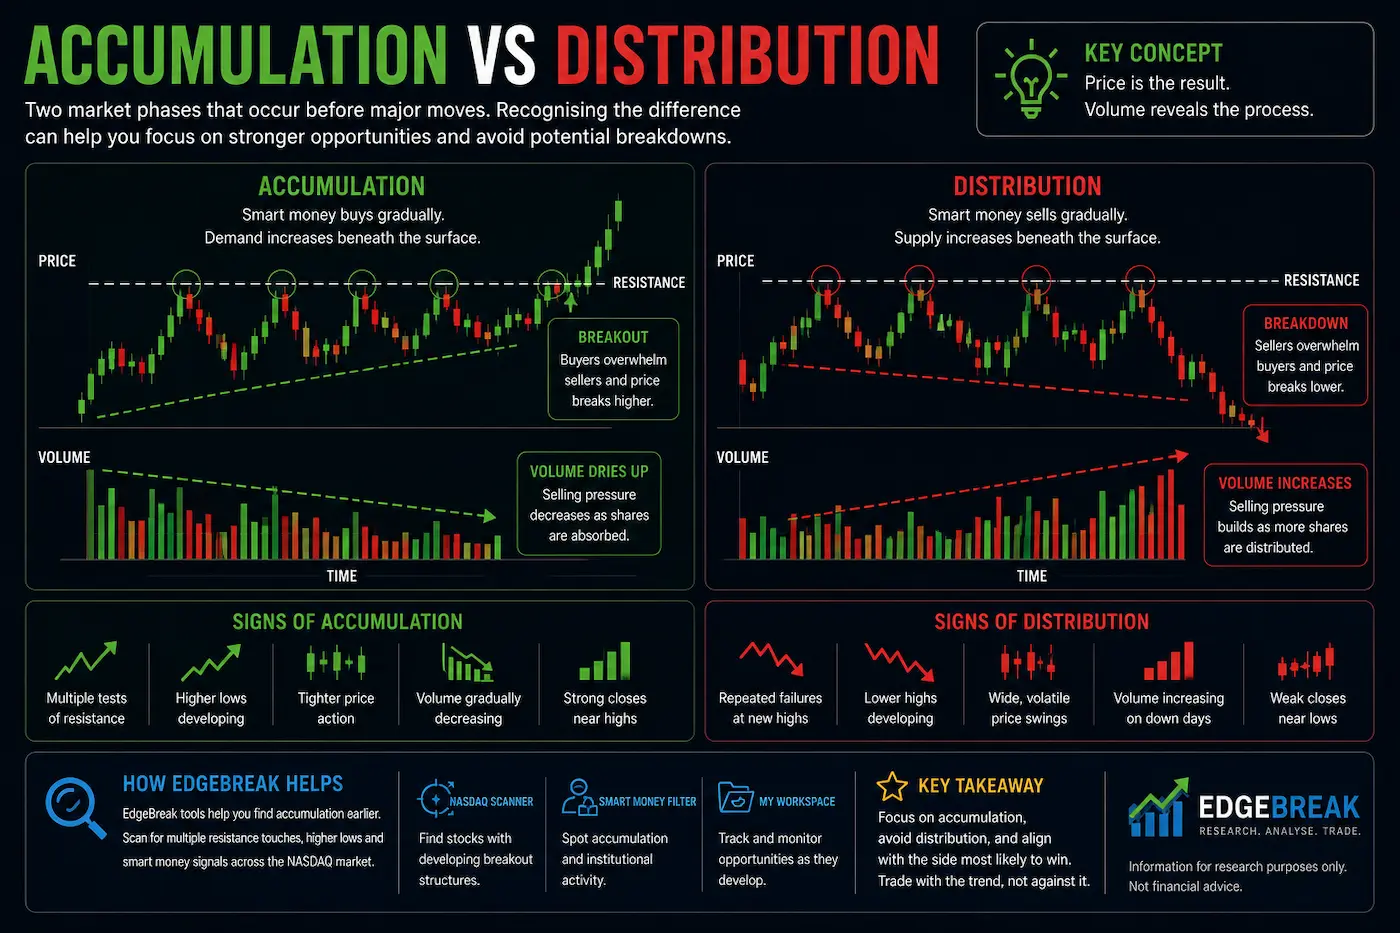
Accumulation is a term traders use to describe a period where demand appears to be gradually absorbing available supply. On a chart, price may move sideways or progress only slowly while support begins to hold at similar or progressively higher levels.
The important distinction is that a chart cannot confirm who is buying. Higher lows, repeated resistance tests, tighter price action and constructive closes can suggest improving demand, but they do not prove institutional accumulation or guarantee that price will break higher.
What is distribution?
Distribution describes the opposite type of behaviour: supply appears to be becoming more influential while price struggles to continue higher. A stock may remain inside a trading range for some time, but repeated failures near resistance, lower highs or weaker closes can suggest that the structure is deteriorating.
Again, the chart shows price behaviour rather than participant identity. Distribution-like characteristics may indicate increasing selling pressure, but they do not reveal exactly who is selling or what their intent may be.
Why the distinction matters
Accumulation-like and distribution-like behaviour provide context for the quality of a technical setup. A stock pressing against resistance while higher lows and tighter ranges are developing is structurally different from a stock repeatedly failing at resistance while lower highs and volatile declines appear.
That distinction can help narrow research. It does not turn either structure into a prediction. A constructive base can still fail, and a weak structure can still reverse.
Combine structure with other evidence
Market structure is more useful when it is considered alongside other evidence. Support and resistance, volume behaviour, the broader trend, recent company developments and the stock's position within its base can all add context.
EdgeBreak also examines unusual market activity as a separate research layer. This information can help identify behaviour worth investigating, but it is not treated as confirmation that institutions are buying or selling.
Look at the whole base
Individual candles can be noisy. The more useful question is often whether the overall structure is becoming more organised or less organised over several weeks.
Are lows rising? Is resistance being tested repeatedly? Is price tightening? Are weak closes becoming less common? Or are lower highs, volatility and failures near support beginning to dominate?
Looking at the whole base helps keep research focused on observable behaviour instead of creating a narrative from one session.
Final thoughts
Accumulation and distribution are useful concepts because they encourage traders to look beyond a single candle and study how a structure is developing over time.
The strongest use of these concepts is descriptive rather than predictive. Higher lows, resistance tests, tightening ranges, lower highs and changing volume can all help explain whether a structure appears to be strengthening or weakening.
By separating observable evidence from assumptions about who is behind the activity, investors can build a more consistent and transparent research process.