NASDAQ Stock Discovery
How a NASDAQ Stock
Scanner Works.
Learn how a NASDAQ stock scanner can reduce thousands of listed stocks into a smaller group of breakout, pre-breakout and base-building structures worth investigating further.
Stock Discovery
September 2026
8 min read
What is a NASDAQ stock scanner?
A NASDAQ stock scanner is a research tool that filters NASDAQ-listed stocks using defined criteria. Instead of reviewing thousands of charts one by one, a scanner narrows the market into a smaller list of stocks that match a particular technical or market structure.
The scanner does not decide which stock is “best” and it cannot predict what will happen next. Its job is discovery: identify relevant candidates quickly, then leave the investor to investigate the structure, company, market context and risks in more detail.
Why use a scanner instead of searching manually?
The NASDAQ contains thousands of listed securities. Manually reviewing every chart each day is impractical, especially when the research question is specific — for example, which stocks are testing resistance, building higher lows, consolidating tightly or attempting a breakout.
A rules-based stock scanner applies the same criteria across the market consistently. That does not remove judgement, but it can reduce the amount of time spent searching and make the first stage of research more repeatable.
What is a NASDAQ breakout scanner?
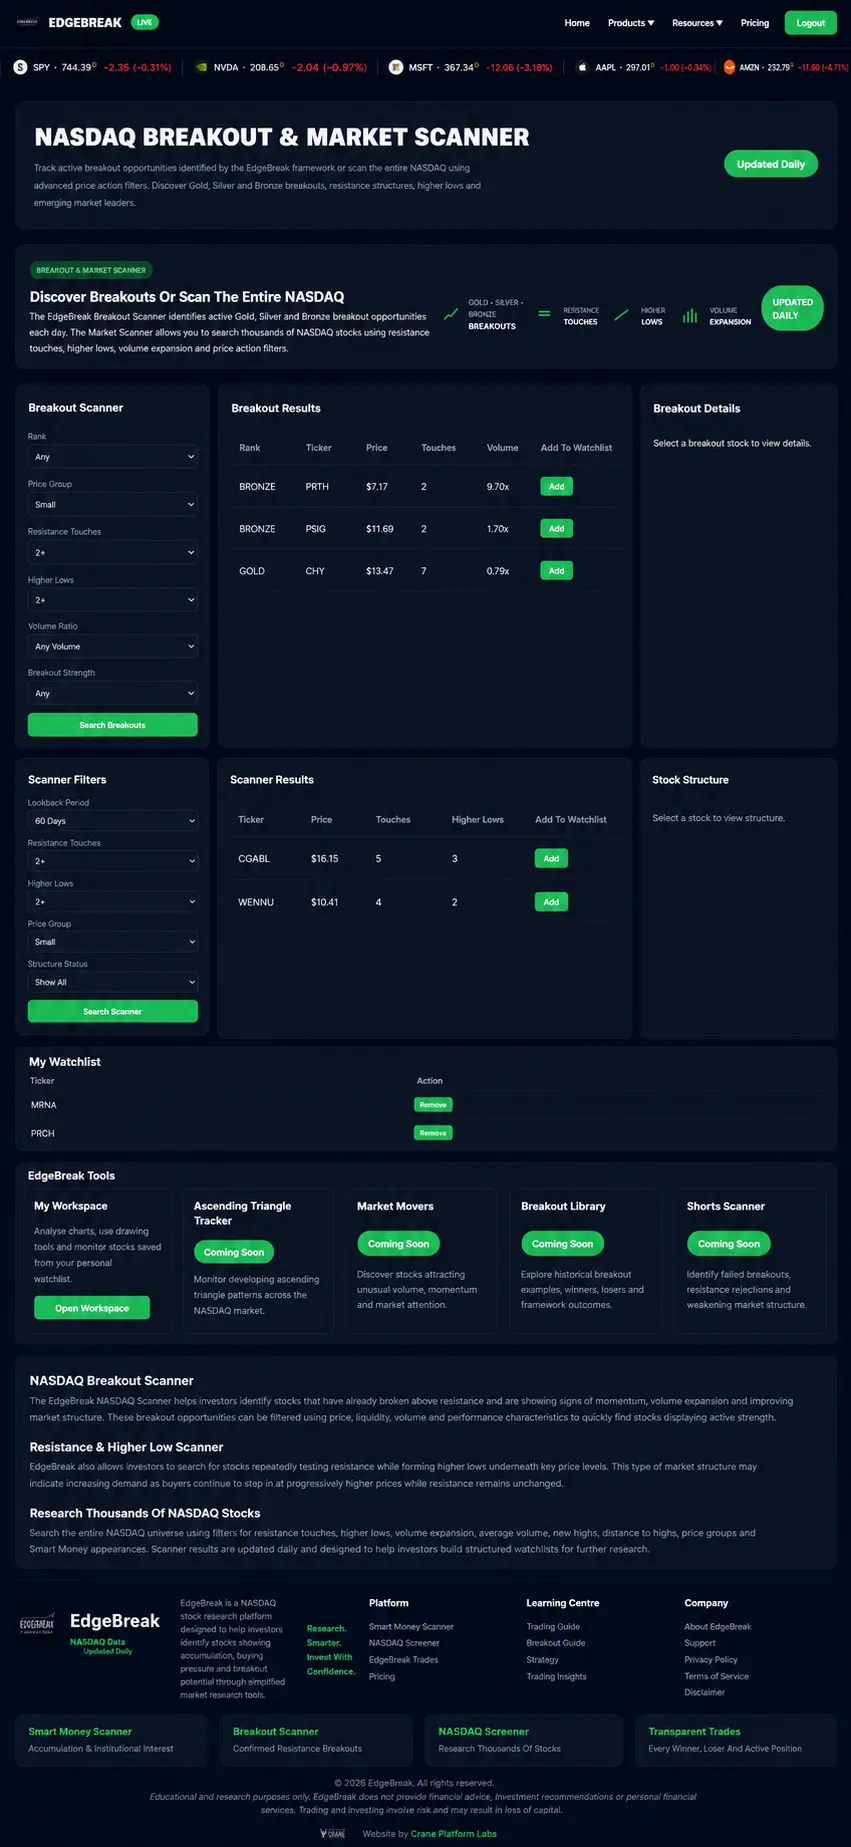
A NASDAQ breakout scanner focuses on stocks interacting with resistance. Rather than simply finding stocks that are rising, it can look for technical evidence such as repeated resistance tests, improving support, higher lows, consolidation and the behaviour of price around the breakout level.
The important distinction is that a breakout scanner finds a technical event or structure. It does not prove that a breakout will succeed. Some moves hold above resistance, while others return to the previous range.
What is a pre-breakout stock scanner?
A pre-breakout scanner looks earlier in the process. It searches for stocks that have not yet clearly broken resistance but are beginning to develop characteristics that may make the structure worth monitoring.
This can include repeated interaction with a similar resistance zone, consecutive higher lows, controlled pullbacks and tighter price action. The purpose is not to predict an imminent breakout; it is to find the build-up while the original structure is still visible.
What should you look for in a NASDAQ stock scanner?
Different scanners are designed for different research styles. A useful scanner should make its criteria understandable enough that users know why a stock appeared instead of treating the result as a black-box recommendation.
- Clear market universe: know which exchange or group of securities is actually being scanned.
- Defined technical criteria: understand whether results are based on resistance, trend, volume, volatility, price structure or another measurable condition.
- Useful timing: distinguish between stocks that have already broken out and structures still developing beforehand.
- Enough chart context: a result should be easy to investigate rather than treated as a standalone signal.
- Research workflow: the scanner should make it simple to continue into company, news, filing and market analysis.
Can a NASDAQ stock scanner predict which stock will break out?
No. A scanner can identify stocks that match a defined set of conditions, but it cannot know whether buyers will continue to support the move, whether new information will change the market or whether a technically strong setup will fail.
That is why EdgeBreak treats scanning as a discovery process. The value comes from narrowing the market and making the next stage of research more focused — not from presenting scanner results as predictions.