Repeated resistance
Focus on stocks interacting with an established resistance area rather than isolated price spikes.
EdgeBreak scans the NASDAQ for developing pre-breakout structures near resistance, helping you find higher lows, tightening price action and stocks that may be preparing for a potential breakout.
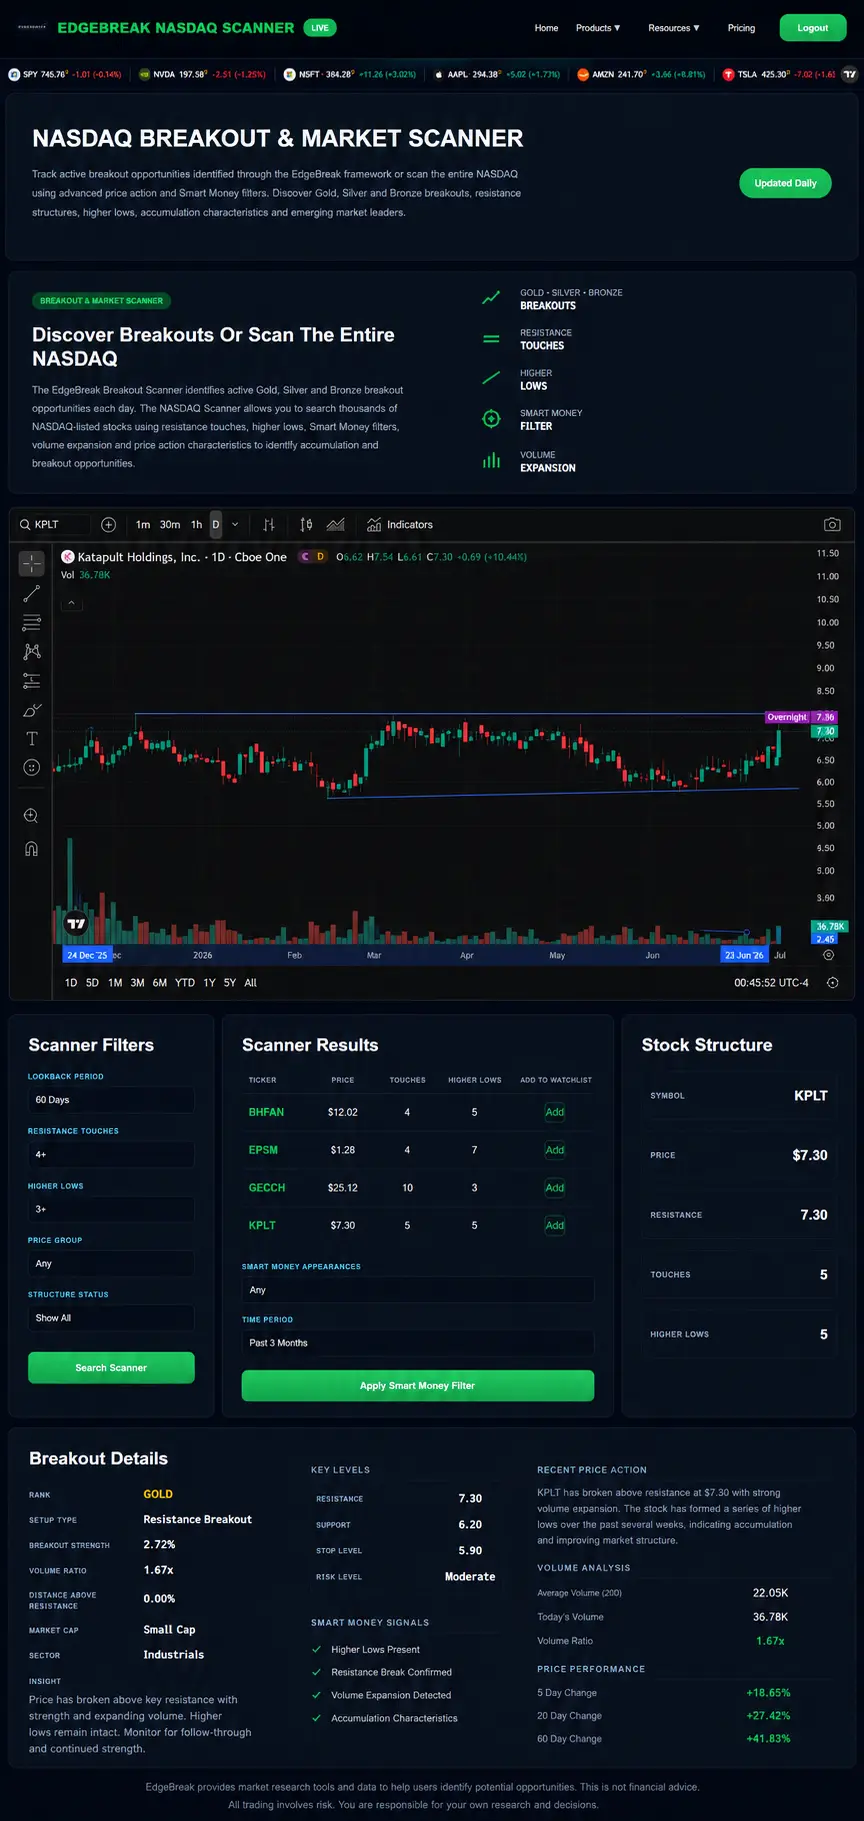
The EdgeBreak Pre-Breakout Scanner is built for investors who want to research developing structures before price has clearly broken through resistance.
Focus on stocks interacting with an established resistance area rather than isolated price spikes.
Look for developing support structure where successive lows are holding higher as price approaches resistance.
Surface stocks where consolidation and price behaviour are compressing near resistance before confirmation.
The Pre-Breakout Scanner narrows the NASDAQ to developing setups that are still below or near resistance, giving you a focused list to investigate before a confirmed breakout appears.

Pre-Breakout is designed for developing structures still sitting below or around resistance. Breakout Scanner takes over once price has moved through established resistance and the breakout is confirmed.
Start with a rules-based scan across NASDAQ-listed stocks rather than manually checking thousands of charts.
Surface developing structures where price is testing or approaching a meaningful resistance area.
Examine whether support is improving, lows are holding higher and price structure is tightening.
Move into charts, AI Stock Research or the wider scanner workspace when a setup deserves closer investigation.
A pre-breakout structure is not a confirmed breakout. Continue monitoring resistance and independently verify the setup.
EdgeBreak is web-based and focused on NASDAQ-listed stocks, making the same pre-breakout research workflow available to independent investors in the U.S., Canada and Australia.
Find NASDAQ stocks approaching resistance and investigate developing pre-breakout technical structures.
Research U.S. NASDAQ stocks from Canada using the same browser-based pre-breakout scanner and workflow.
Research NASDAQ pre-breakout structures from Australia with the same rules-based scanner.
EdgeBreak helps identify NASDAQ stocks matching defined pre-breakout conditions. It does not predict whether resistance will break or whether a future move will continue.
A pre-breakout stock scanner looks for stocks developing technical structure near resistance before a confirmed breakout occurs. EdgeBreak focuses on NASDAQ stocks with resistance, higher lows and tightening price action that may deserve further research.
EdgeBreak looks for developing structures near resistance, including repeated resistance interaction, higher lows, consolidation and tightening price behaviour.
Yes. Pre-Breakout focuses on stocks still developing below or near resistance. Breakout Scanner focuses on stocks that have already moved through established resistance.
Yes. EdgeBreak is web-based and focused on NASDAQ-listed stocks. Investors researching the U.S. market from the United States, Canada, Australia and other supported regions can use the same pre-breakout scanner.
That is one of its core purposes. The scanner is designed to surface NASDAQ stocks with developing technical structure around established resistance so they can be investigated before confirmation.
No. It identifies stocks matching defined technical conditions before a breakout. The setup may fail, remain in consolidation or never break resistance.
Scan the NASDAQ for developing pre-breakout structures near resistance, then continue your investigation across the wider EdgeBreak research platform.