01
SearchChoose the setup.
Search the NASDAQ for Breakouts, Pre-Breakouts, technical bases, stocks near resistance and other available setup conditions.
Scan the NASDAQ for developing technical structures, upload any stock chart — even without a ticker — to find current setups like it, and investigate candidates using EdgeBreak's proprietary PBI, volume-flow and participation intelligence.
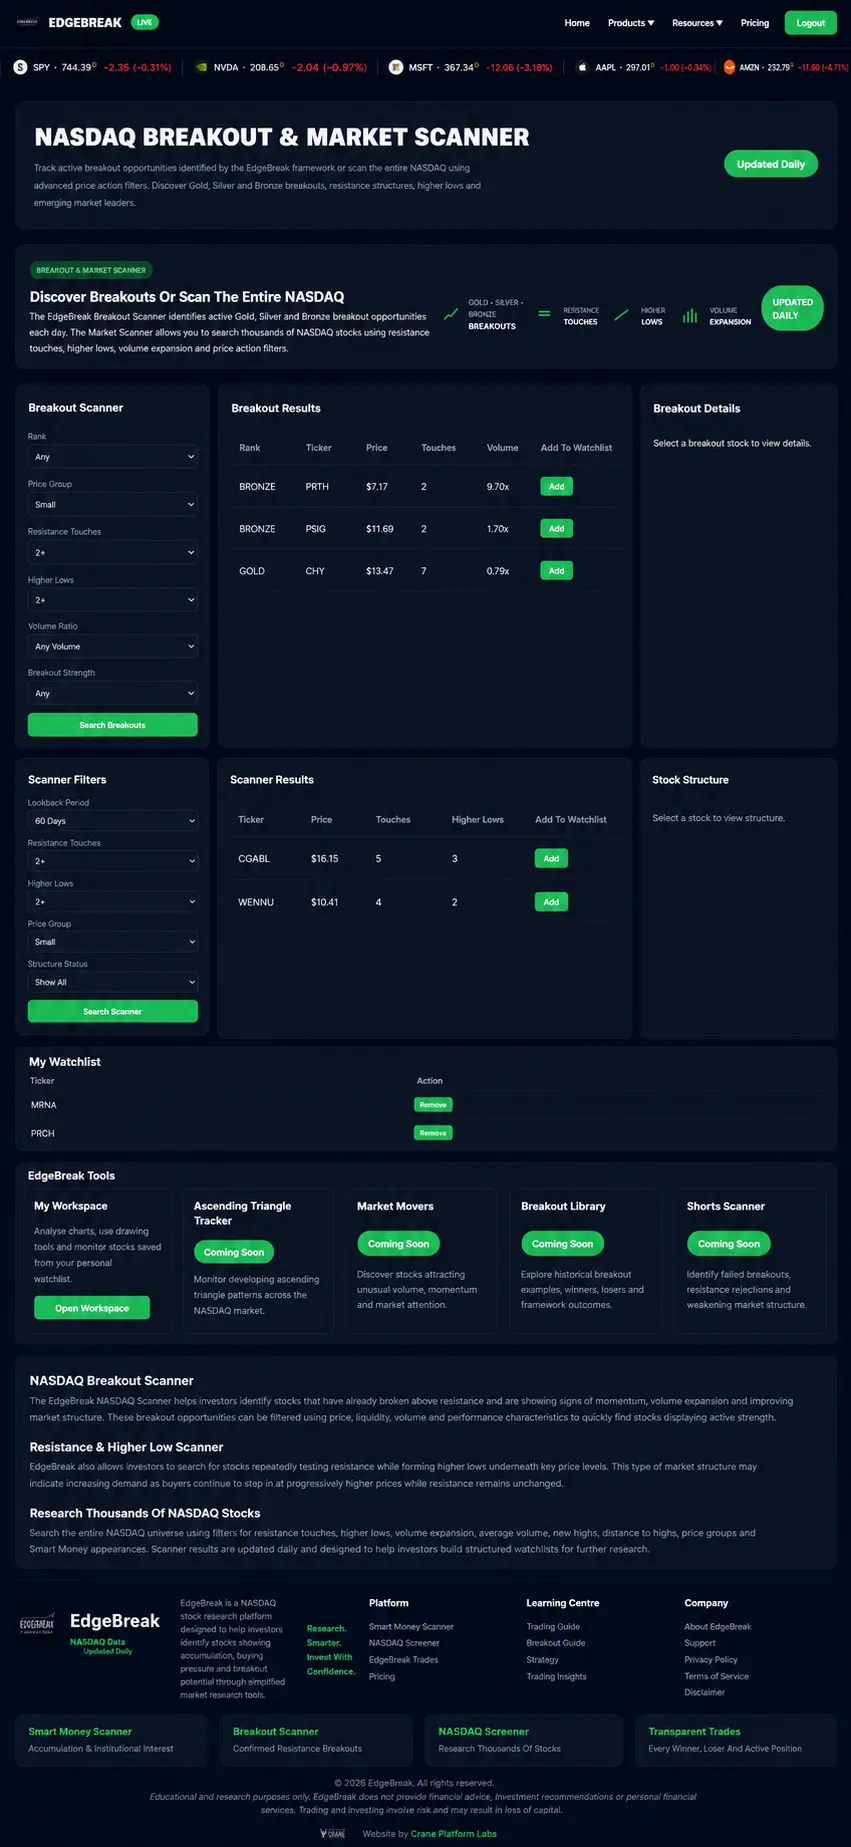
EdgeBreak keeps NASDAQ discovery, chart analysis, participation intelligence and company research connected, helping traders move between opportunities, save their work and return as new market data becomes available.
Final Connected Workflow graphic to be supplied after website wording is approved.
Breakout, Pre-Breakout and base research still matter. They now sit inside a broader Master Scanner workflow so you can search the market without jumping between separate scanner products.
Search the NASDAQ for Breakouts, Pre-Breakouts, technical bases, stocks near resistance and other available setup conditions.
Refine results using available fields such as PBI, higher lows, resistance, support, OBV, relative volume, moving-average relationships and structure.
Create searches around the setups you actually want to find and save them so you can return without rebuilding the same filters.
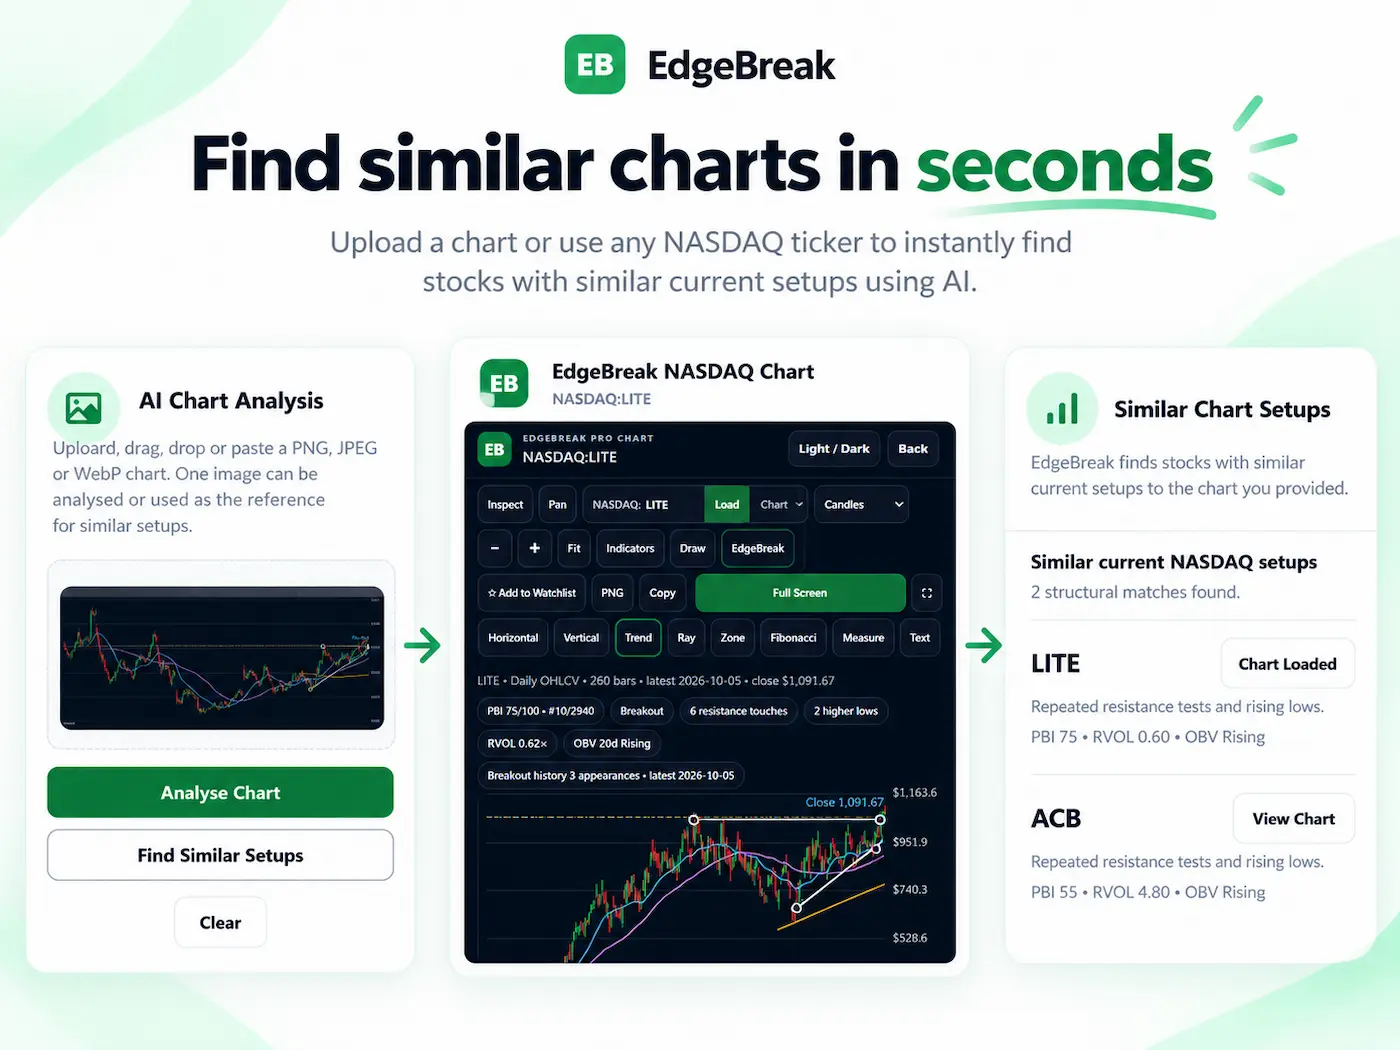
Open the EdgeBreak chart, or upload another chart to AI Chart Analyzer and search the current NASDAQ universe for similar technical structures.
Continue into AI Stock Research for company information, financial highlights, recent news, filings and additional research context where available.
Use the EdgeBreak AI chat bar to describe a scanner search in normal language or ask questions about technical analysis, market structure and trading research.
Swipe through the main EdgeBreak tools. Each one continues the same research workflow rather than sending you into a separate product.
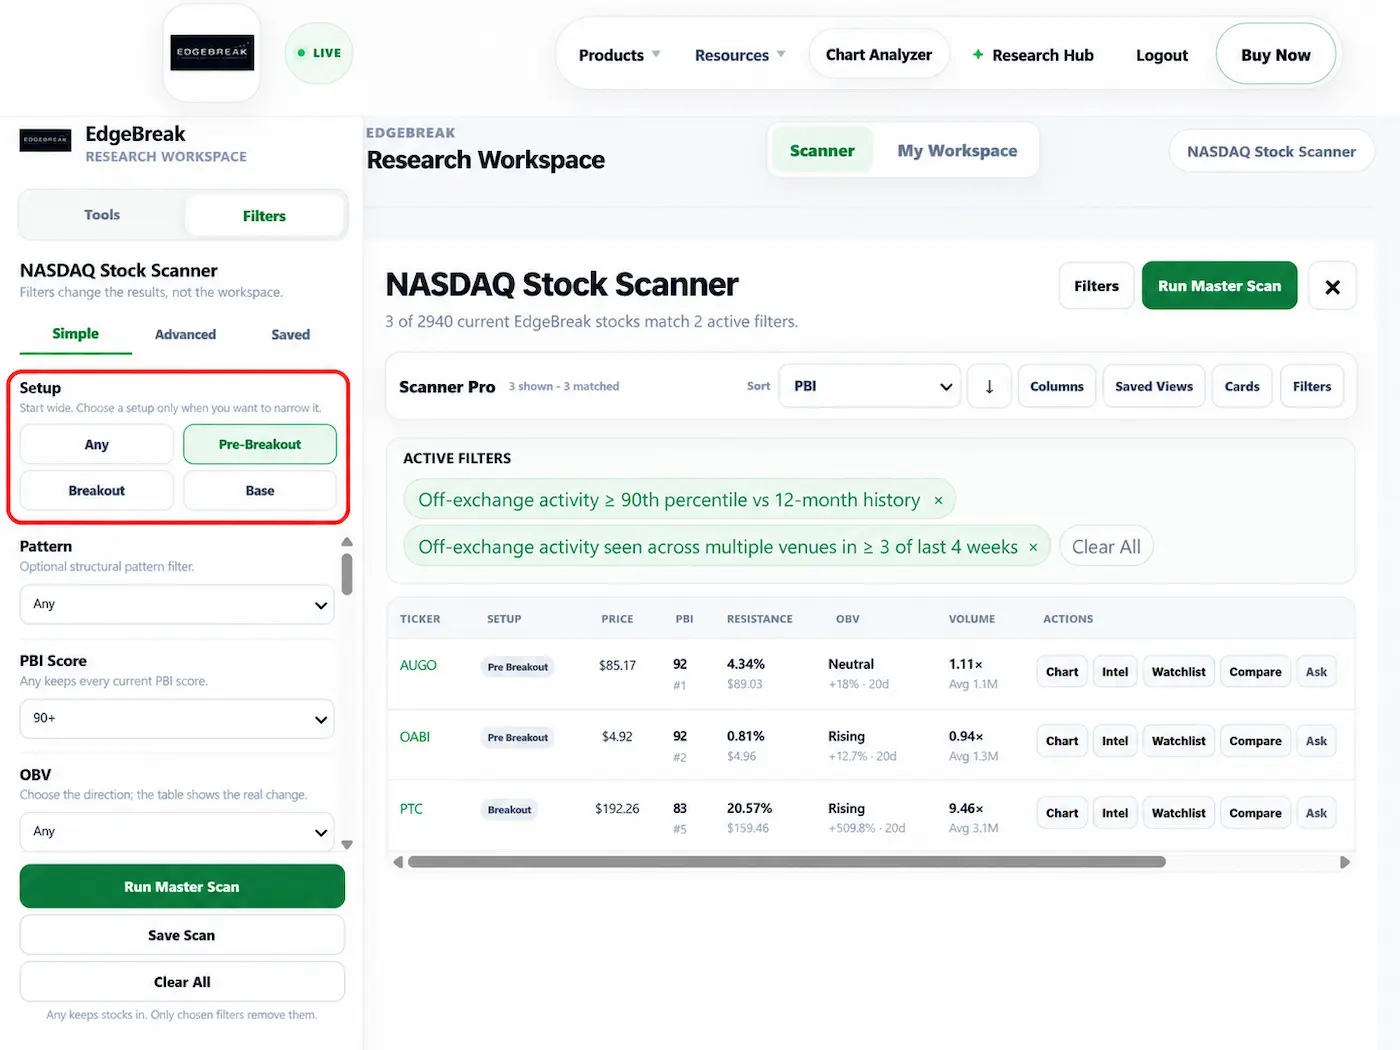
Use one Master Scanner to search the current NASDAQ universe. Filter by PBI, higher lows, resistance, support, OBV, RVOL, moving averages and other available technical fields, then create and save your own searches.
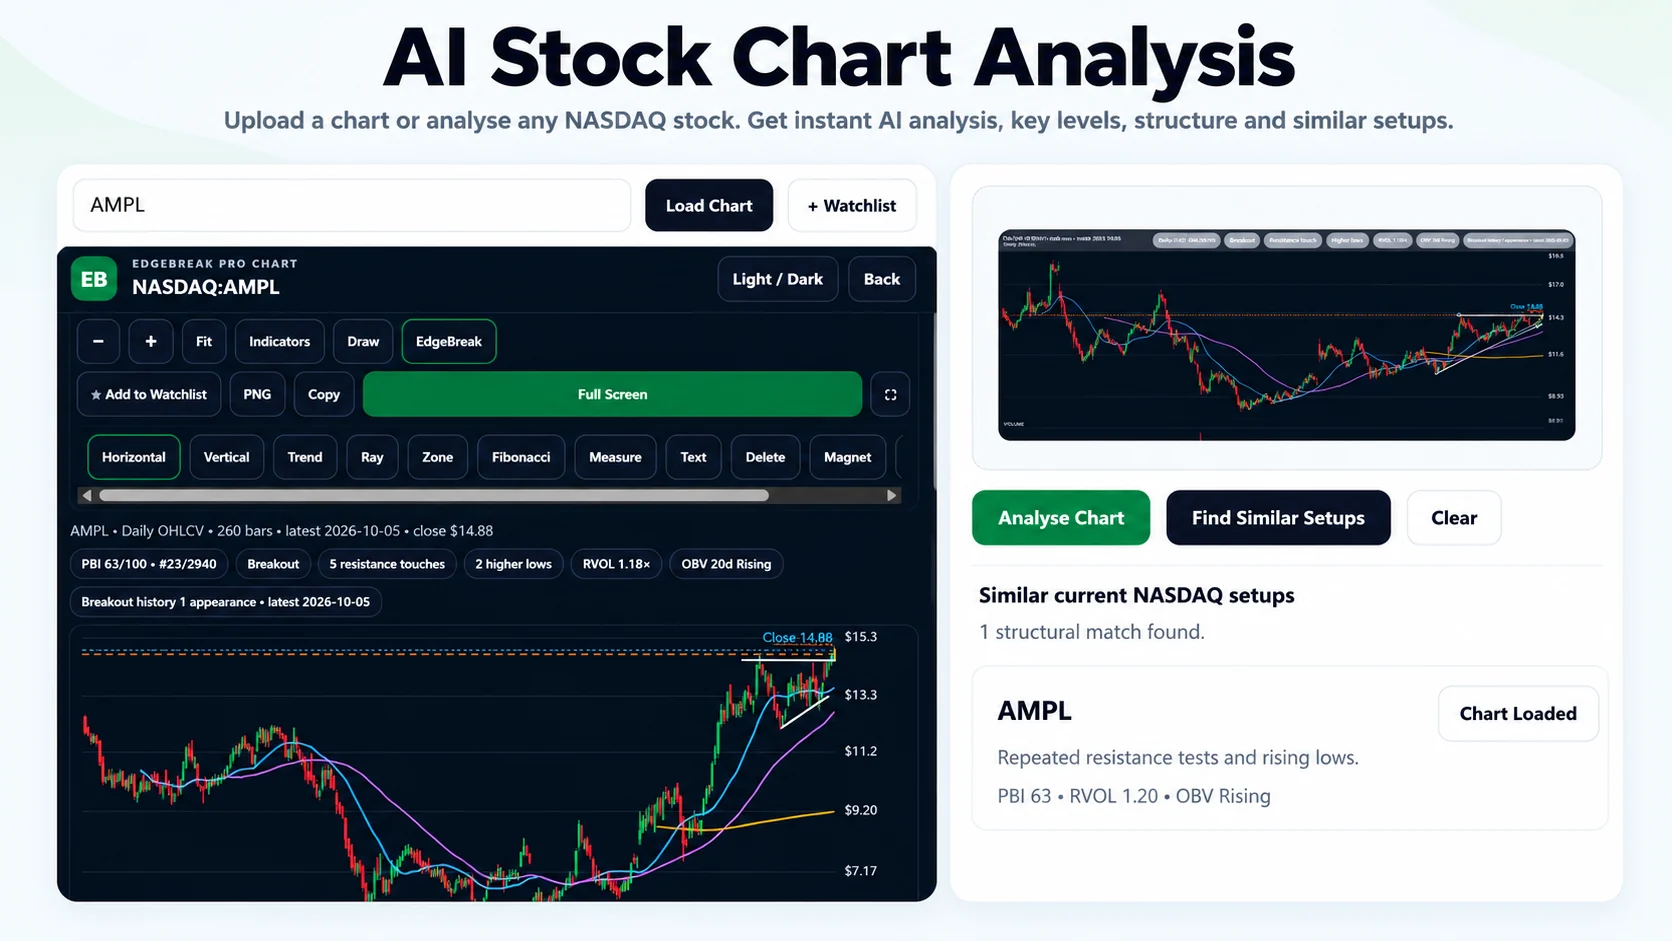
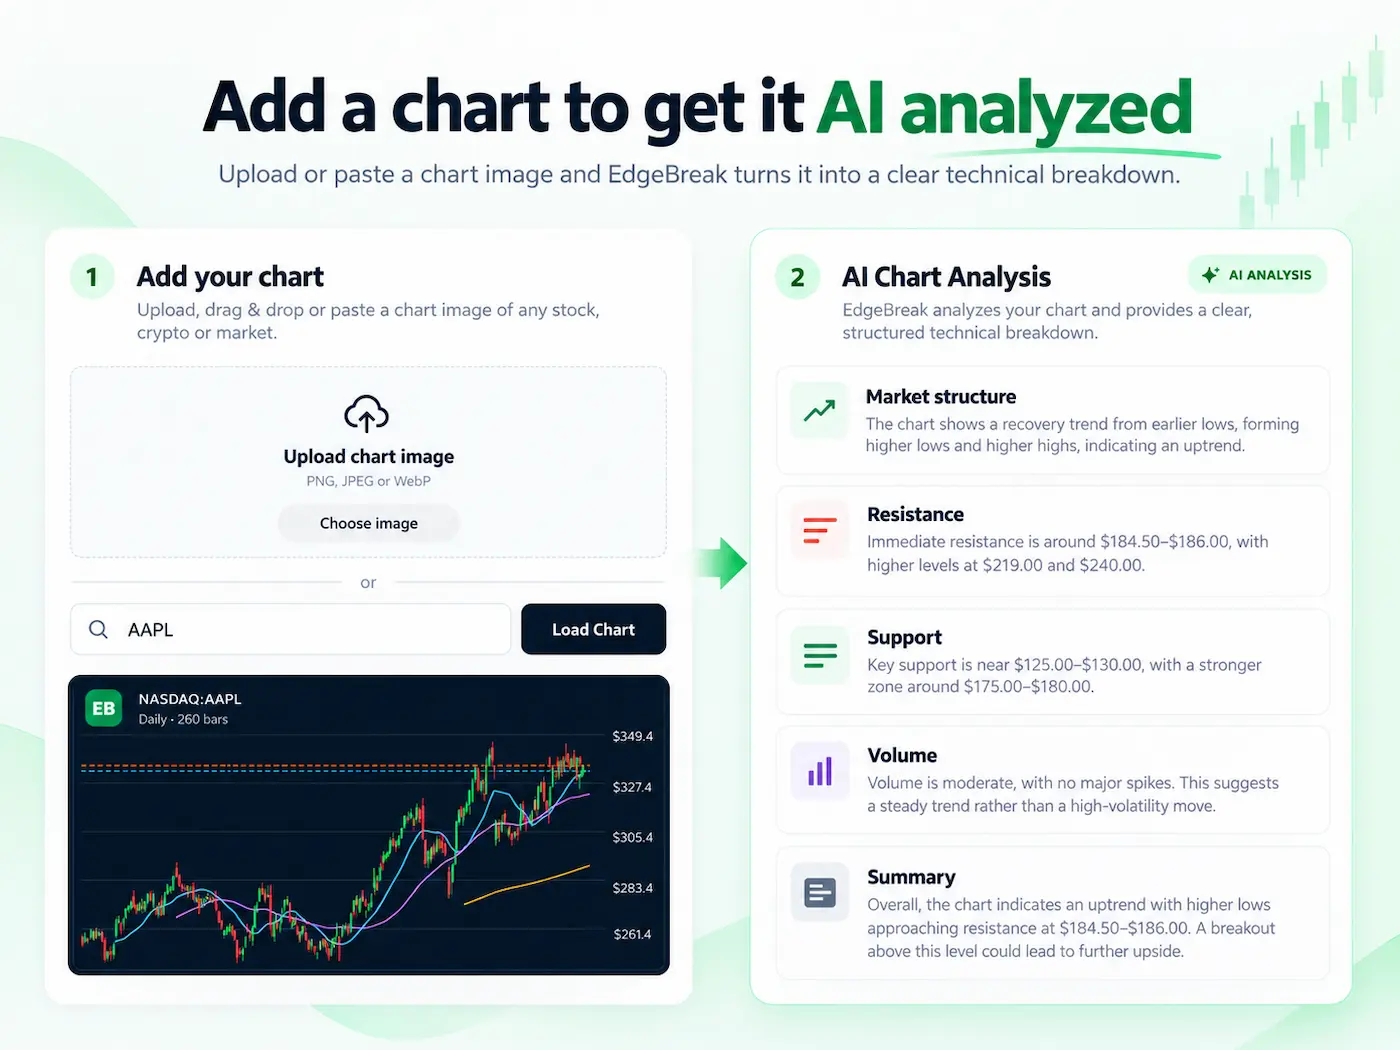
Upload, paste or drag in a stock chart. EdgeBreak AI can organise the visible technical structure or use it as the reference for a search across current NASDAQ charts with similar structure.
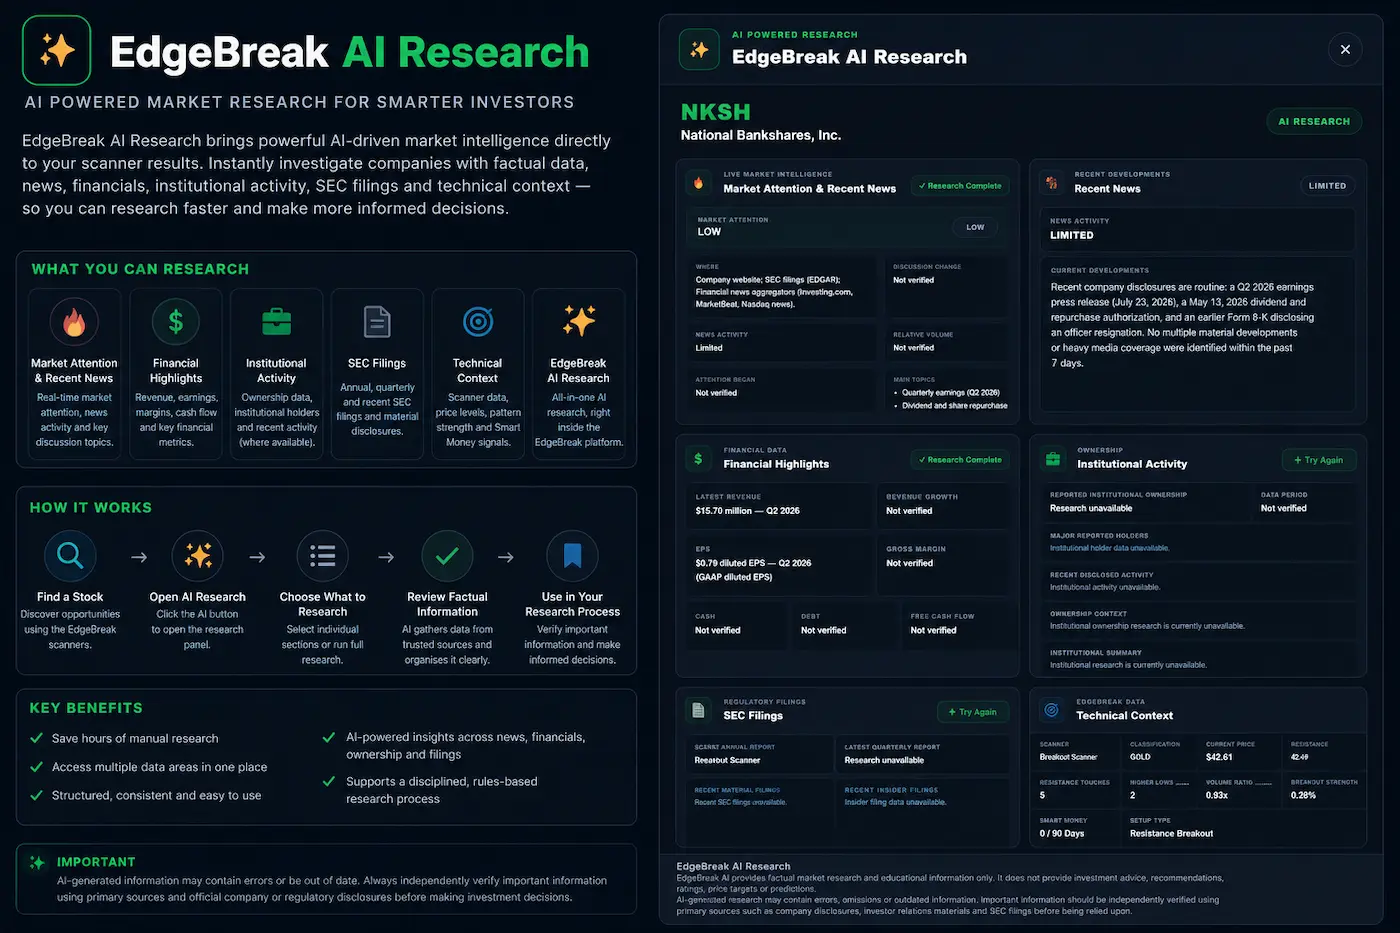
Continue into company research with available company information, financial highlights, recent news, SEC filings and other research context without losing the stock you are investigating.
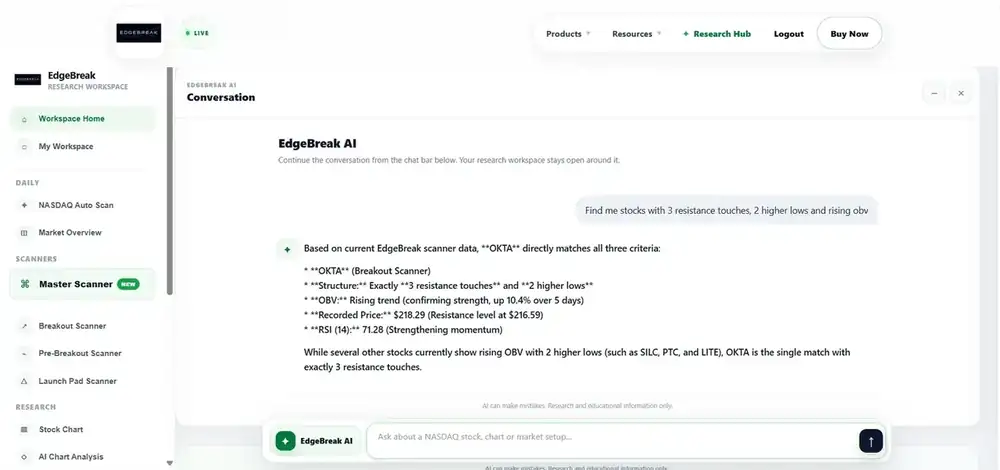
Use the AI chat bar in normal language: describe the setup you want EdgeBreak to find, refine the current results conversationally, or ask general questions about technical analysis, market structure, indicators and trading research.
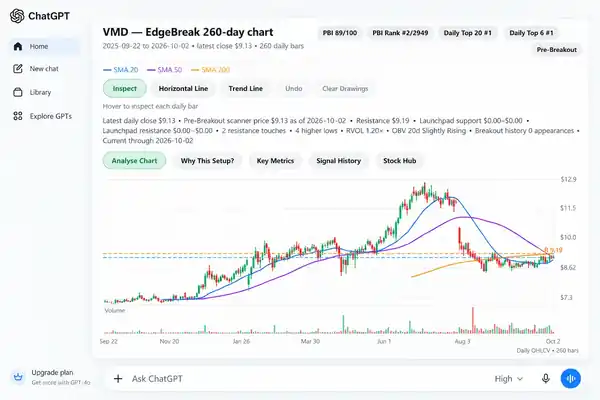
The EdgeBreak ChatGPT app integration is designed to let you search scanner results, narrow setups, inspect EdgeBreak charts and continue stock research naturally inside ChatGPT. Pro includes ChatGPT access when the integration is publicly available.
The scanner is no longer a choice between separate destinations. Start with the NASDAQ universe and search for the technical conditions that matter to your research.
Use AI to organise the visible structure in a chart, or use that chart as the reference for a current NASDAQ similarity search. The result stays connected to EdgeBreak charts and the wider research workflow.
Two charts can look almost identical, yet the evidence behind them can be different. PBI — EdgeBreak's Pressure Building Index — helps you compare that evidence using a published research score built from proprietary analysis of technical pressure, participation and structure.
A higher PBI reflects stronger measured context under EdgeBreak's methodology. Use it to prioritise setups for closer research alongside price structure, volume and participation signals.
PBI is research context, not a breakout probability, prediction or buy/sell recommendation.
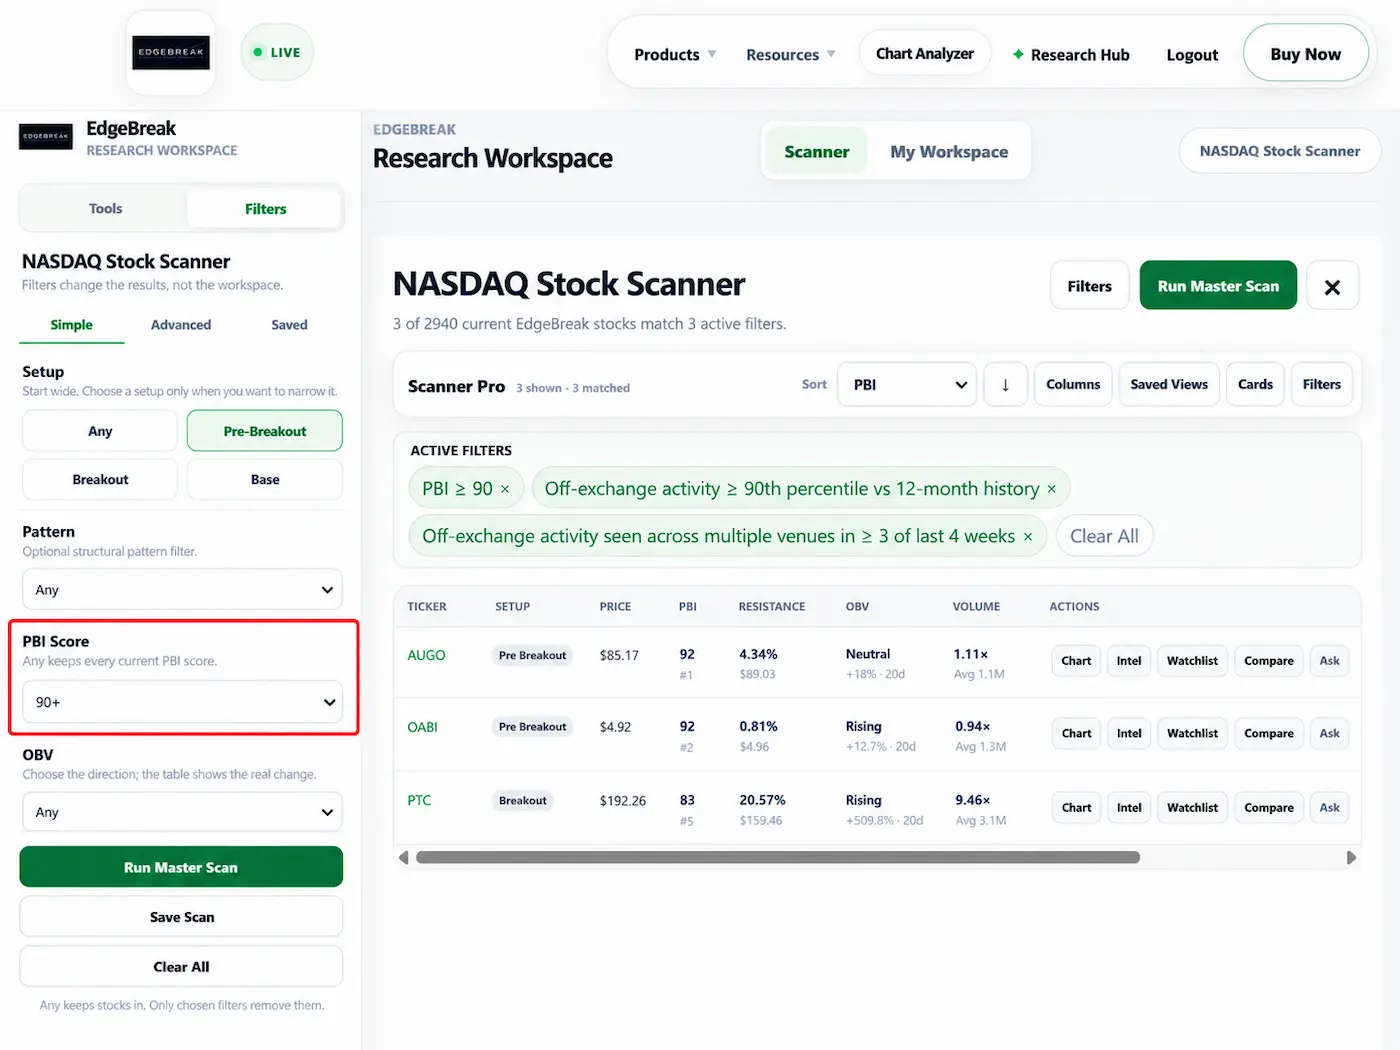
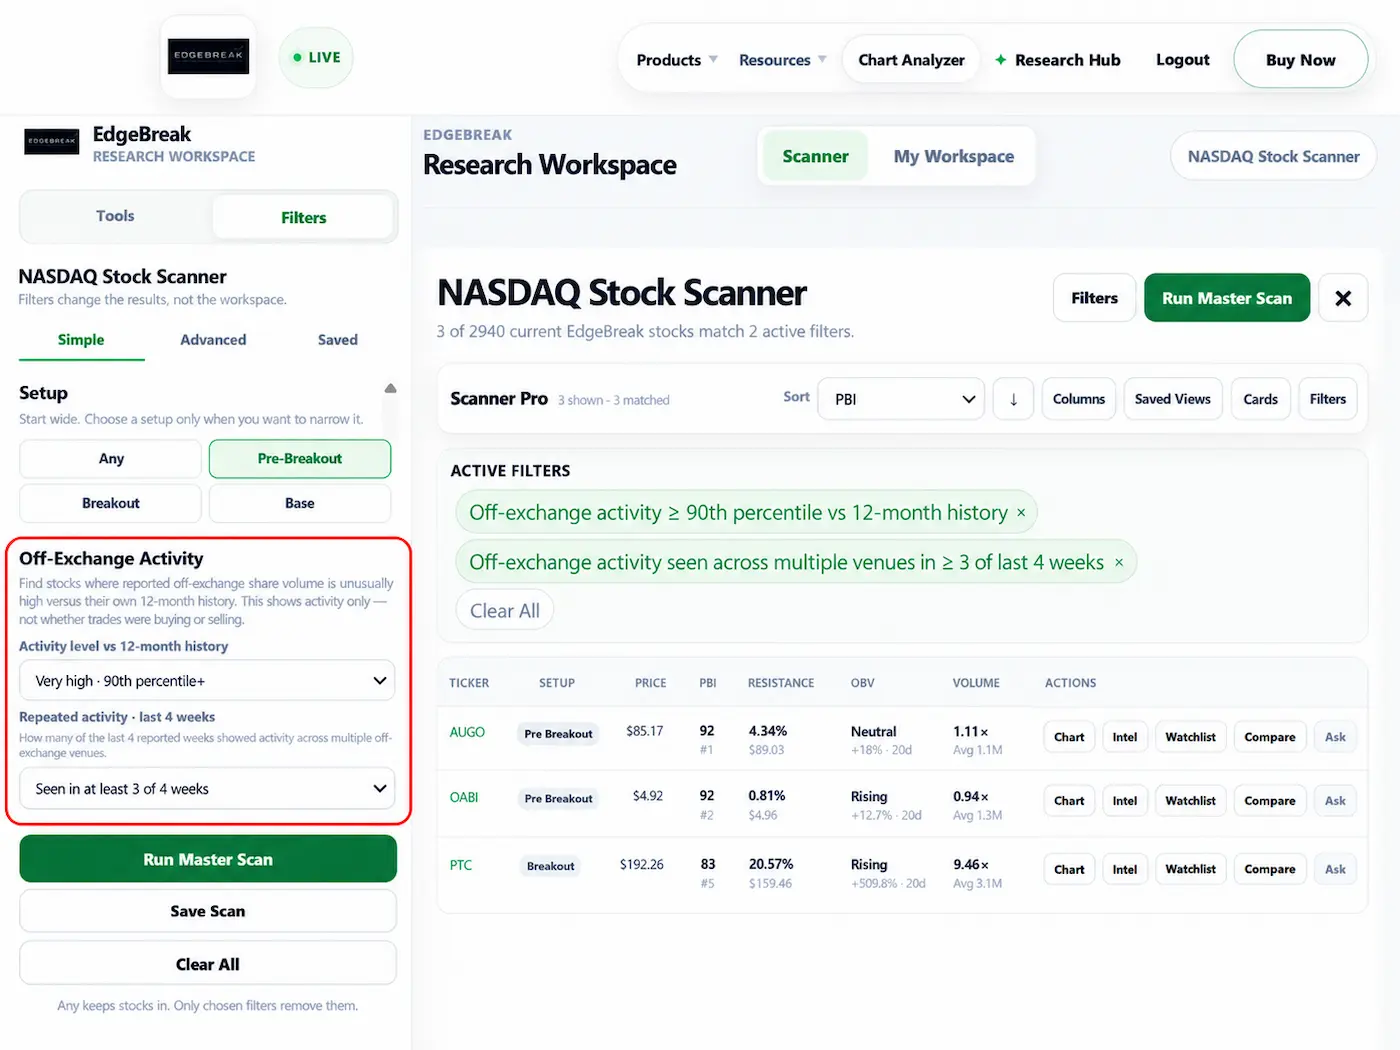
Traders often talk about “dark pool” activity. EdgeBreak gives you a more complete research lens: reported off-exchange trading activity, measured against a stock's own history and organised into signals you can investigate.
Look for unusual participation footprints — even when a chart alone doesn't tell the full story — and compare them with higher lows, resistance, OBV, RVOL and PBI.
This is analysis of reported market activity, not non-public insider information. Off-exchange does not necessarily mean a dark-pool trade; these records do not identify buyers or sellers or prove institutional accumulation.
Open a ticker in Stock Hub and move from price structure into scanner intelligence, PBI, OBV, RVOL, signal history, off-exchange participation and deeper company research without jumping between unrelated tools.
Move through chart and price structure → current scanner intelligence → signal history → breakout history → off-exchange activity → company overview → financial highlights → available institutional research → SEC filings → recent news.
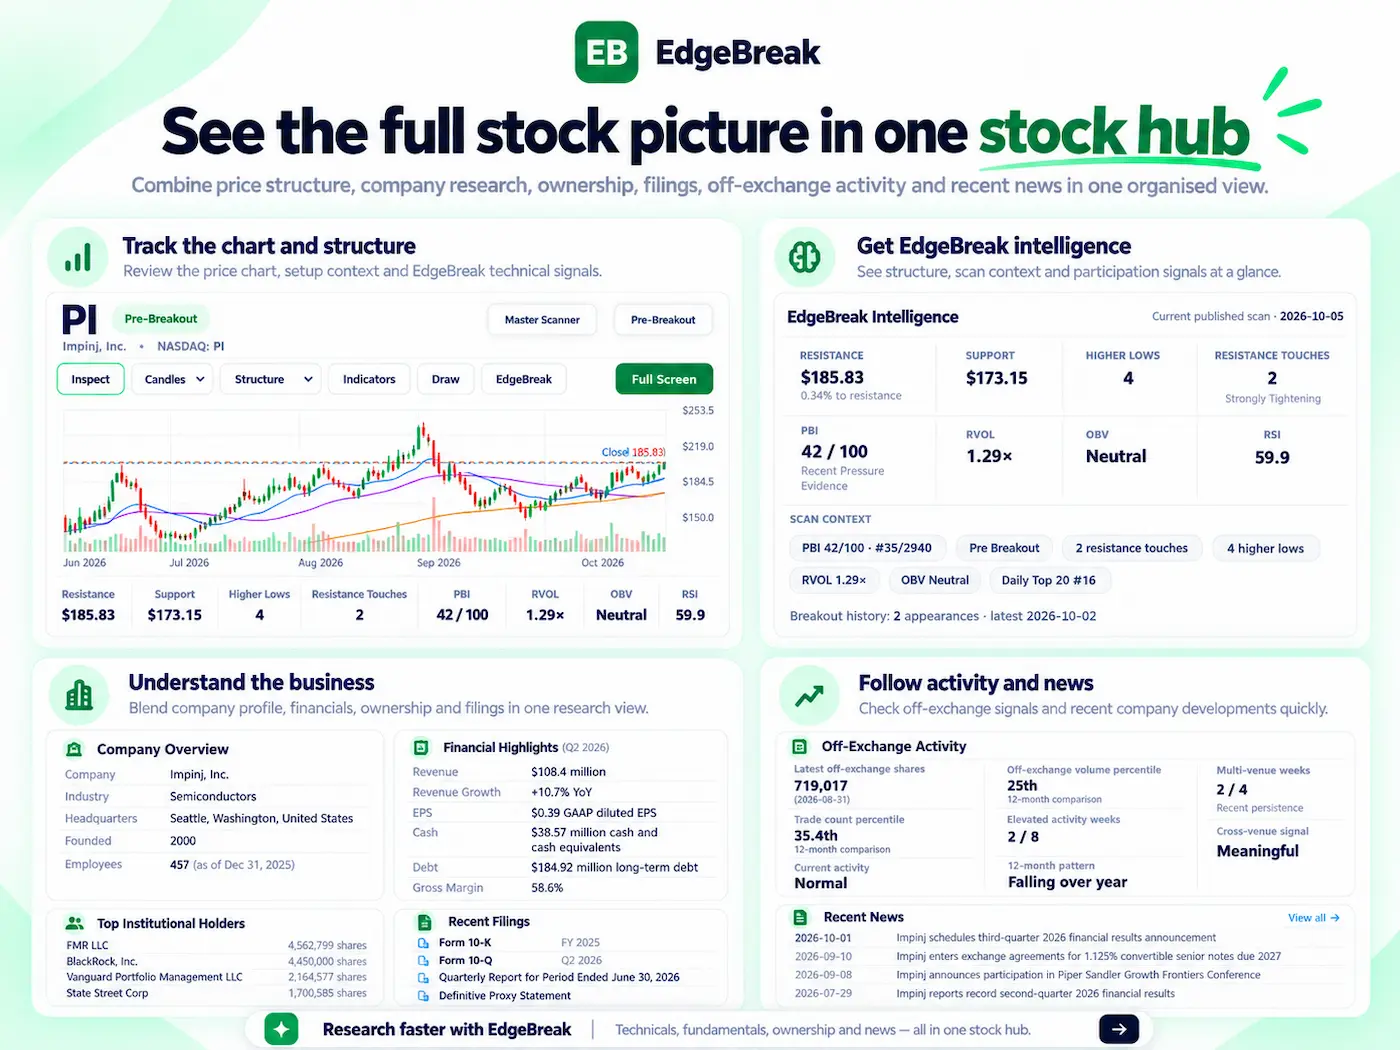
Move from technical discovery into company research without starting again. EdgeBreak AI Stock Research brings together the available company information, financial highlights, recent news, filings and research context for the stock you are investigating.
EdgeBreak supports both structured controls and normal conversation. Use whichever is faster for the question you are asking.
Describe the setup you want to find in plain language, refine scanner results conversationally, or ask general questions about charts, indicators, technical analysis and trading research.
Continue the same scanner and chart workflow inside ChatGPT. The integration is designed for natural questions, filtering, stock investigation, chart review and watchlist workflows without exposing the underlying tool complexity.
Saved searches, Watchlist, My Workspace, EdgeBreak Today and first-party charts support the main scanner and AI workflow instead of competing with it.
Build the combinations you care about — for example structure, resistance, PBI, participation or volume conditions — and save the search for later use.
Save stocks to your Watchlist, use My Workspace to continue the investigation, and return to EdgeBreak Today to review current published changes and scanner context.
The scanner finds and filters candidates. EdgeBreak charts show the structure. AI Chart Analyzer can inspect or match a chart. AI Stock Research adds company context. EdgeBreak AI and ChatGPT let you continue the investigation conversationally.
EdgeBreak can search the current NASDAQ universe for Breakouts, Pre-Breakouts, technical bases and other supported structures. You can refine results with available fields such as PBI, higher lows, resistance, support, OBV, RVOL, moving-average relationships and other technical conditions.
Yes. The Master Scanner is designed so you can combine the available filters into searches that fit your research process and save those searches for later use.
Yes. AI Chart Analyzer can describe visible technical structure from an uploaded chart or use the chart as a structural reference to find qualifying similar setups in the current EdgeBreak NASDAQ universe.
AI Stock Research helps continue an investigation with available company information, financial highlights, recent news, filings and other research context.
You can describe the scanner setup you want to find, refine current results in normal language, or ask general research questions about technical analysis, charts, indicators, market structure and trading concepts.
EdgeBreak is being prepared for ChatGPT integration. Pro includes ChatGPT access when the integration is publicly available.
Start with the NASDAQ Master Scanner, save the searches you use, inspect the chart, analyse or match it with AI, research the company and continue the conversation.