US Stock Market Scanner · NASDAQ + NYSE

AUTOMATED RESEARCH + AI CHART TOOLS

The market is scanned.
Start with the shortlist.

Every completed US session, EdgeBreak prepares ranked Top 20 Breakouts for NASDAQ and NYSE, plus developing Pre-Breakouts and Best Bases. Open our research-configured Signature Scans or build your own scan. Then explore charts, AI technical analysis and Stock Hub — all in one workflow.

EdgeBreak Standard: US$35/month after an eligible trial. Full rankings and member Signature Scans require a subscription.

✓ NASDAQ + NYSE Auto Scans ✓ Top 20 ranked Breakouts ✓ Pre-Breakouts + Bases ✓ Signature Scans ✓ AI chart research
Your research, already started

Stop searching from scratch.
Open what EdgeBreak found.

Our automated research engine screens supported US stocks after the close. Signature Scans apply ready-configured research criteria to surface current candidates. You get a useful starting list; charts and company research help you judge each setup independently.

01 · Automated after market close

NASDAQ + NYSE Auto Scans

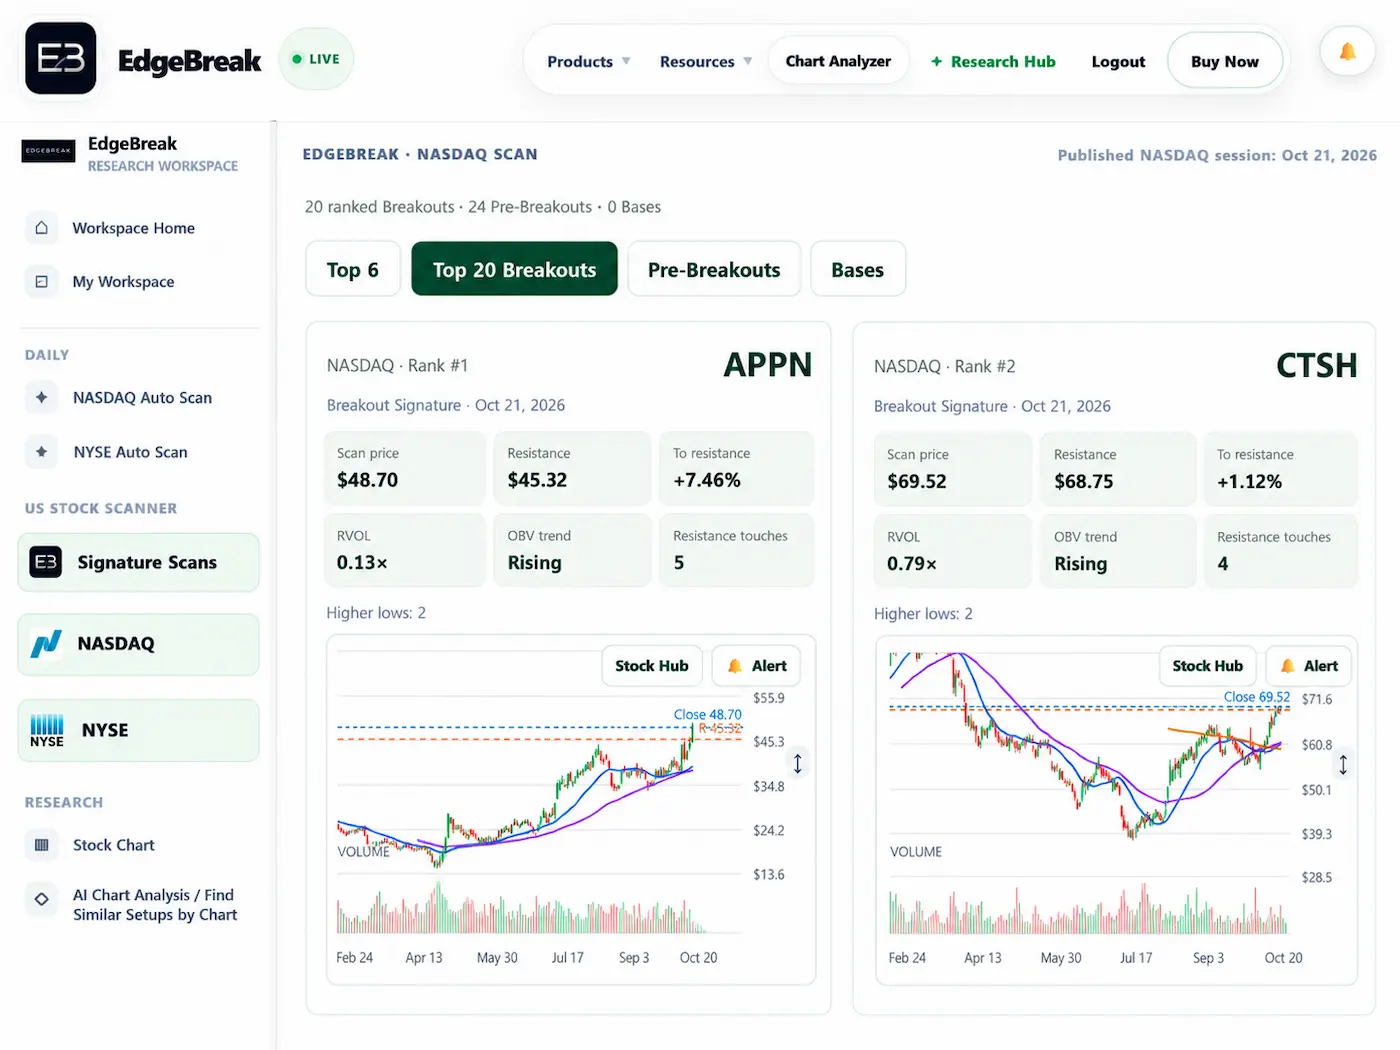
Open a ranked Top 20 Breakout shortlist for each exchange, alongside developing Pre-Breakout candidates and structured Bases. The research engine does the first screening pass, without you having to configure a filter.

EdgeBreak NASDAQ Auto Scan showing the Top 20 Breakouts and chart research results
Example of the EdgeBreak Auto Scan interface. Ranked lists and candidate counts vary by session.
NASDAQ + NYSERanked BreakoutsPre-BreakoutsBases
02 · EdgeBreak research configured for you

Signature Scans

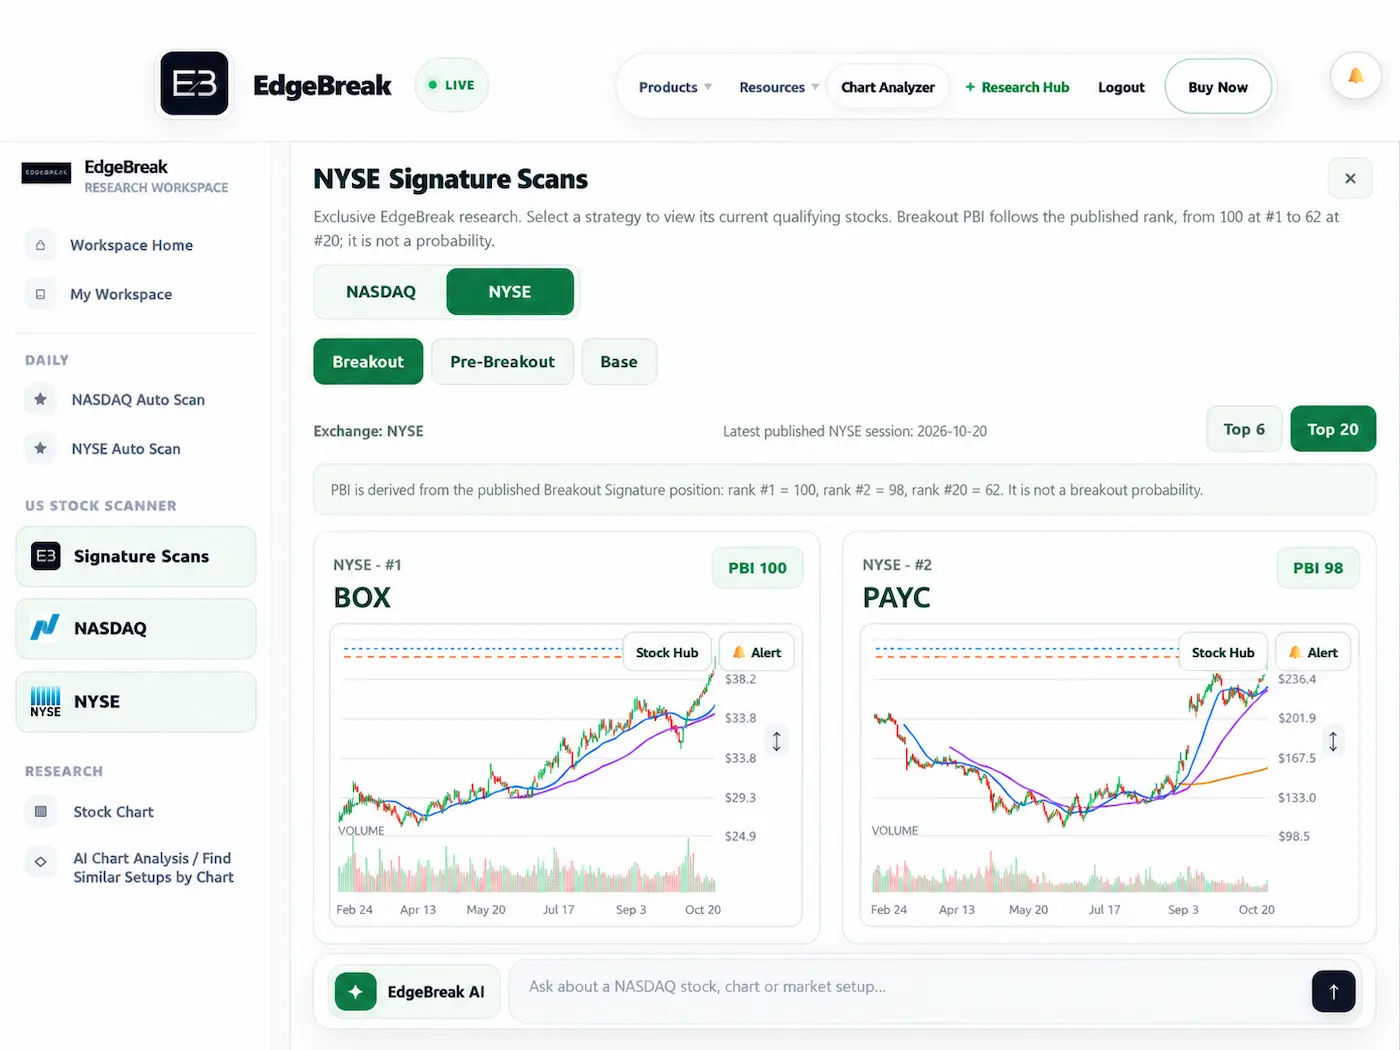
We've done the setup research and configured the scan criteria. Open current Breakout, Pre-Breakout and Base candidates for NASDAQ or NYSE without building your own scanner rules. Explore results, charts and Stock Hub research.

EdgeBreak NYSE Signature Scans showing ranked stock setups and charts
Example of the EdgeBreak Signature Scans interface. Current candidates and chart data vary by session.
Ready-configured criteriaBoth exchangesCurrent setup matches
Top 20 BreakoutsUp to 20 ranked Breakout candidates per exchange, based on the latest published scan.
Pre-BreakoutsDeveloping structures approaching resistance before a breakout is confirmed.
Best BasesOrganised base structures for further chart and technical research.

The number of qualifying stocks varies by session. “Top 20” refers to the Breakout ranking; Pre-Breakout and Base categories are published qualifying lists, not guaranteed 20-stock rankings. Research candidates, not trading recommendations.

See Full Scanner Plans → Auto Scans, Signature Scans and full custom scanner filters are included with eligible Standard membership.

Found a setup? Put EdgeBreak AI to work.

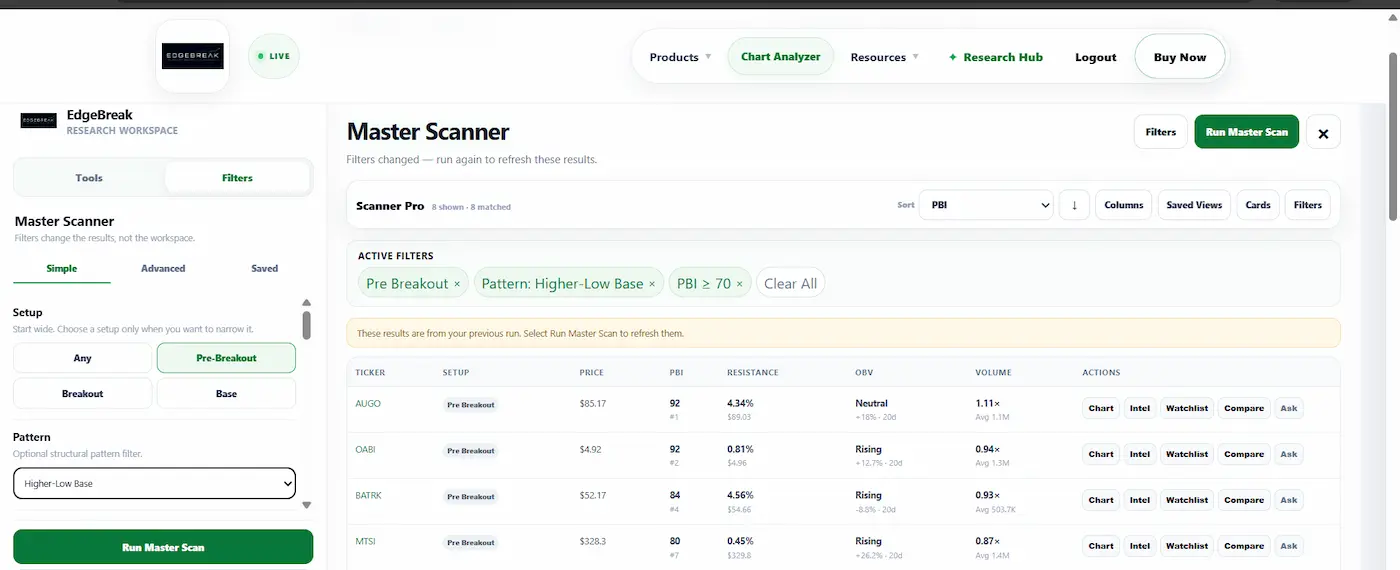
Go beyond a ticker list: inspect support, resistance and volume, use AI chart analysis or find similar chart structures, then continue into Stock Hub for company context. You stay in control of every trading decision.

EdgeBreak US Stock Market Scanner custom filter workspace showing PBI, OBV, patterns and resistance
2US exchanges: NASDAQ + NYSE
Top 20Ranked Breakout candidates per exchange
3Setup stages: Breakouts, Pre-Breakouts and Bases
OneWorkflow with Auto Scans, Signature Scans and AI research
Example research workflow

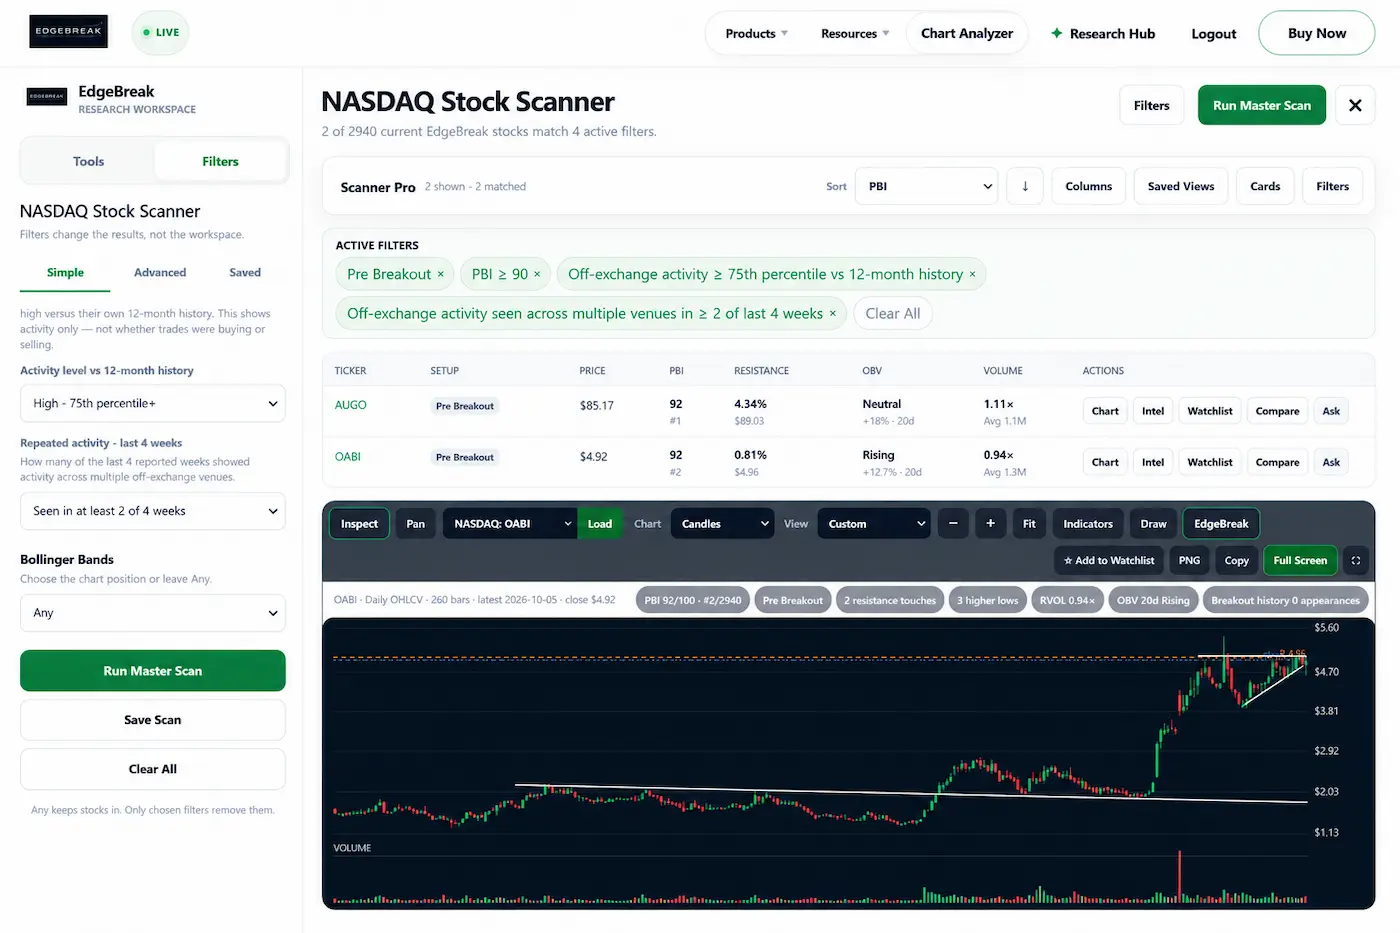
Want more control? Build your own stock scan.

For example: Find US-listed Pre-Breakout stocks with PBI ≥ 90, off-exchange activity at or above the 75th percentile of their 12-month history, and off-exchange activity across multiple venues in at least 2 of the last 4 reported weeks.

One scanner, more control

Automated to start. Customisable when you want.

The US Stock Market Scanner brings NASDAQ and NYSE setup filters together so you can start broad, combine conditions and refine published stock results without jumping between multiple scanner pages.

01 · SETUP

Choose the stage

Start with any current stock, or narrow by Breakout, Pre-Breakout, base and supported scanner combinations.

02 · PATTERN

Search structure

Filter for supported patterns such as ascending triangles, tight bases, resistance compression, higher-low bases, bull flags and support bounces.

03 · EVIDENCE

Add technical context

Combine PBI, OBV, RSI, volume, resistance behaviour, moving averages and other technical conditions to tighten the result set.

US Stock Market Scanner filters

Go from broad discovery to a precise research list.

Every filter starts open. Add only the conditions that matter to the setup you are researching and rerun the scanner as you refine the idea.

Breakout stage Chart pattern PBI OBV RSI Relative volume Resistance distance Resistance tests Higher lows Moving-average crosses Trend MACD Bollinger Bands Off-exchange activity
A stock matching your filters is a research candidate, not a prediction. EdgeBreak keeps discovery separate from the decision you make after reviewing the chart, company and wider market context.
Setup + patternDefine where the stock is in its structure and what kind of chart setup you want to investigate.
PBI + OBVUse pressure-building and volume-flow context to refine the technical picture.
Resistance + higher lowsFilter by proximity to resistance, repeated tests and improving support structure.
Volume + indicatorsAdd relative volume, RSI, trend, MACD, Bollinger Bands and moving-average conditions.
Off-exchange contextFor members, add unusual reported off-exchange volume and repeated multi-venue activity as research context.
Saved scansSave useful filter combinations so recurring research setups are faster to run again.
Built into one scanner

Explore Breakouts, Pre-Breakouts and Bases your way.

Choose the setup mode inside the US Stock Market Scanner, then combine it with pattern, PBI, OBV, resistance, volume and other supported filters.

BreakoutSearch stocks moving through established resistance.Built into Master Scanner
Pre-BreakoutSearch developing structures approaching resistance before confirmation.Built into Master Scanner
Base / Launch PadSearch organised bases and established trading ranges.Built into Master Scanner
Connected research workflow

Find the stock, then keep investigating.

Auto Scan and Signature Scan results connect into charts, AI chart analysis and Stock Hub research.

01 · SCANScan US stocksRun your selected filters against the current EdgeBreak scanner universe.
02 · CHARTInspect structureOpen the EdgeBreak chart and review resistance, higher lows, volume and recent price behaviour.
03 · RESEARCHCheck the companyContinue into company information, financial highlights, news, filings and institutional context.
04 · ORGANISEUse My WorkspaceAdd candidates to your watchlist and keep your ongoing research in one place.
Set live price and technical alerts.

Set observed-price thresholds for supported NASDAQ and NYSE stocks during regular US trading hours. Technical-condition alerts are checked after completed daily scans. Alert history is available in EdgeBreak; optional device push delivery is still being verified.

Set Live Stock Alerts
Three ways to discover US stock setups

We do the first screening pass.

Start with published NASDAQ and NYSE Auto Scans, open Signature Scans configured from EdgeBreak's setup research, or build a custom search with your own technical criteria.

01 · AUTOMATED

Daily Auto Scans

Up to 20 ranked Breakouts per exchange, plus Pre-Breakouts and Bases. Open the shortlist without choosing filters.

02 · SIGNATURE

Signature Scans

Use pre-configured EdgeBreak research criteria for Breakout, Pre-Breakout and Base candidates across NASDAQ and NYSE.

03 · CUSTOM

Your own US Stock Scan

Choose chart patterns, OBV, RVOL, PBI, resistance and other filters to refine your research.

Common questions

US Stock Market Scanner FAQ.

What is included in NASDAQ and NYSE Auto Scans?

After a completed US market session, EdgeBreak publishes up to 20 ranked Breakouts per exchange, plus Pre-Breakout and Base qualifying lists. The number of matching stocks varies by session.

What are EdgeBreak Signature Scans?

Signature Scans use EdgeBreak's research-configured criteria so members can open current NASDAQ and NYSE candidate lists without building each filter combination. Results link to charts and stock research.

What is the EdgeBreak US Stock Market Scanner?

It searches published NASDAQ and NYSE stock setups with technical structure, pattern, PBI, OBV, volume, resistance, moving-average and market-activity filters. Supported stock prices update live during regular US trading hours.

Where are Breakout, Pre-Breakout and Launch Pad now?

They are setup filters inside the US Stock Market Scanner. Select Breakout, Pre-Breakout or Base / Launch Pad, then add your preferred technical filters.

Which US exchanges does EdgeBreak cover?

EdgeBreak searches published NASDAQ and NYSE results, subject to data availability and universe rules. Supported prices update live during regular US market hours; scanner indicators use published data.

Can I search for chart patterns?

Yes. Supported US Stock Market Scanner patterns include ascending triangles, tight bases, resistance compression, higher-low bases, bull flags and support bounces.

Does a scanner match mean I should buy the stock?

No. Scanner matches are research candidates. EdgeBreak does not provide buy, sell or hold recommendations, and a technical setup does not guarantee future performance.

The shortlist is already waiting

Start with what EdgeBreak found.
Go deeper when you want to.

NASDAQ and NYSE Auto Scans, developing Pre-Breakouts and Bases, Signature Scans, custom filters, AI chart analysis and Stock Hub research — all in one membership.

Standard US$35/month · Pro with ChatGPT US$45/month introductory (normally US$50)
Eligible trial · Cancel anytime · Educational research, not trading advice