Trading Insights
Pre-Breakout
Stock Scanner.
Learn how scanning can surface NASDAQ stocks developing resistance, higher lows and tighter structure before price makes a confirmed move through resistance.
Pre-Breakout Research
August 2026
8 min read
What is a pre-breakout stock scanner?
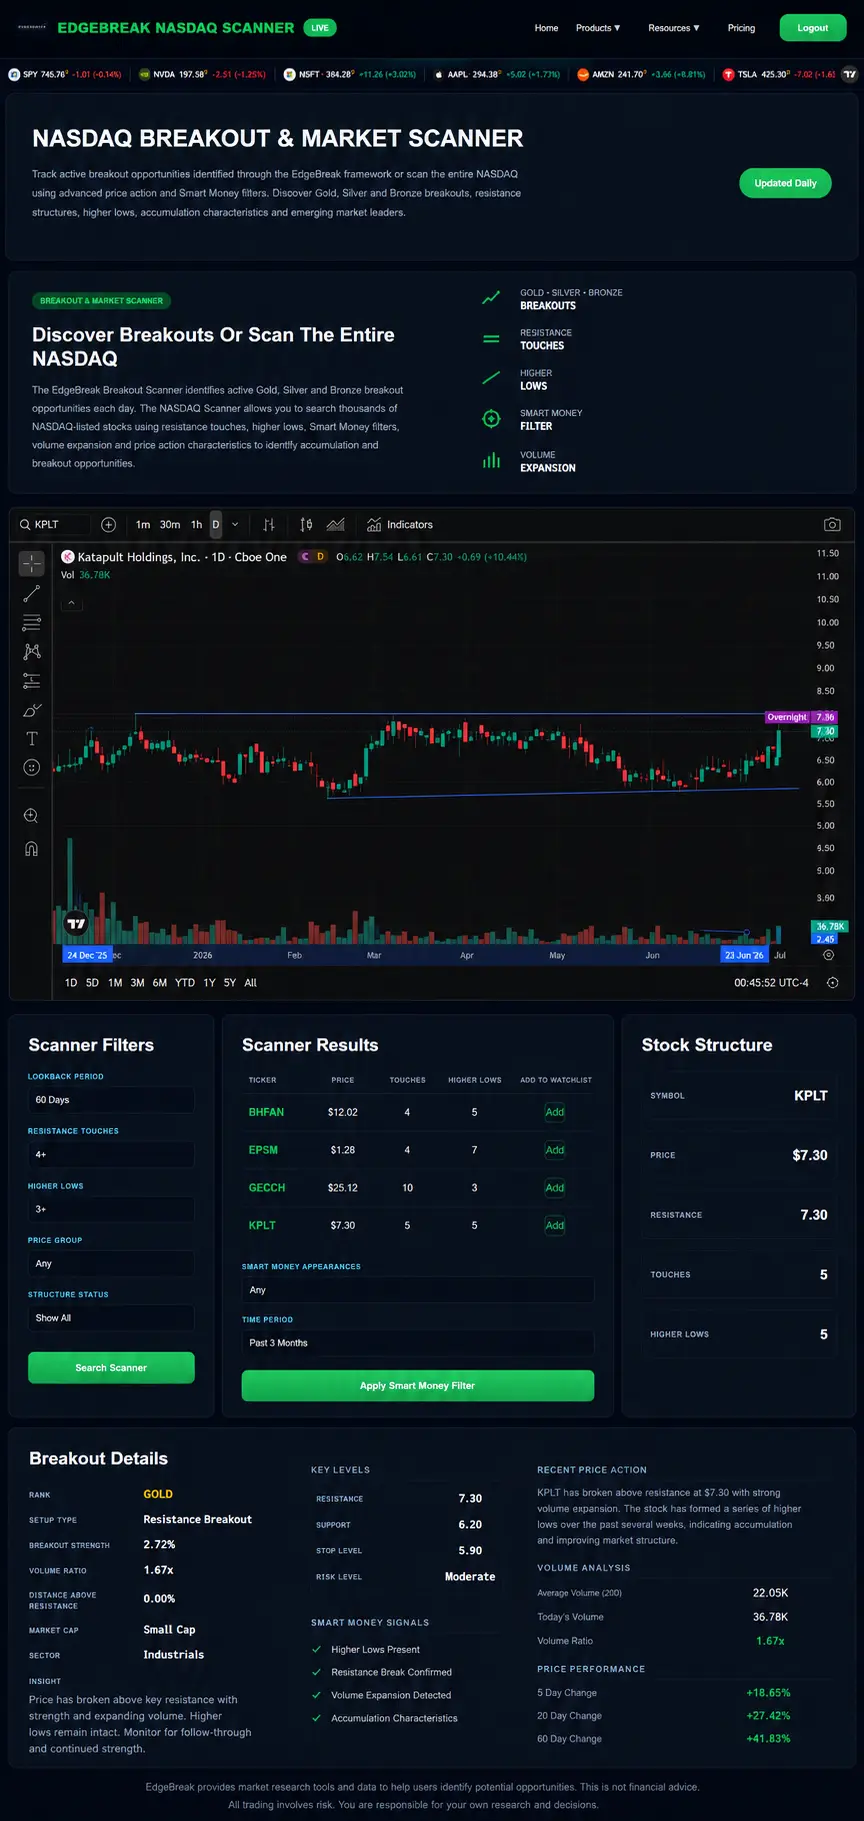
A pre-breakout stock scanner identifies stocks trading below or near resistance while displaying technical characteristics commonly associated with developing breakout structures.
The objective is not to predict that a breakout will occur. It is to find stocks that may deserve closer observation before a confirmed move through resistance takes place.
Why look before the breakout?
Once a stock moves through resistance, price can sometimes change quickly. If the company has not already been researched, the investor may be reacting to the move without much context around the structure that came before it.
Pre-breakout scanning creates an earlier research window so the stock can be investigated while the setup is still developing.
Repeated resistance tests
Resistance develops when price repeatedly struggles to continue higher around a similar area. Multiple interactions with the same zone can make that level important when studying developing breakout structures.
A scanner can search thousands of NASDAQ stocks for those repeated interactions without requiring every chart to be opened manually.
Higher lows beneath resistance
Higher lows occur when successive pullbacks stop at progressively higher levels. When they form beneath a relatively stable resistance area, the range can begin to tighten.
This does not prove who is buying or guarantee that resistance will break. It simply describes an improving relationship between support and resistance.
Consolidation and tightening price action
Developing breakouts are often preceded by periods of consolidation. Price may spend several weeks moving between support and resistance while the range becomes more organised.
Tightening structure can make the setup easier to monitor because the technical boundaries become clearer.
Does a pre-breakout setup guarantee a breakout?
No. A stock can develop a technically interesting structure and still fail to move through resistance. It may remain in the range, weaken or build an entirely different structure.
Pre-breakout scanning should therefore be treated as a discovery and research filter rather than a prediction system.
Final thoughts
A pre-breakout stock scanner provides a systematic way to search a large market for stocks developing relevant technical structure before a confirmed move occurs.
Its value is not in predicting which stock will break out. The value is in finding resistance, higher lows, consolidation and organised bases early enough for the investor to investigate them properly.
Used as part of a broader research process, pre-breakout scanning can make NASDAQ stock discovery more focused, consistent and transparent.