NASDAQ BREAKOUT SCANNER

NASDAQ Breakout Scanner: How to Find Developing Breakout Stocks

August 2026 8 min read

A NASDAQ breakout scanner helps investors search thousands of stocks for developing technical structures without manually reviewing every chart. By identifying repeated resistance tests, higher lows, consolidation and breakout behaviour, a scanner can narrow the NASDAQ market to a smaller group of stocks that may deserve further research.

NASDAQ Breakout Scanner

What Is a NASDAQ Breakout Scanner?

A NASDAQ breakout scanner is software that automatically searches NASDAQ-listed stocks for technical characteristics associated with breakout structures.

Instead of manually opening thousands of charts, investors can use predefined rules to identify stocks displaying particular price behaviours.

What Is a Stock Breakout?

A breakout occurs when price moves beyond an established resistance area or trading range. Resistance is an area where price has previously struggled to move higher.

Not every move above resistance develops into a sustained trend. Breakout research therefore often considers the structure that developed before the breakout as well as the price movement itself.

What Can a Breakout Scanner Look For?

Why Scan the NASDAQ?

The NASDAQ contains thousands of listed companies across technology, healthcare, consumer, industrial and other sectors. Reviewing every chart manually each day is unrealistic for most individual investors.

Automated scanning allows a large market universe to be reduced to a smaller research list using consistent rules.

Breakout Scanner vs Stock Screener

Traditional stock screeners often filter companies using metrics such as price, market capitalisation, revenue or volume.

A breakout scanner is more focused on technical price behaviour. It attempts to identify how a stock is trading rather than simply filtering companies by static financial characteristics.

Why Market Structure Matters

A stock moving above resistance does not automatically make the surrounding structure strong. Investors may also research whether higher lows have developed, whether the trading range has tightened and whether volume supports the move.

Looking at these characteristics together can provide more context than analysing a single price movement in isolation.

How EdgeBreak Scans the NASDAQ

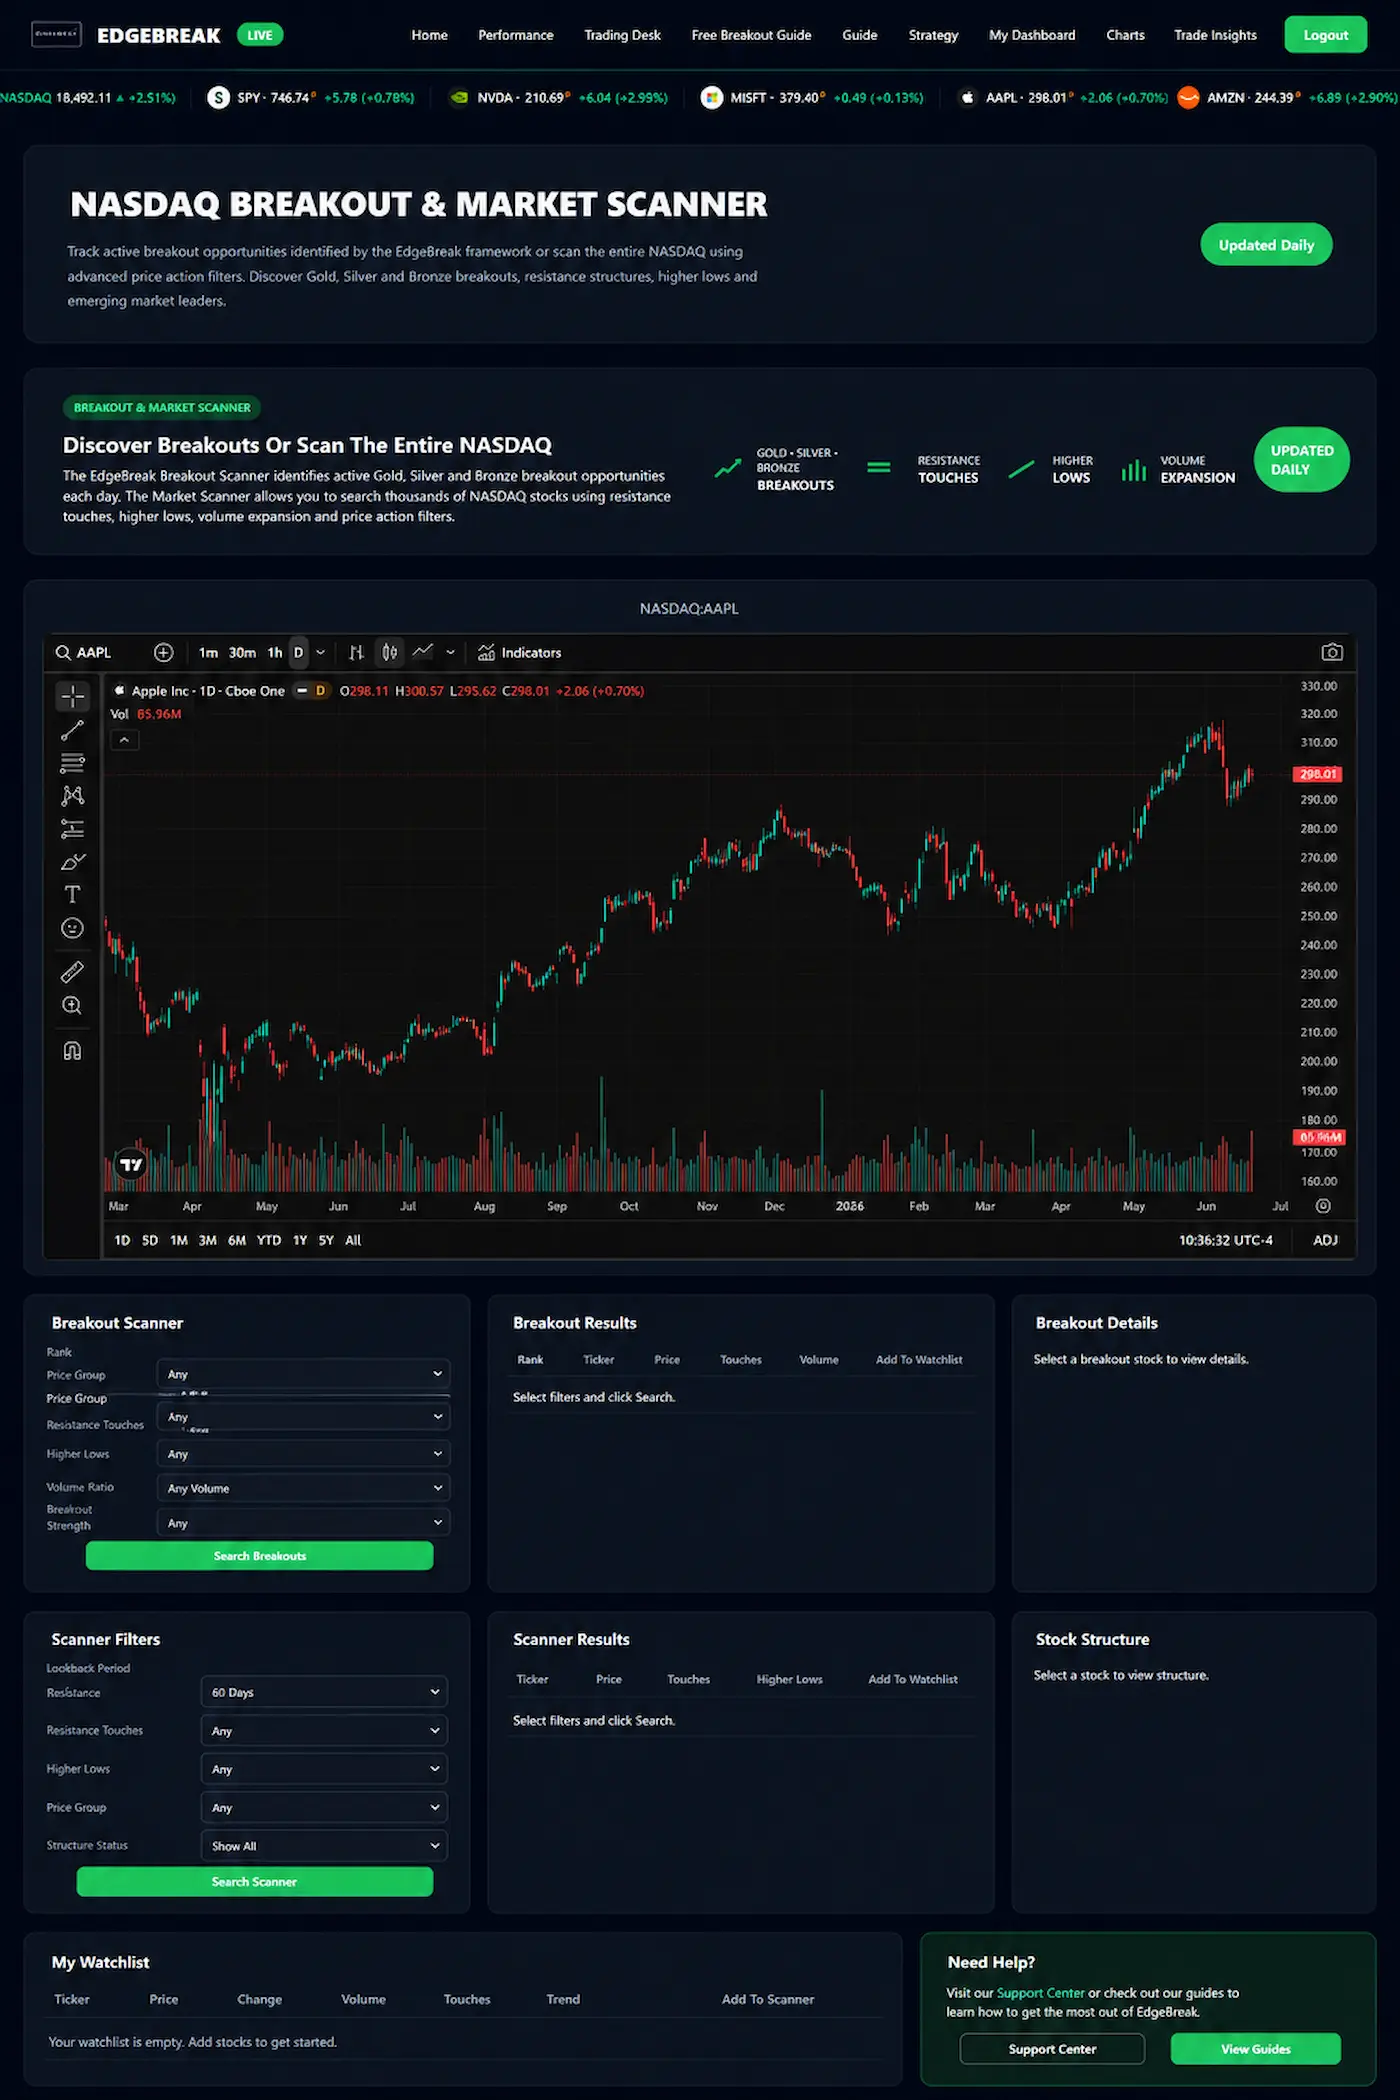
EdgeBreak automatically scans thousands of NASDAQ-listed stocks for breakout, pre-breakout and developing market structures. The scanner focuses on technical characteristics such as resistance, higher lows, support and price consolidation.

Scanner results can then be investigated using integrated AI stock research and AI chart analysis, allowing users to move from market discovery into deeper research within the same platform.

Final Thoughts

A NASDAQ breakout scanner can significantly reduce the amount of manual chart searching required to find developing technical structures. The scanner does not determine whether a stock should be bought or sold. Its role is to identify stocks that meet predefined research criteria so investors can decide what deserves further investigation.

EDGEBREAK NASDAQ SCANNING

Scan Thousands of NASDAQ Stocks Automatically

EdgeBreak searches the NASDAQ for breakout, pre-breakout and developing market structures, then provides integrated AI tools to help users research what the scanner finds.

Try the NASDAQ Breakout Scanner Free

Explore EdgeBreak Free and see how automated NASDAQ stock discovery works.

Try EdgeBreak Free