Trading Insights

How to Identify
Strong Breakout Stocks.

Learn which technical characteristics can make a breakout candidate worth deeper investigation before price becomes widely extended.

Breakout Research June 2026 8 min read
How to Identify Strong Breakout Stocks

Strong breakout structures usually develop over time

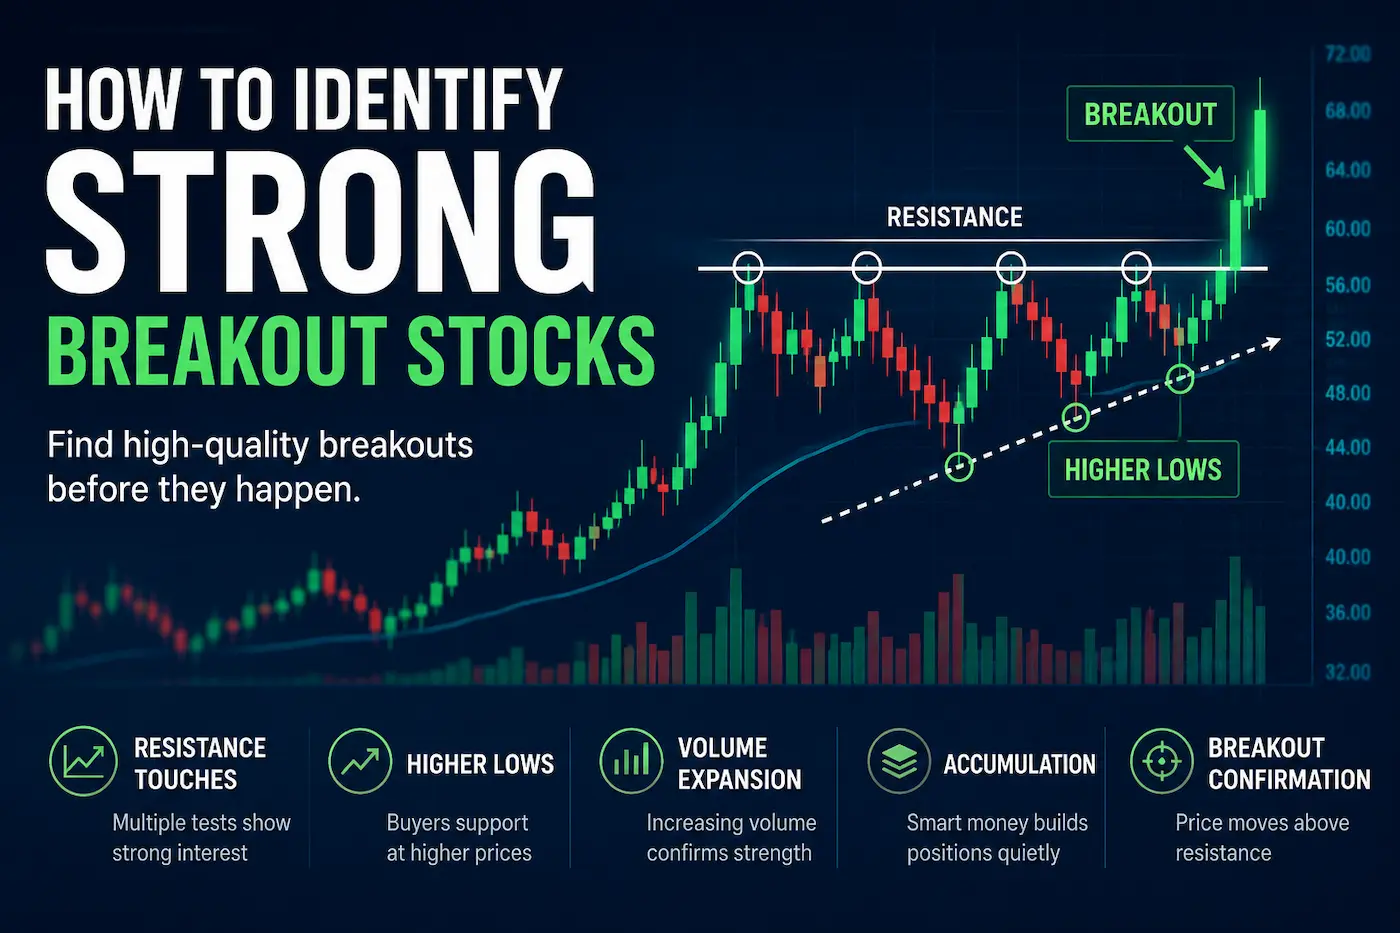
Many technically interesting breakouts begin developing well before price moves through resistance. The useful part of the research process is often identifying the structure while it is still forming rather than only noticing the stock after a large move.

Repeated resistance testing, improving support, higher lows, tighter consolidation and relevant volume behaviour can all help describe a stronger technical setup. None of these characteristics guarantee that a breakout will occur or succeed.

Start with resistance

Resistance gives the setup a clear reference point. When price repeatedly reacts around the same area, that level becomes useful for monitoring how the stock behaves over time.

Multiple tests do not guarantee a breakout, but they can make the structure easier to define and compare with the behaviour developing underneath the level.

The key idea

Stronger setups usually have
more evidence behind them.

A breakout candle is only one event. The stronger research case comes from understanding the base, support, resistance, consolidation, volume and broader context that developed before the move.

What to look for

Five characteristics worth researching.

No single feature makes a stock a strong breakout candidate. The structure becomes more useful when several constructive behaviours appear together.

01
Clear resistance A recognisable resistance area provides a defined technical level to monitor.
02
Higher lows Pullbacks begin finding support at progressively higher levels beneath resistance.
03
Tight consolidation Price becomes more organised and less volatile as the base develops.
04
Volume context Changes in activity can add context when interpreted alongside price structure.
05
Limited extension The stock remains close enough to the base that the original structure still matters.
Compare the quality

More organised
versus more fragile.

More organised

Stronger candidates generally provide more technical evidence before price challenges resistance.

✓
Repeated resistance testing over a meaningful period.
✓
Higher lows or stable support beneath the level.
✓
Tighter price action and more organised consolidation.
✓
Volume and broader context support continued investigation.

More fragile

A weaker research candidate may be approaching resistance without enough structure underneath the move.

—
Resistance is poorly defined or has barely been tested.
—
Lower highs or weak support dominate the structure.
—
Large volatile price swings make the base less organised.
—
The stock has already moved too far from the original setup.

Why higher lows matter

Higher lows show that price is finding support at progressively higher levels. In a breakout structure, this can indicate that the stock is spending more time closer to resistance rather than repeatedly falling back toward the bottom of the range.

Higher lows do not prove who is buying or guarantee that resistance will break. They simply describe a constructive change in the relationship between support and resistance.

Volume provides context

Volume helps show how much activity is occurring as the structure develops. Quiet volume during consolidation or stronger activity around an important resistance test can add context to the research.

The key is to interpret volume alongside price rather than treating it as a standalone confirmation signal.

Watch the whole base

One strong candle does not make a high-quality setup. The more useful question is whether the stock has been building an organised base over several weeks or months.

Clear resistance, improving support, tighter ranges and constructive closes can make the structure easier to understand before a breakout attempt occurs.

Avoid weak market structure

Not every stock approaching resistance deserves deeper research. Lower highs, weak support, wide daily swings and repeated breakdowns inside the range can all reduce the quality of the setup.

A disciplined process becomes more useful when stocks must meet several structural criteria rather than simply being close to resistance.

Build the watchlist before the move

A watchlist is most useful when it contains stocks that already have a reason to be monitored. This lets the investor follow the structure while it develops instead of reacting only after a large price move attracts attention.

It also provides time to investigate company information, market context and any other evidence that may matter before the structure changes.
How EdgeBreak approaches this

Structure first.
Deeper research second.

EdgeBreak uses rules-based NASDAQ scanning to surface stocks with relevant breakout, pre-breakout and base structures. Market activity, company research and AI chart analysis then add further context to the shortlist.

✓
Technical filtering Resistance, higher lows, base quality and extension are assessed before a stock becomes a stronger research candidate.
✓
Market activity context Unusual off-exchange and multi-venue behaviour can add evidence without being labelled confirmed buying or selling.
✓
Continue the investigation My Workspace, watchlists, company research, EdgeBreak Charts charts and AI chart analysis help users keep testing the evidence over time.

Final thoughts

Strong breakout candidates rarely come down to one technical feature. The more useful research process considers resistance, higher lows, consolidation, volume and overall base quality together.

These characteristics describe the strength of the current structure; they do not predict the future or guarantee that a breakout will succeed.

By identifying technically relevant stocks earlier and continuing to review the evidence over time, investors can build a more consistent and transparent breakout research process.

Find the structure

Then investigate
the evidence.

Use EdgeBreak to scan more than 3,200 NASDAQ-listed stocks, surface stronger technical candidates and continue your research with market activity, company information and chart analysis.

Chart Analyzer $25 • Standard $35 • Full Access $50
Research and educational information only • Not financial advice