Trading Insights
How Resistance
Levels Form.
Learn why price repeatedly reacts around certain areas and how resistance, higher lows, consolidation and volume can help you understand developing breakout structure.
Resistance Research
June 2026
6 min read
What is resistance?
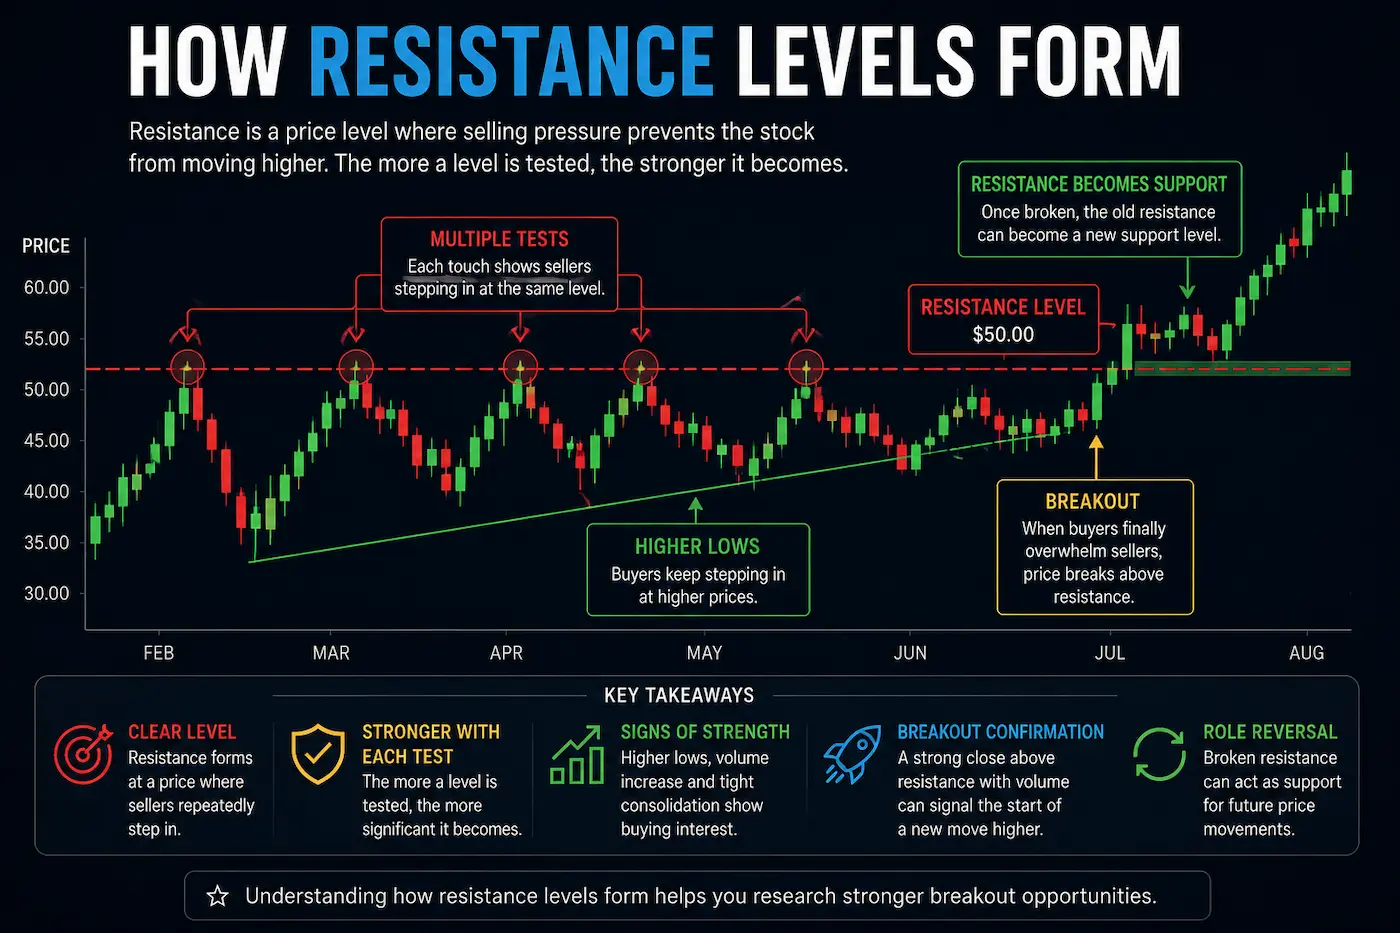
Resistance is a price area where a stock has repeatedly struggled to continue higher. As price approaches the area, selling activity may increase, buying may weaken, or both may occur together.
The important point is that resistance is usually better treated as an area rather than a perfectly exact price. Markets move continuously, so repeated reactions around a similar zone can be more meaningful than expecting every reversal to occur at the same cent.
Why does resistance form?
Resistance develops because many market participants make decisions around similar price areas. Some investors may take profits, others may reduce positions, and some may simply be unwilling to pay higher prices at that point.
When enough supply appears around the same area, upward progress can slow or reverse. If that behaviour repeats over time, the area becomes increasingly important to technical research.
Do repeated tests make resistance more important?
Repeated interaction with the same area can make a resistance zone more significant because it shows that price has repeatedly encountered difficulty there.
At the same time, more tests do not guarantee that the level becomes permanently stronger. The useful information is that the area is clearly recognised by the market and therefore deserves attention when price returns to it.
What happens during consolidation?
Stocks often spend time moving sideways beneath resistance. During this period, the relationship between support and resistance becomes easier to study.
Higher lows, tighter ranges and stronger closes can suggest that the structure is becoming more organised, but they do not prove who is buying or guarantee that resistance will eventually break.
When resistance becomes support
If price moves above resistance and later returns to the same area, the old resistance zone may become a new support reference.
This is not automatic. A failed retest can send price back into the previous range. The useful question is whether the stock can continue to hold above the level and build a new structure around it.
Research the level before the breakout
Resistance analysis becomes more useful when it begins before the breakout candle appears. Understanding how many times the area has been tested, whether support is improving and how organised the base has become creates better context for whatever happens next.
This also makes it easier to distinguish between a developing setup and a stock that only becomes noticeable after it has already moved far above the original level.
Final thoughts
Resistance levels develop because price repeatedly encounters difficulty around similar areas. The more clearly that behaviour can be observed, the more useful the level becomes for technical research.
Repeated tests, higher lows, consolidation and volume can all add context, but none of them guarantee that resistance will hold or break.
By treating resistance as part of a broader structure rather than a standalone signal, investors can build a more consistent and transparent process for researching breakout setups.