01
Discover
Start with EdgeBreak's automated daily scan or explore the Breakout, Pre-Breakout and Launch Pad scanners yourself.
A simple research workflow for moving from thousands of NASDAQ stocks to a focused watchlist you can investigate, verify and monitor.
EdgeBreak is designed to remove the repetitive first stage of stock research while keeping the final judgement with you.
Start with EdgeBreak's automated daily scan or explore the Breakout, Pre-Breakout and Launch Pad scanners yourself.
Look at resistance, higher lows, consolidation, volume behaviour and whether the technical setup is organised enough to deserve more attention.
Use EdgeBreak's market context and unusual off-exchange activity as another layer of evidence behind the chart — not as proof of confirmed buying.
Open AI Company Research to review the business, financial highlights, recent news, institutional context and SEC filings.
Add stronger candidates to your watchlist or My Workspace, then continue following the chart rather than trying to research everything at once.
The goal is not to collect hundreds of tickers. It is to reduce the market to a smaller group of stocks that justify deeper investigation.
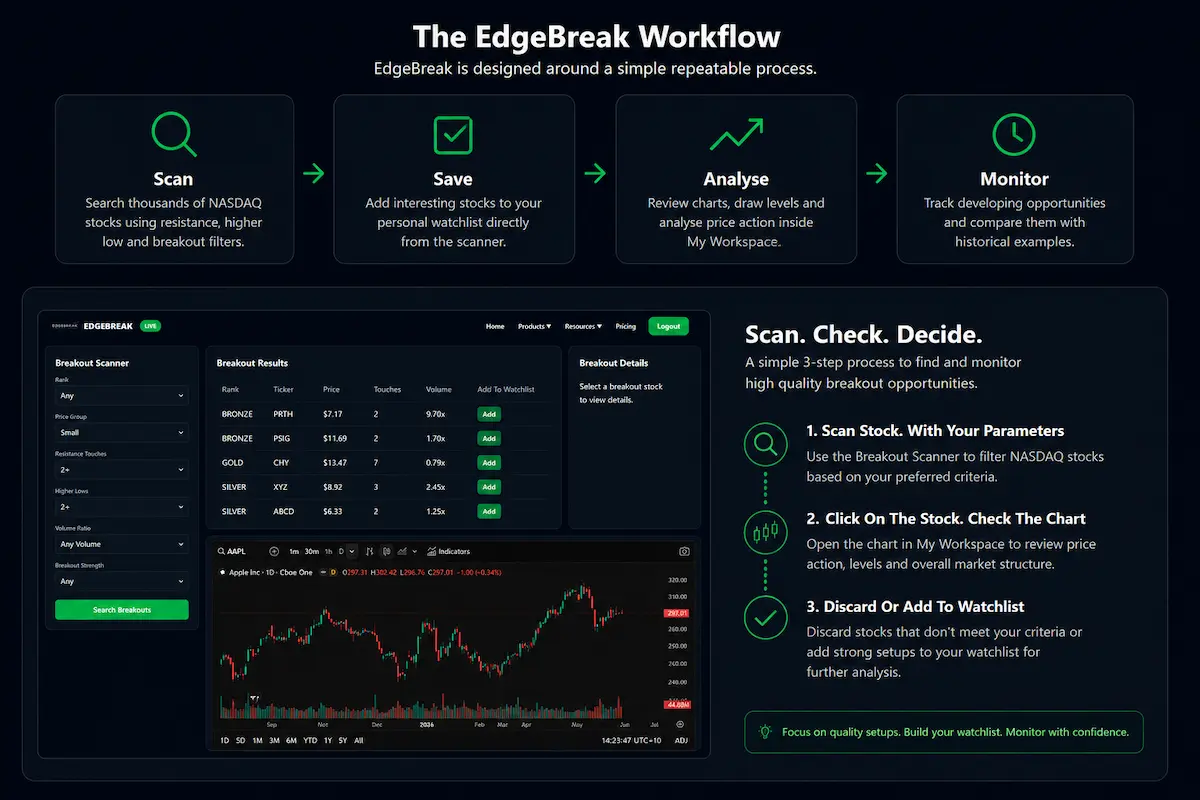
EdgeBreak narrows the field. Your next job is deciding whether the structure still makes sense when you inspect it.
Look for organised price action, constructive higher lows, defined resistance and controlled consolidation.
Compare volume behaviour with the price structure and look for evidence of participation strengthening as the setup develops.
Unusual market activity can add context, but should be treated as evidence for further research rather than confirmation of intent.
A breakout is easier to understand when you first recognise the base, resistance and higher-low structure that developed before it.
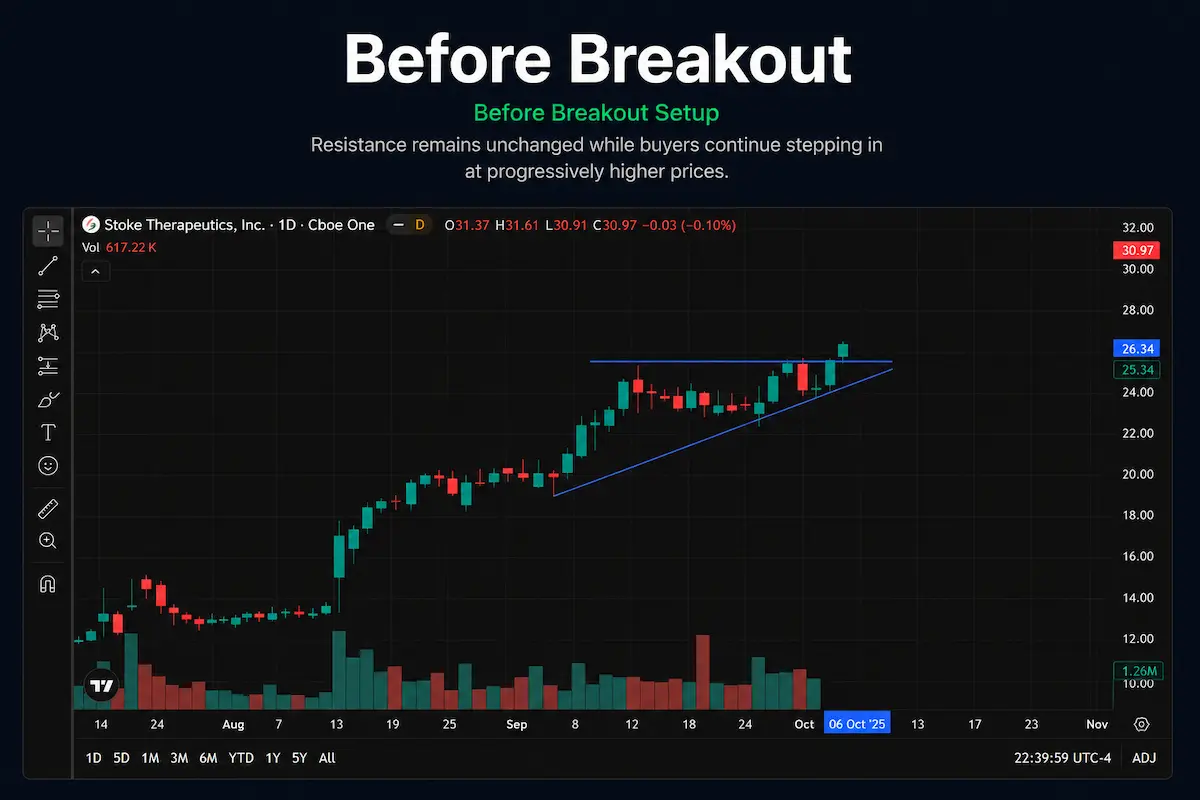
Resistance remains defined while buyers continue stepping in at progressively higher prices beneath the level.
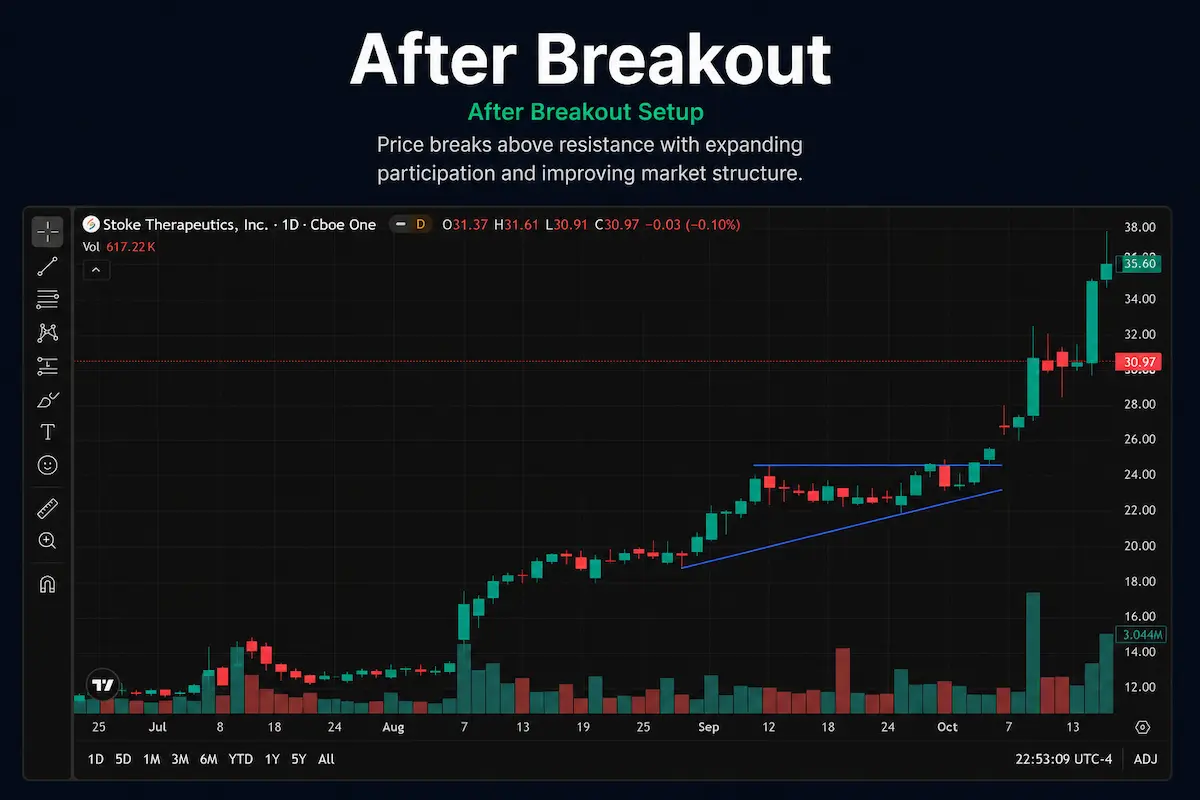
Price moves beyond resistance and the developing structure can then be reviewed against participation and follow-through.
These are educational examples of technical structures identified and followed using the EdgeBreak framework — not trading results or promises of future performance.
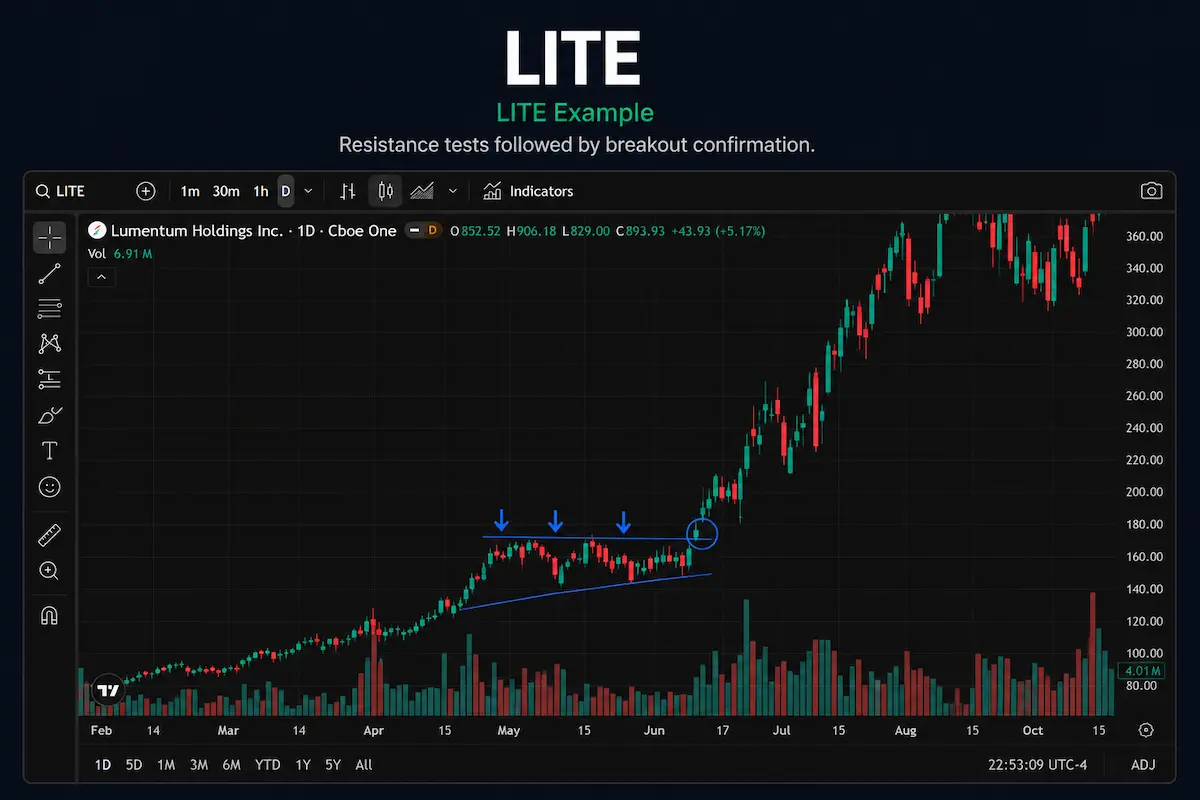
Repeated resistance testing followed by a later breakout structure.
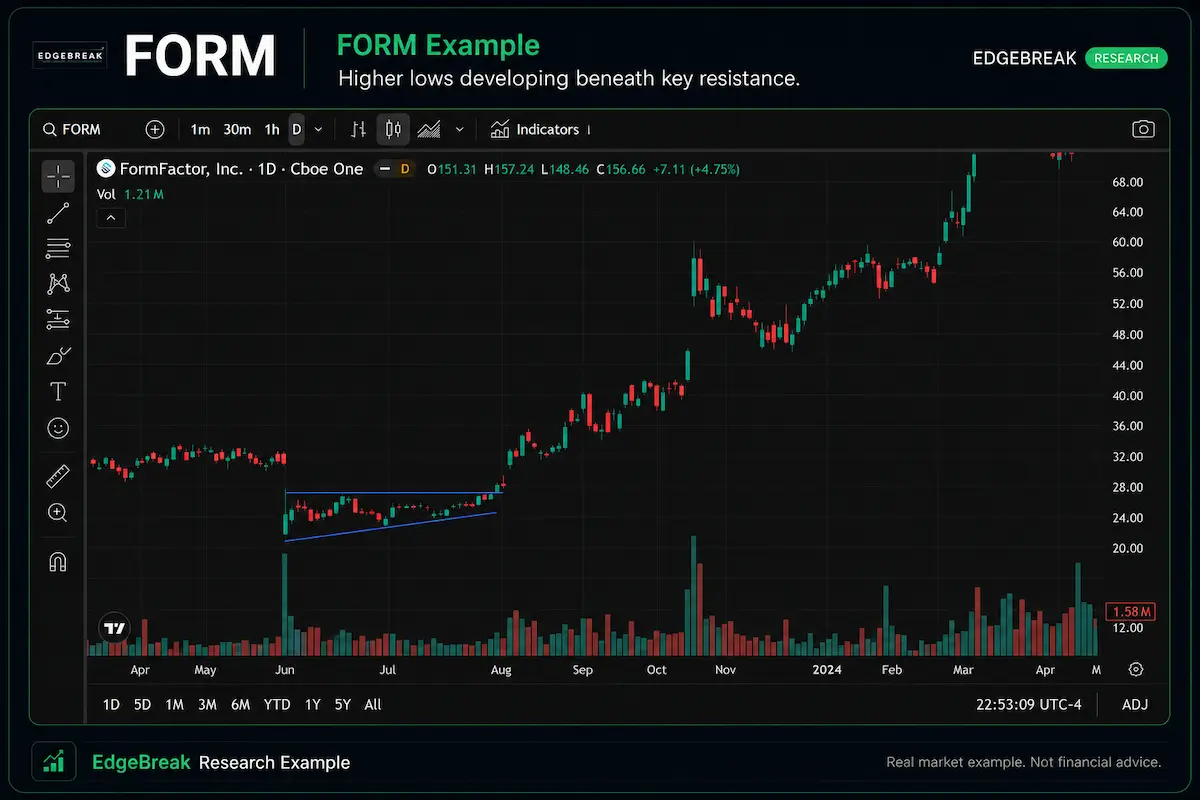
Higher lows developed beneath a clearly defined resistance area.
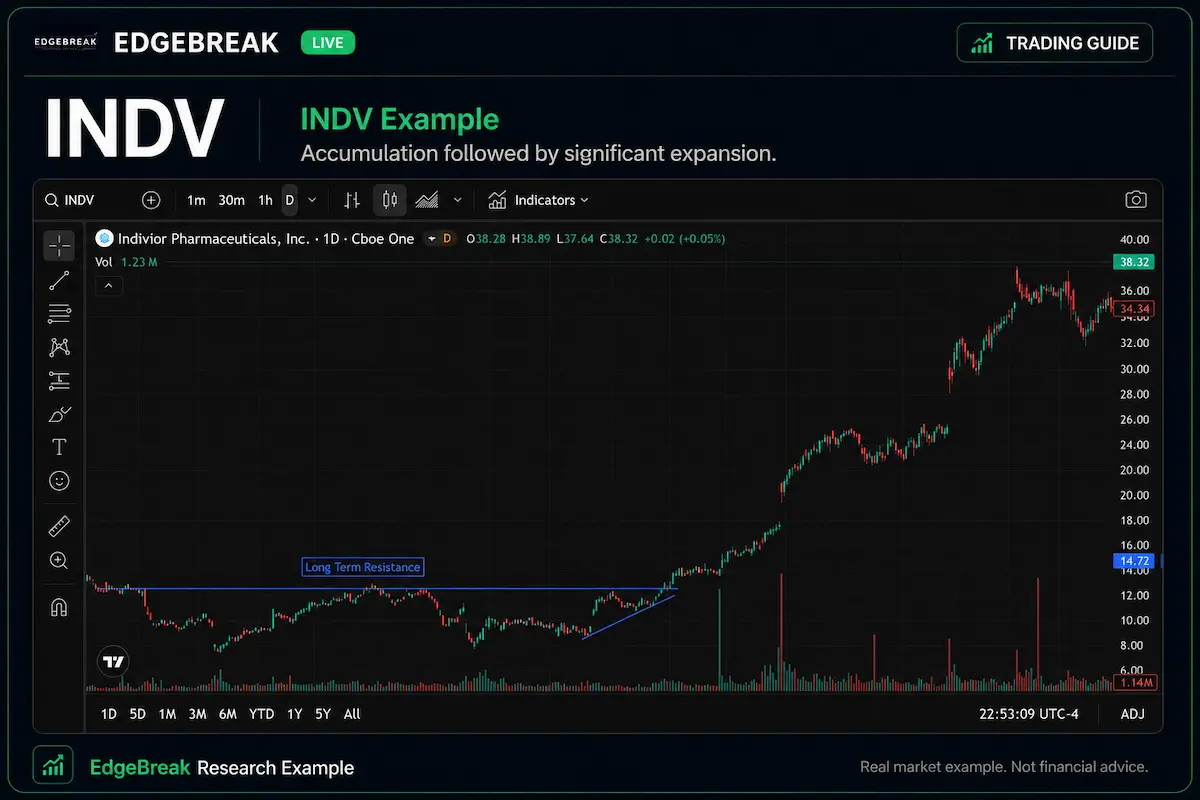
An organised structure that later expanded beyond its earlier trading range.
Use automated discovery plus Breakout, Pre-Breakout and Launch Pad scanners to find technical candidates.
Investigate company information and use descriptive chart analysis to understand structure, support, resistance and volume.
Save stocks, organise research and return to developing ideas without rebuilding your research list each day.
EdgeBreak can reduce the amount of market searching you need to do. It cannot replace your judgement, verification or responsibility.
It explains a repeatable research workflow for discovering, investigating and monitoring NASDAQ-listed stocks using EdgeBreak.
Start with the automated daily scan and EdgeBreak Academy. The scan gives you a small group of stocks to investigate, while the Academy explains the technical concepts behind the platform.
No. EdgeBreak provides stock discovery, research tools, educational content and descriptive analysis. It does not provide buy, sell or hold recommendations.
Review the technical structure, investigate the company, verify important information and save stronger candidates to your watchlist or workspace for continued monitoring.
No. Historical examples show structures previously identified or tracked using the EdgeBreak framework. They are educational examples and do not guarantee future performance.
Start with EdgeBreak's NASDAQ scanner and turn a huge market into a manageable research list.