Trading Insights
False Breakouts
Explained.
Learn why price can move through resistance and then fail, and how market structure, higher lows, volume and broader context can help you research the setup more carefully.
Breakout Research
June 2026
6 min read
What is a false breakout?
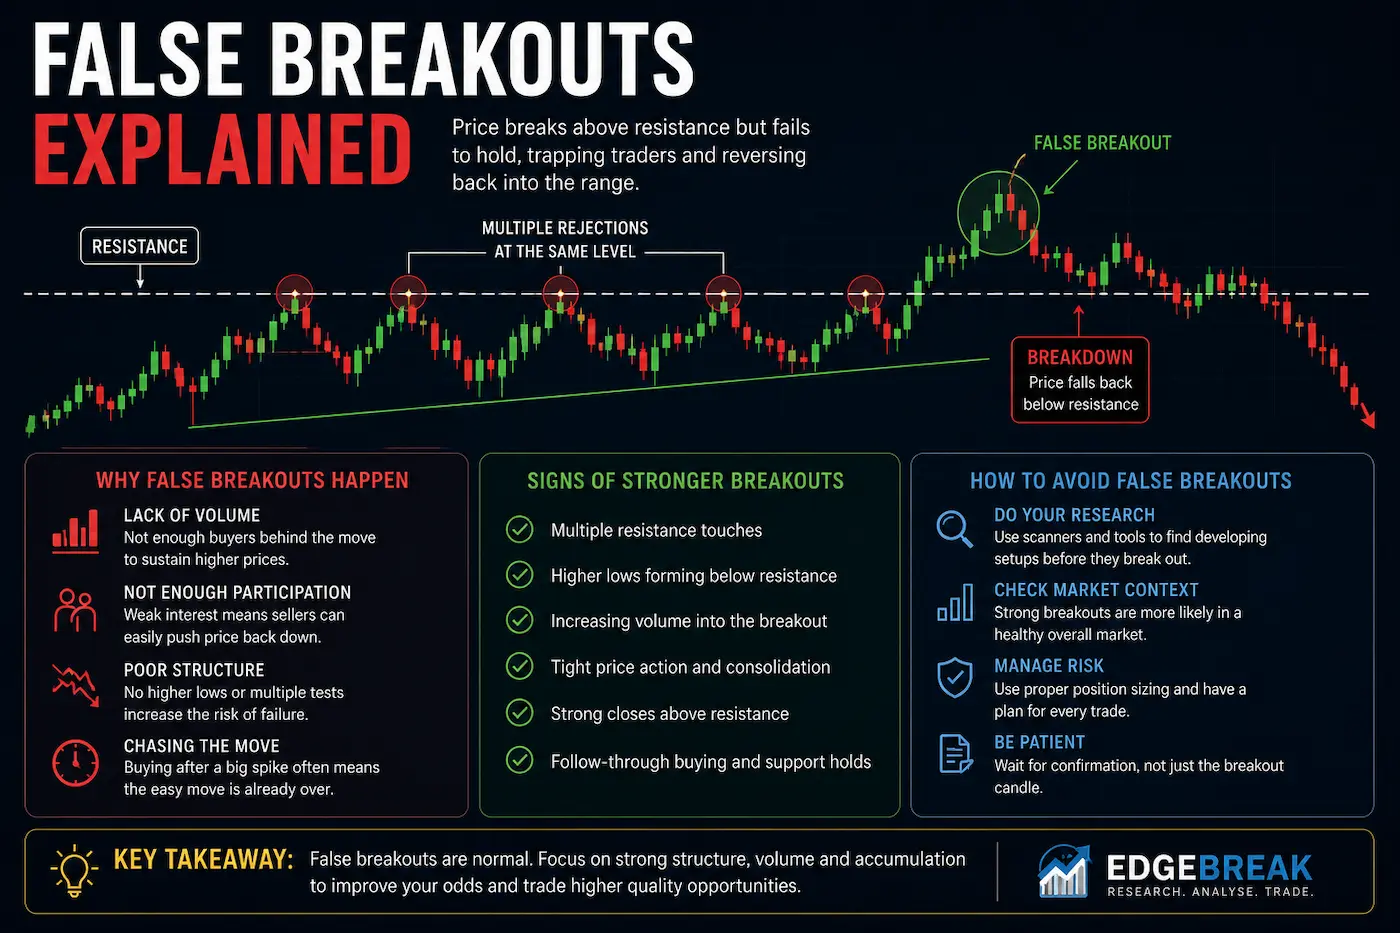
A false breakout occurs when price moves above a recognised resistance area but cannot maintain the move. Instead of establishing itself above the level, the stock falls back into the previous trading range.
Failed breakouts are a normal part of market behaviour. A move through resistance shows what price did at that moment; it does not guarantee that enough demand exists to sustain the move.
Why do false breakouts happen?
Breakouts occur inside a market where buyers and sellers are constantly interacting. If demand is not strong enough to absorb available supply, or if conditions change quickly after the move through resistance, price can reverse back below the breakout level.
This is why the breakout candle should be viewed as one piece of the structure rather than the entire research case.
The importance of market structure
Stronger breakout research usually begins before price reaches the breakout candle. Repeated resistance tests, improving support, higher lows and tighter price action can all provide context around whether the stock is becoming more organised.
These characteristics do not guarantee success. They simply create a stronger technical foundation for investigation than a breakout appearing with little structure behind it.
Do not chase extended moves
A stock can become more difficult to evaluate once it has already moved well above the original resistance area. The further price travels from the base, the less relevant the original structure may become.
Researching stocks earlier in the process can provide better context around where resistance formed, how the base developed and whether the stock is still close enough to that structure to remain useful.
Volume adds context
Volume can help explain how much trading activity is accompanying the move through resistance. Stronger or weaker volume does not decide the outcome on its own, but it can add context when considered alongside the price structure.
The more useful question is not simply whether volume increased, but how that activity relates to the base, the breakout level and the behaviour of price after the move.
False breakouts cannot be eliminated
Even well-structured setups can fail. Markets remain uncertain, and no combination of technical characteristics can remove that uncertainty.
The practical value of studying false breakouts is therefore not to create a perfect filter. It is to improve the quality and consistency of the research process before and after a breakout attempt.
Final thoughts
False breakouts are a normal part of technical markets. A move through resistance can fail even when the setup initially appears constructive.
The strongest use of breakout research is therefore not trying to eliminate every failure, but understanding the quality of the structure around the move.
By examining resistance, higher lows, consolidation, volume, extension and broader context together, investors can build a more disciplined and transparent process for evaluating breakout attempts.