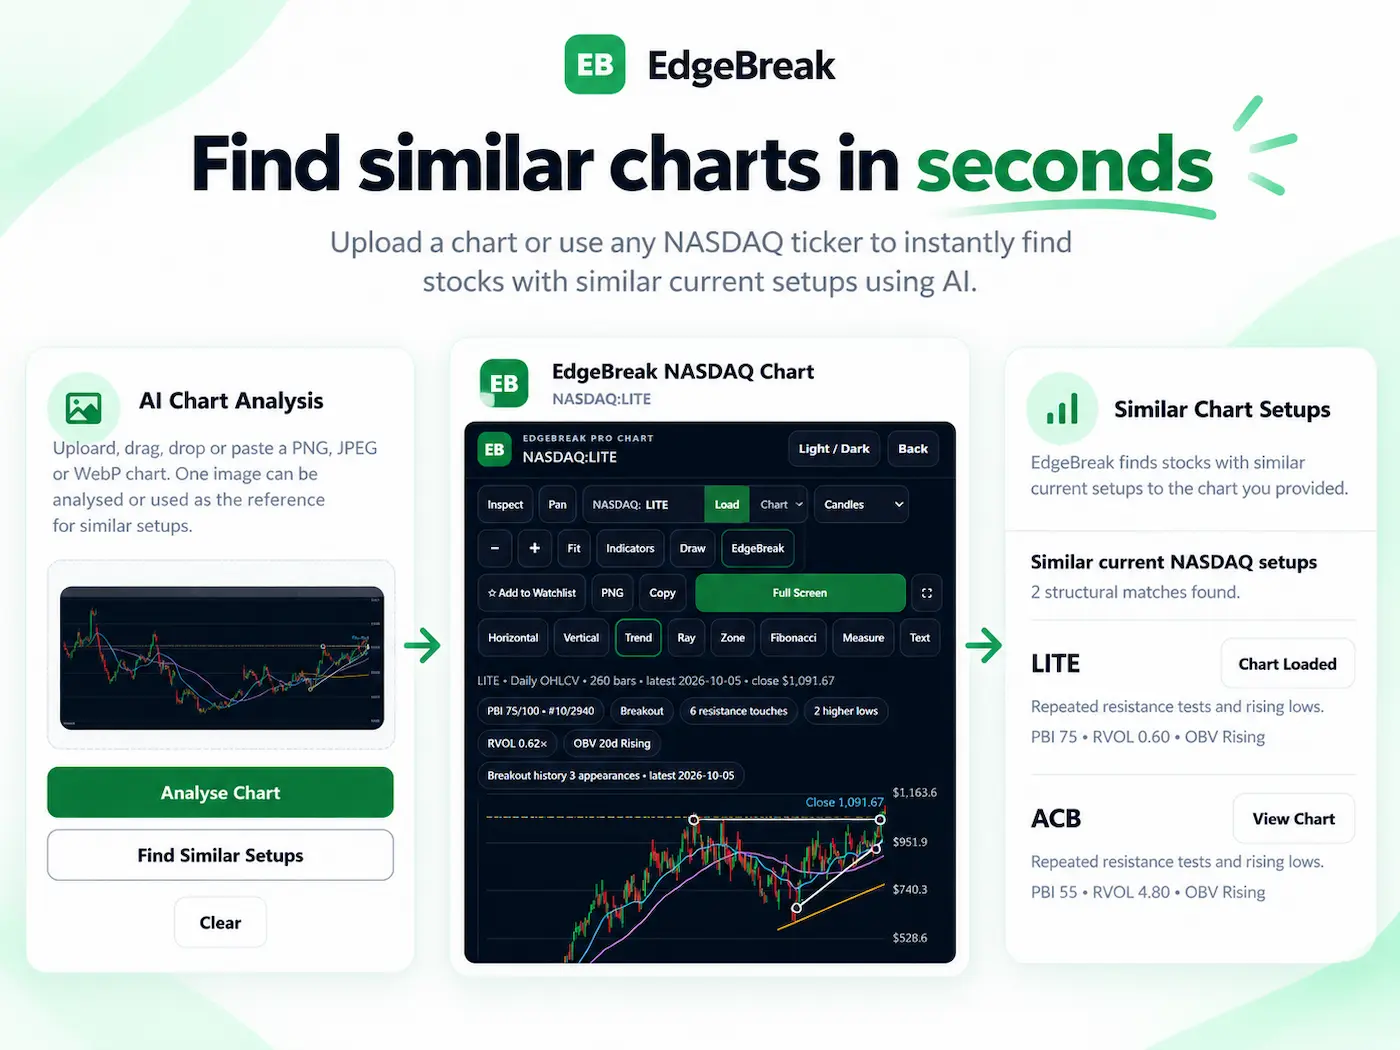
Choose a chart showing the setup you care about, capture enough recent bars to reveal its structure, then use a similar stock chart finder to search for comparable patterns. Review each match's resistance, higher lows, compression, volume and latest data before deciding whether it deserves more research. A high visual match is not a forecast.
What makes two stock charts genuinely similar?
Two lines can rise, flatten and pull back in almost the same way while describing completely different situations. One stock might have spent eight weeks compressing just below repeated resistance. Another might be falling back after an oversized breakout, with resistance now far below its current price. Their shapes resemble each other; their setup stages do not.
For practical chart-pattern searching, distinguish two kinds of resemblance:
- Price-path similarity: The sequence of rises and falls has a similar outline or rhythm. Some tools compare normalized price paths, using time-aligned distances or methods that tolerate timing differences.
- Structural similarity: The charts share relevant features such as repeated resistance tests, a recognizable base, progressively higher lows, range contraction or a comparable relationship to moving averages.
Neither approach is automatically superior. Price-path matching is useful when the shape itself matters. Structure-led search is useful when your research question is more specific: “Find other stocks building beneath resistance, with the same kind of base.” This guide concentrates on the second question.
How to find similar stock charts with EdgeBreak
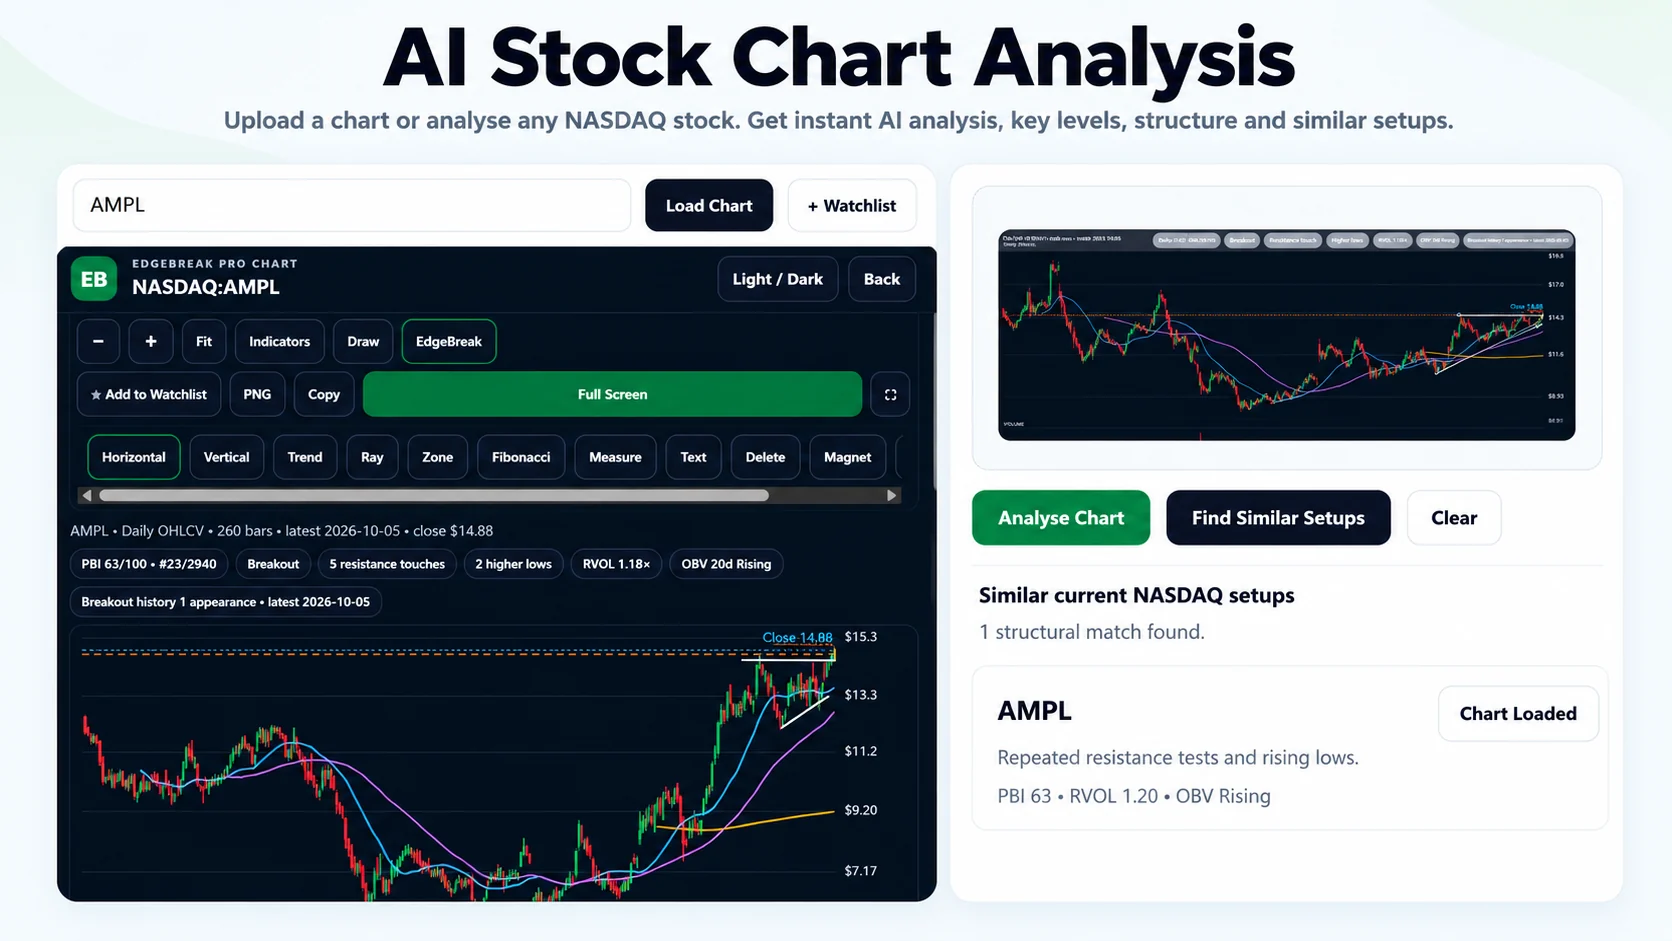
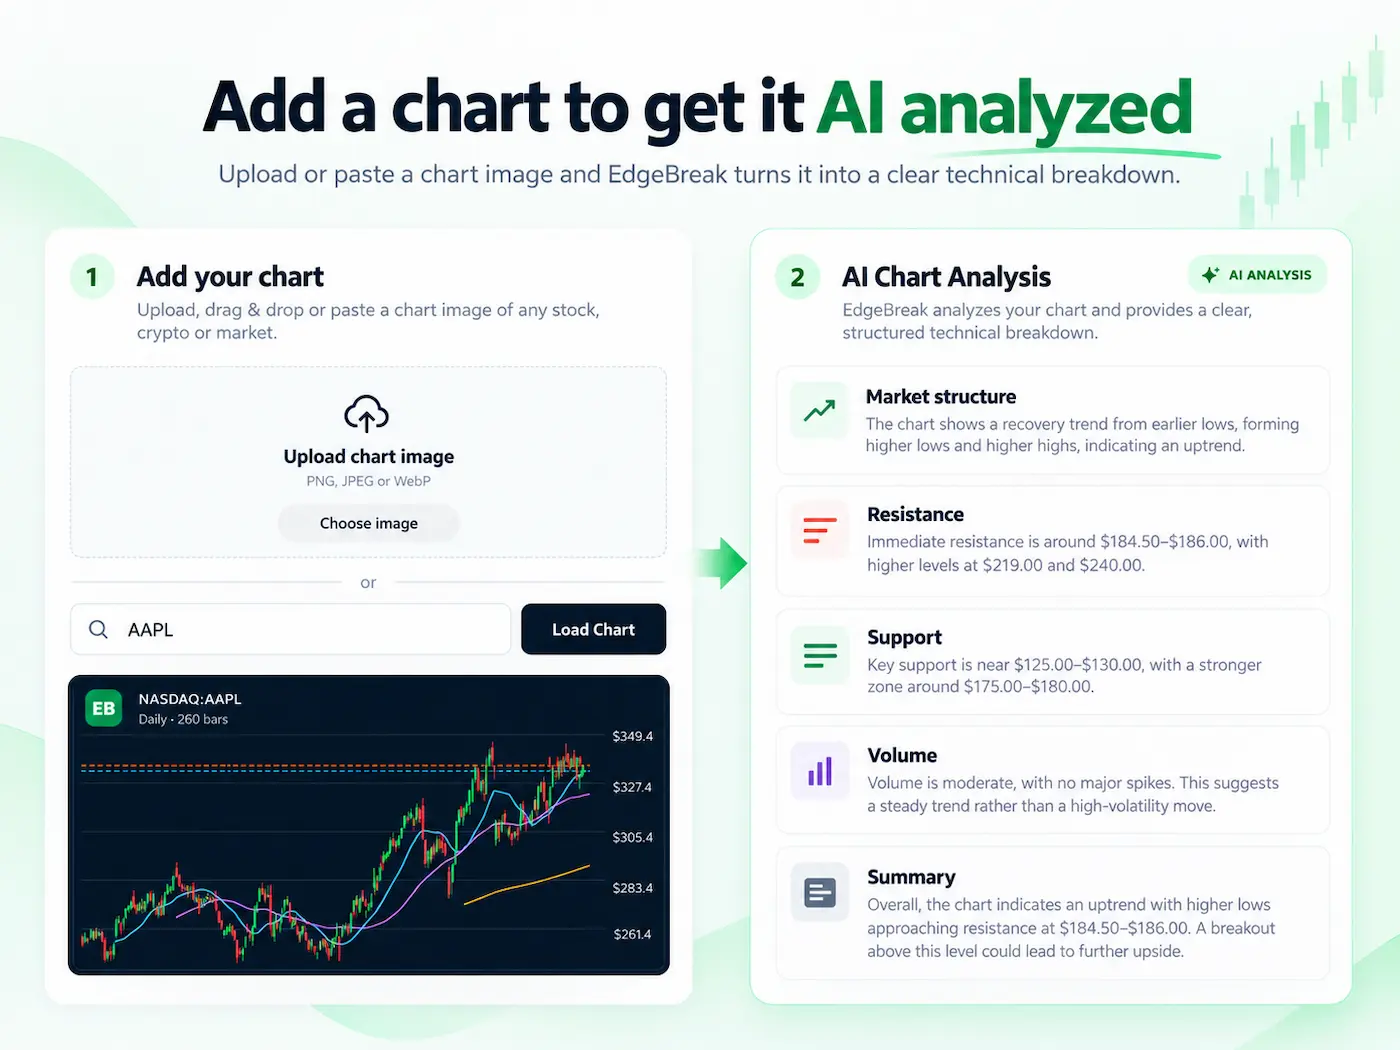
EdgeBreak's public AI Stock Chart Analyzer and Similar Chart Finder accepts a chart screenshot and lets you choose between analysing that image or using it as the reference for a search of available EdgeBreak stock charts. The two actions are separate; select the similarity search when your goal is to find other charts rather than receive a description of the uploaded one.
- Pick a useful reference setup. A daily chart with several weeks of context generally shows more structure than a screenshot of only the last few candles. Be clear about whether you want a tight base, an ascending triangle, a breakout retest or another pattern.
- Capture the chart. Save or copy a clear PNG, JPEG or WebP image. Keep recent candles, visible highs and lows, the price scale where possible, and relevant volume bars. Remove popups that obscure price action.
- Open the live similar-chart finder. Upload, paste or drag your screenshot into the public tool. You do not need to know the ticker shown in your image just to submit the screenshot.
- Choose “Find Similar Setups”. This asks EdgeBreak to use the visible technical structure as a search reference across its supported chart data, rather than simply writing an analysis of the image.
- Inspect matches individually. Open the available EdgeBreak chart for each candidate. Check resistance proximity, base quality, higher lows, volume, and whether the last data bar is current for the expected market session.
- Narrow your research, not your standards. Exclude charts that only match visually but have lost the underlying structure. Use the US Stock Scanner to investigate available technical filters where appropriate.
Analyse Chart describes the uploaded screenshot. Find Similar Setups searches for comparable candidates. If you want “more charts like this one,” use the second button.
Worked example: the same outline, but not the same setup
Imagine the reference image shows a hypothetical stock that has been consolidating beneath a roughly horizontal $40 resistance area for nine weeks. Three successive swing lows are near $34, $35.50 and $37. The most recent close is near $39.25, and trading volume is quieter than during the earlier advance. Your question is not “What will go up next?” It is “Which other charts currently show this kind of rising support beneath a ceiling?”
The following comparisons are illustrative examples, not live EdgeBreak scan results. The different share prices are intentional: a $25 stock and a $200 stock can form related structures without having equal absolute price levels.
| Evidence | Reference | Candidate A | Candidate B |
|---|---|---|---|
| Pattern stage | Base below resistance | Base below resistance | Already extended above former resistance |
| Higher lows | Three successive swing lows | Three comparable higher lows | One sharp rebound, no clear progression |
| Price vs resistance | Roughly 2% below | Roughly 1.5% below | Roughly 14% above its old breakout area |
| Consolidation | Range tightening | Range tightening | Wide, volatile candles |
| Research interpretation | Reference structure | Worth comparing further | Similar silhouette, different stage |
Candidate A is the closer structural comparison even if Candidate B's line happens to look more like the reference image. That distinction matters when studying early bases and pre-breakouts. A resemblance score should help sort a research list, not replace an examination of what the chart is actually doing.
Which chart patterns are worth searching for?
You do not need to commit to a formal pattern name before starting. But identifying the features you care about makes it easier to separate useful results from lookalikes.
- Ascending triangle: Examine repeated tests near a resistance zone while swing lows rise toward that level. Check whether the higher lows are meaningful rather than normal daily noise. See the ascending triangle research guide.
- Tight base: Look for an organized trading range with less variation in price. The base should still be intact rather than already left behind. See tight-base setups.
- Resistance compression: Compare how price and range behave as the chart approaches a resistance area, not simply how many candles appear near the same horizontal line. See resistance compression.
- Bull flag: Study a prior advance and the character of the subsequent consolidation. A brief retracement following a move is not automatically a healthy flag. See the bull-flag research guide.
- Support bounce: Look at repeated interaction with a support zone and the strength of the reaction. One isolated up-day is not the same as a tested area of support. See support-bounce research.
Five checks that improve a similar-chart shortlist
Finding candidates is the beginning of the research. Before treating a match as useful, compare the evidence behind the resemblance:
- Resistance: Is the relevant ceiling still ahead of price, or has the stock already moved far beyond it? Are resistance tests distinct attempts or repeated candles from the same event?
- Higher lows: Are swing lows improving over several meaningful reactions? Zoom out to ensure an apparent trend is not created by an unusually short screenshot.
- Compression: Has the base become tighter, or is it widening and becoming unstable? Look at the range of multiple candles rather than a single quiet day.
- Volume and participation: Where available, consider RVOL and OBV next to the price structure. Rising OBV, quiet consolidation and abnormal volume are different contexts; none proves institutional buying or future price direction.
- Freshness and invalidation: Check the date of the final candle. Mark what would make the proposed structural comparison wrong: a broken support area, a failed retest or a move that has already invalidated the base.
EdgeBreak may also show its proprietary Pressure Building Index (PBI) alongside chart and scanner context. PBI is an additional research measure, not the probability that a stock will break out. Comparing structural evidence first helps avoid treating any proprietary score as a shortcut.
What similar-chart finders can miss
No chart-matching algorithm can tell you that two different businesses, market regimes or risk profiles will produce the same outcome. Similarity is especially easy to overstate when a screenshot shows too little history, uses an unusual scale or was captured before a sharp change in market conditions.
- Different timeframes: A five-minute pattern and a three-month daily base may look alike but imply very different contexts. Confirm the original chart's timeframe.
- Crop and overlays: An image focused on only a few candles or covered by annotations may hide the pattern's actual structure. If matches seem poor, use a clearer screenshot.
- Stale data: A stock that looked like a qualifying base several sessions ago may now be beyond resistance or may have broken support. Reopen the latest chart.
- False positives: Candidate charts can have similar silhouettes while differing in volume, volatility, liquidity, trend history or corporate events.
- Universe limits: Results depend on which stocks and chart histories the service currently supports. A search across available US stock charts is not a search of every worldwide market or asset class.
- No prediction: Similar patterns do not establish likely returns, a success rate or an appropriate entry/exit. Research decisions still require independent verification and risk judgment.
For a checklist focused on the most common data problems after a scan, see how to verify stock chart data and scanner results.
Visual chart matching versus structure-based searching
Different platforms answer different questions. A normalized price-path comparison can rank similar sequences, and techniques such as Euclidean distance or dynamic time warping can treat timing differently. Some products also allow the user to select an exact region, search ETFs or search for inverse patterns. Those capabilities are tool-specific; do not assume every service offers them.
EdgeBreak's similar-chart experience begins with a chart screenshot and uses the visible technical structure as research context for its supported stock-chart universe. Available scanner indicators can help refine what looks interesting. It does not promise a pixel-perfect overlay or that a selected region, an ETF universe or inverse matching is available in the same way as on another product.
The useful question is what you need to compare: the shape and timing of a move, or the setup conditions behind that shape. Try real reference charts before relying on any similarity result.
Frequently asked questions about finding similar charts
Can I find similar stock charts using a screenshot?
Yes. EdgeBreak supports PNG, JPEG and WebP chart images through its Chart Analyzer. Upload a readable chart, select Find Similar Setups, and review the qualifying candidates in the supported stock universe.
Do I need to know the stock ticker in the screenshot?
No ticker is needed to upload a chart screenshot for structural analysis or similarity searching. The search candidates themselves are identified by available ticker data.
Is finding similar patterns the same as predicting a breakout?
No. A similar structure is a research clue, not an estimate of return or a guarantee that another stock will behave the same way.
Can I find similar breakouts, pre-breakouts and bases?
You can use a breakout, developing base or other clear pattern as a reference. The result quality depends on the visible chart evidence and available market data; inspect each match's current setup stage.
Does the tool search every global stock and ETF?
No. EdgeBreak matches against its supported stock-chart universe. Check the live product page for currently supported exchanges and availability. Do not assume inverse matching or ETF-only searching is provided.
Can I try a similar-chart search for free?
The public Chart Analyzer currently offers a limited free similarity search separately from its free chart analysis allowance. Additional use depends on the current membership and trial terms shown on the site.
Search for a chart like yours
Start with a screenshot of the setup you want to investigate. Use the actual EdgeBreak finder to search for comparable structures, then inspect the matches on current charts. No scanner formula or ticker is needed to submit your image.
Try Find Similar Setups Free →Want to refine stock research inside ChatGPT? Explore EdgeBreak for ChatGPT and check current plugin availability.
Educational information only, not financial advice. AI-generated chart observations and market feeds can be inaccurate, incomplete or delayed. Pattern resemblance and past price movement do not predict future performance.