Resistance tests
Look for repeated interaction with a level that has mattered more than once.
Resistance compression develops when price repeatedly approaches an important level while the structure underneath becomes tighter or steps upward. EdgeBreak helps you find the ingredients and then inspect the chart.
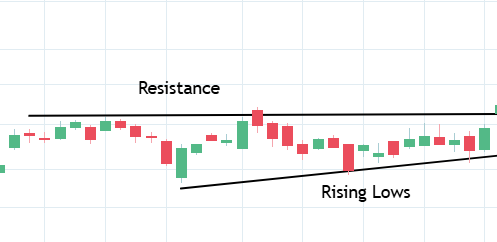
Resistance compression describes a structure where price continues to interact with a resistance area while the range underneath becomes tighter. It can include rising swing lows, repeated but distinct tests and less room between current price and the level above.
The idea is structural rather than predictive. Compression shows that price is organising around a level; it does not tell you whether the eventual resolution will be a successful breakout.
When a stock repeatedly returns to resistance without losing its underlying structure, it can be useful to compare how the lows, support, range width and trading activity are evolving. A tightening setup is easier to study when those features are viewed together.
A compression can still fail. Price can remain range-bound, lose its higher-low sequence, break support or briefly move through resistance and reverse.
EdgeBreak surfaces the structural fields that help explain whether price is genuinely tightening around an important level.
Look for repeated interaction with a level that has mattered more than once.
See whether pullbacks are being supported at progressively higher prices.
Measure how close price currently sits to the identified resistance area.
Inspect whether the range is becoming more organised rather than increasingly volatile.
Add participation and volume-flow context to the price structure.
Confirm visually whether the resistance and rising lows form a coherent structure.
A stock near resistance is not automatically compressing. A stock with higher lows is not automatically compressing either. The useful pattern comes from the relationship between the level above, the rising or stable support underneath and the narrowing behaviour between them.
Research the pieces with Stocks Near Resistance, Stocks With Higher Lows, the Pre-Breakout Scanner and the Breakout Scanner.
The structure can break resistance, remain range-bound, lose support or fail after a brief move through the level. Use compression as descriptive technical evidence only.
Use the characteristic as a filter, then keep the research connected through the EdgeBreak workflow.
It is a technical structure where price repeatedly approaches a resistance area while the range underneath becomes tighter, often with rising or stable swing lows.
No. A compressed structure can break resistance, remain range-bound, lose support or fail after a brief breakout.
They can be. Rising swing lows can reduce the space beneath resistance, but the full structure should still be inspected on the chart.
EdgeBreak can combine resistance, higher lows, distance to resistance, volume context, scanner state and first-party chart review in one research workflow.
Use EdgeBreak to research tightening price action near resistance before deciding which charts deserve deeper investigation.