Resistance
Compare the higher-low sequence with the level price is repeatedly approaching.
Higher lows can show that buyers are supporting price at progressively higher levels. EdgeBreak helps you find and research those structures alongside resistance, volume context and the actual chart.
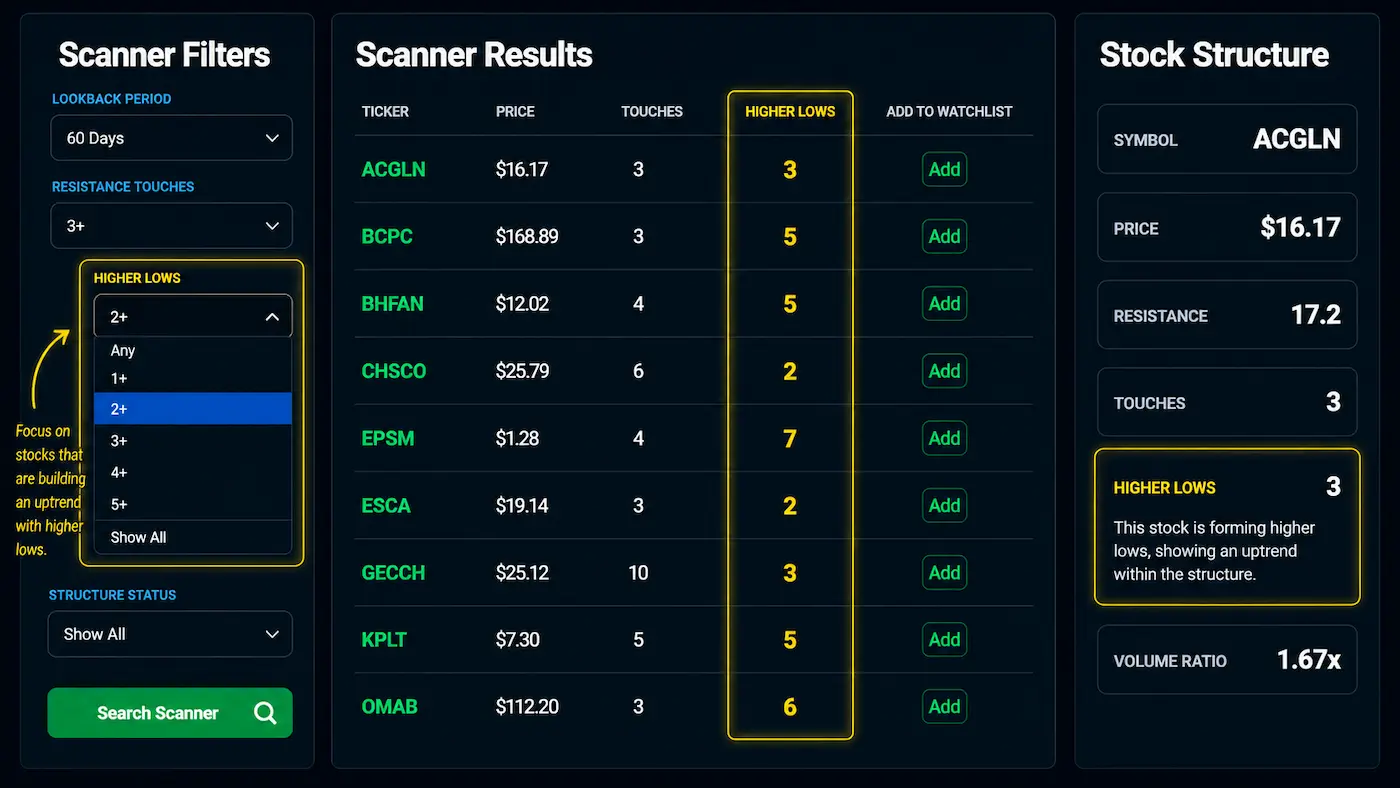
A higher low forms when a pullback holds above a previous meaningful low. A sequence of higher lows can show that the structure is improving because price is being supported at progressively higher levels.
One higher low is not enough to define a complete setup. The usefulness comes from seeing the sequence in context: how price behaves around resistance, whether support remains intact, how tight the range becomes and whether participation supports the move.
Multiple higher lows can help narrow a large market to stocks with organised upward structure. They can be especially useful when price is also approaching an established resistance area rather than moving without a clear reference level.
Higher lows do not prove that resistance will break. A structure can flatten, reverse or lose support. EdgeBreak treats the pattern as research evidence, not a prediction.
EdgeBreak can surface higher-low information with the technical fields that help explain whether the structure is organised or incomplete.
Compare the higher-low sequence with the level price is repeatedly approaching.
See whether the stock is still developing below resistance or already extended away from it.
Use available participation and volume context alongside the price structure.
Review the published Pressure Building Index where it is available without treating it as a trade signal.
See whether the stock currently appears in a focused EdgeBreak scanner or the wider Master Scanner.
Inspect the actual swing structure rather than relying on the higher-low count alone.
A stock can form higher lows in many places on a chart. The structure becomes more informative when those lows develop underneath a clear resistance area, during a tightening range or inside a broader organised base.
That is why EdgeBreak connects higher lows with stocks near resistance, resistance compression and the Pre-Breakout Scanner rather than presenting a higher-low count as a standalone conclusion.
A stock can keep forming higher lows and still fail at resistance, lose support or reverse. Use the structure as a starting point for independent research and chart review.
Use the characteristic as a filter, then keep the research connected through the EdgeBreak workflow.
A higher low occurs when a meaningful pullback holds above a prior meaningful low. Several higher lows can form an upward-stepping structure.
No. Higher lows can be constructive context, but the stock can still fail at resistance, lose support or reverse.
EdgeBreak publishes higher-low structure information where available and lets users research it with resistance, scanner state, volume context and charts.
Yes. The relationship between rising swing lows and an established resistance area can provide more useful structural context than either feature alone.
Use EdgeBreak to narrow the NASDAQ, compare higher-low structures and continue into resistance, participation and chart research.