Support & Resistance
Support and resistance are two of the most important concepts in technical analysis and form the foundation of EdgeBreak's breakout research methodology. Understanding where buyers and sellers have historically entered the market helps investors identify important price levels and organise their research more effectively.
What You'll Learn
- What support and resistance are.
- Why price reacts around these levels.
- How resistance develops.
- Why repeated resistance tests matter.
- How support and resistance fit into breakout research.
What Is Support?
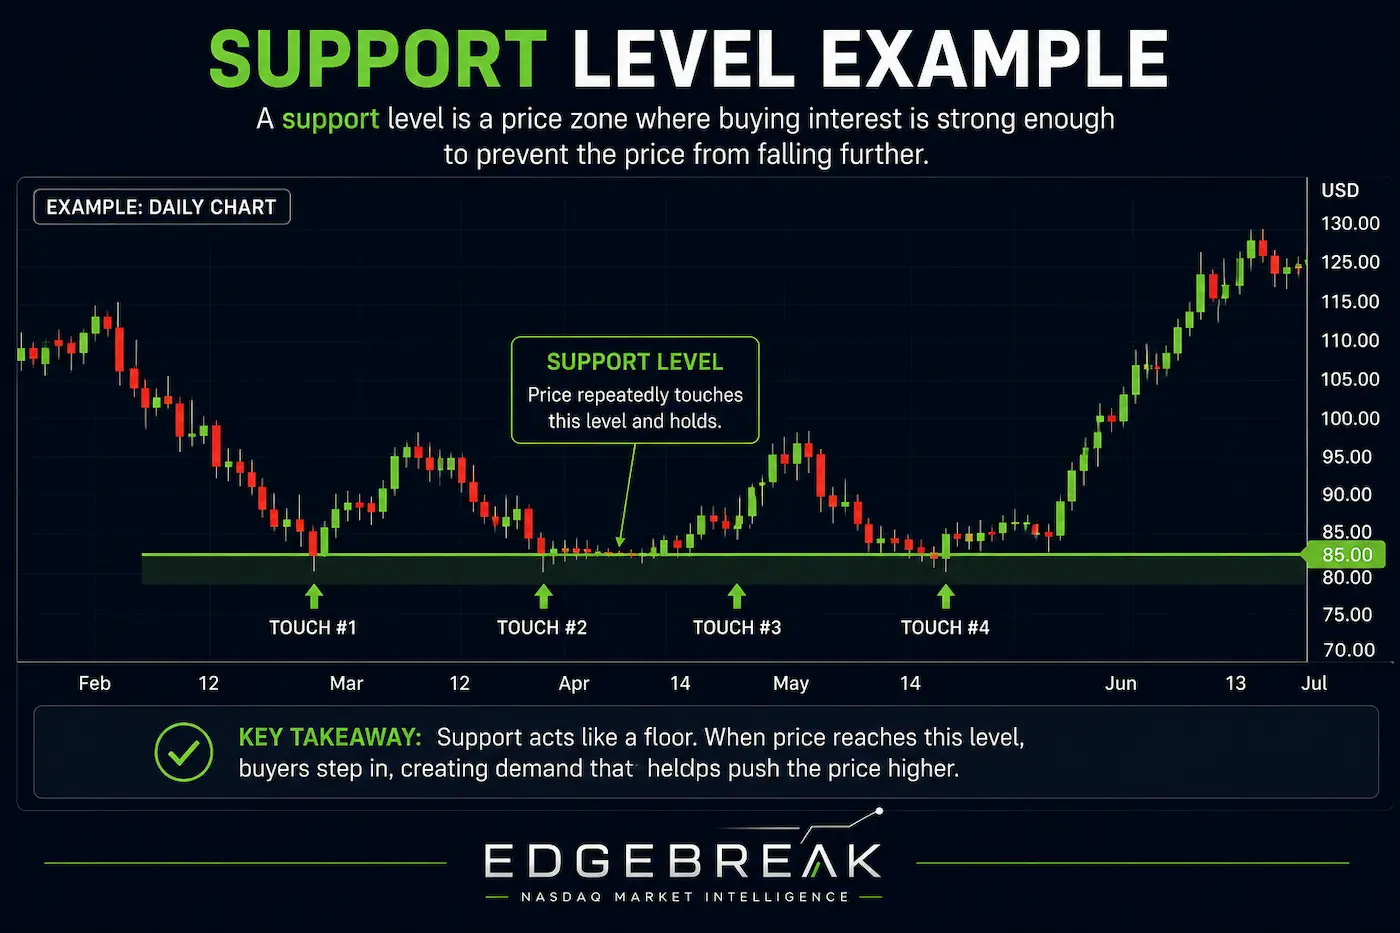
Support is a price area where buyers have historically shown enough demand to slow or temporarily stop a decline. When price reaches support, buying activity often increases as investors view the stock as offering value at that level.
Support does not guarantee that price will move higher. Instead, it represents an area where buyers have previously entered the market in sufficient numbers to influence price behaviour.
What Is Resistance?
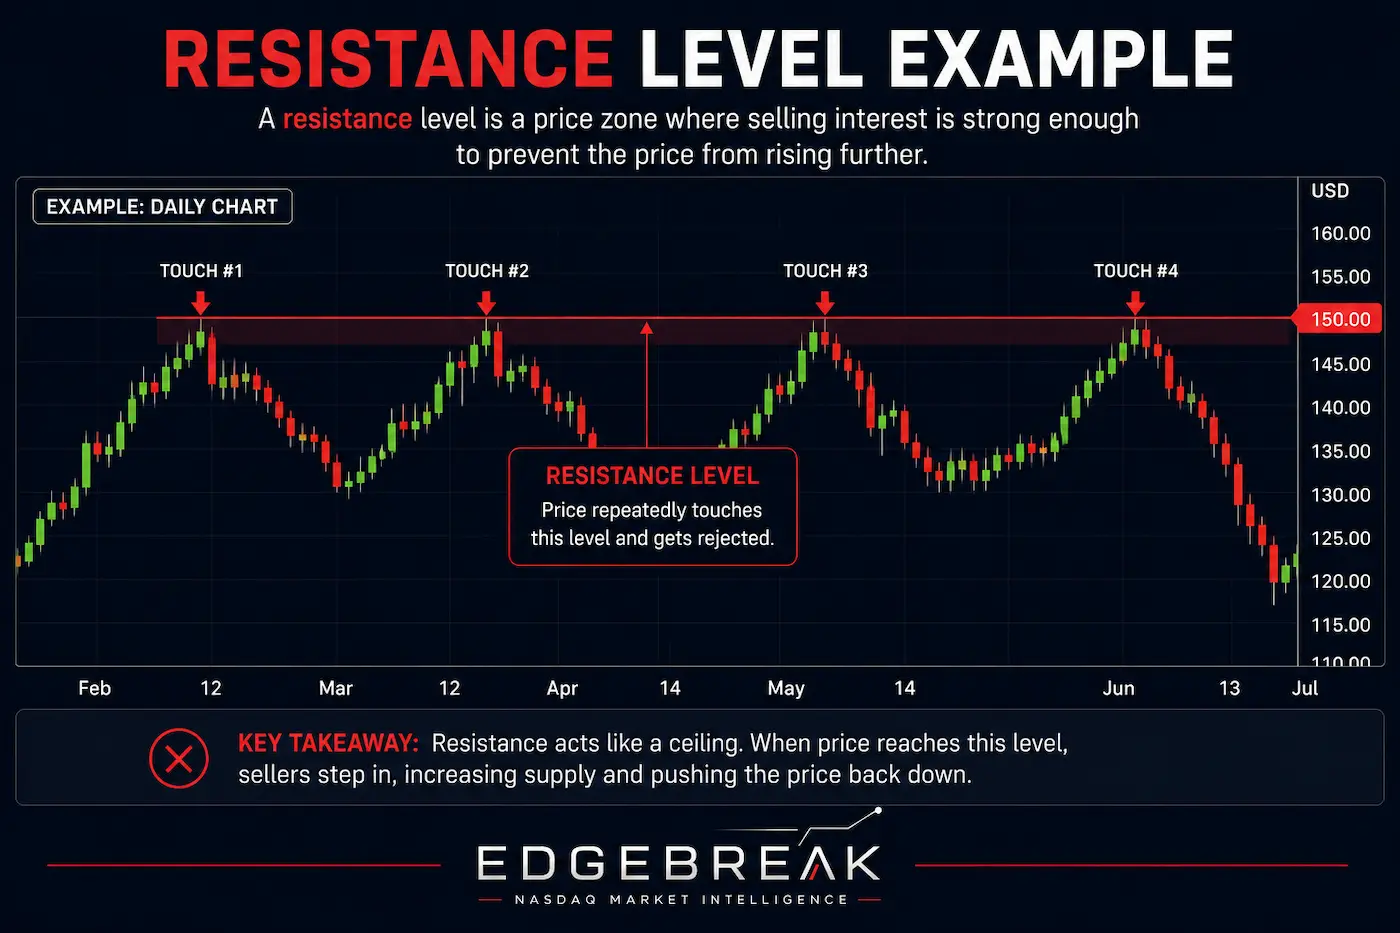
Resistance is the opposite of support. It represents an area where selling pressure has repeatedly prevented price from moving higher.
As a stock approaches resistance, some investors may choose to sell, while others wait to see whether buyers have enough strength to overcome that selling pressure.
Resistance is one of the key concepts used throughout the EdgeBreak platform because every breakout begins by moving above a previously established resistance level.
Why Does Resistance Form?
Resistance often develops because large numbers of market participants are willing to sell at similar prices. This selling pressure may come from investors taking profits, traders exiting losing positions or institutions managing larger portfolios.
Over time, repeated selling at the same level creates a price area that the market begins to recognise as resistance.
The more often price reacts around the same level, the more attention that area typically receives from market participants.
Why Multiple Resistance Tests Matter
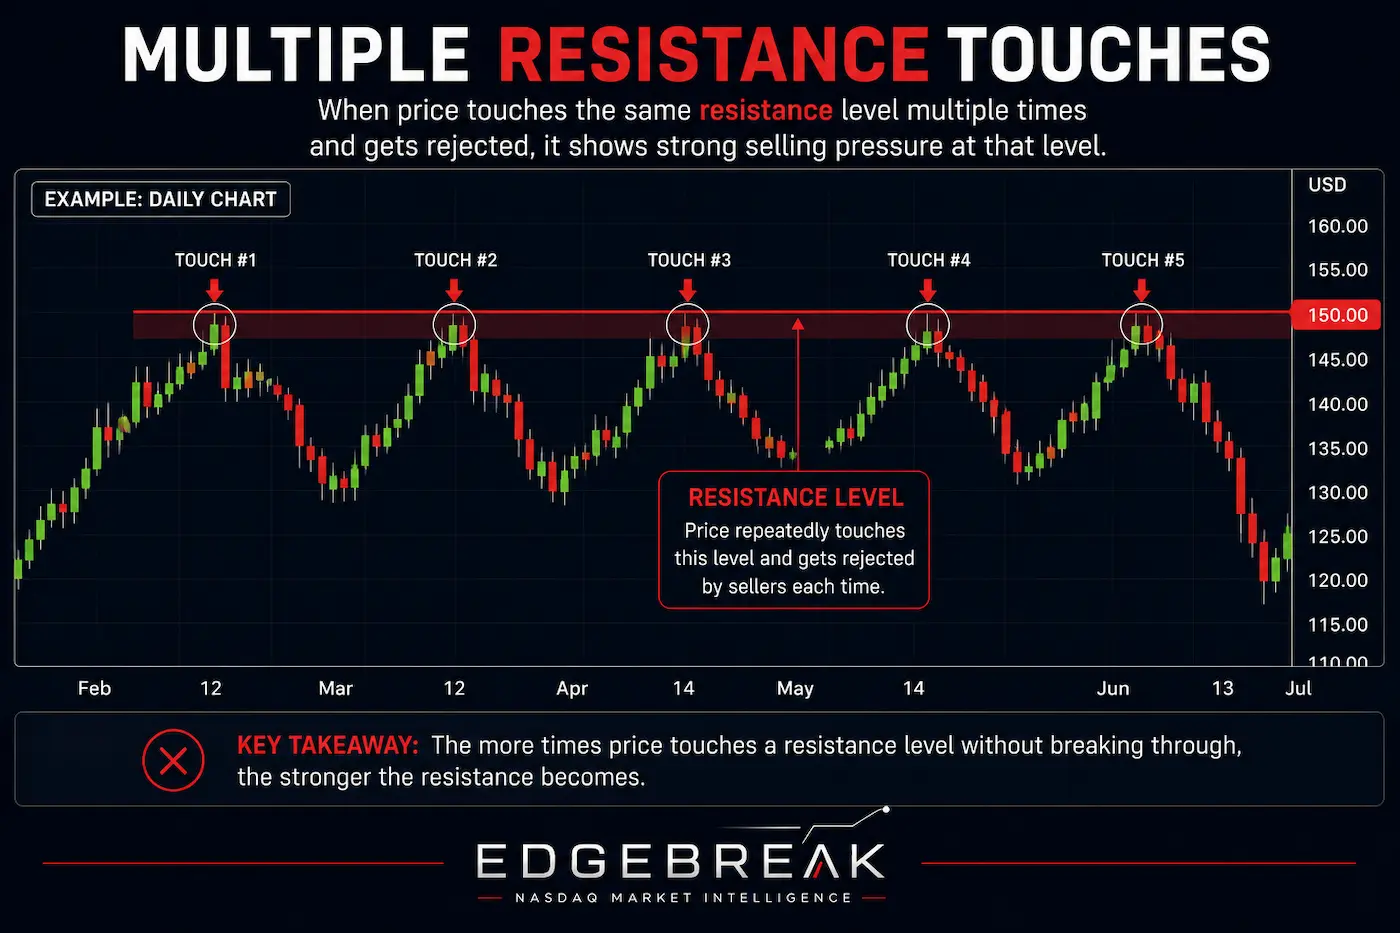
One rejection at resistance provides limited information. However, repeated tests of the same resistance level often indicate that buyers continue returning despite previous setbacks.
Rather than viewing repeated tests as weakness, many investors see them as evidence that buying pressure remains persistent.
Eventually, if buying demand becomes greater than available selling pressure, price may move above resistance.
This concept forms one of the foundations of the EdgeBreak NASDAQ Scanner.
Support and Resistance Are Zones
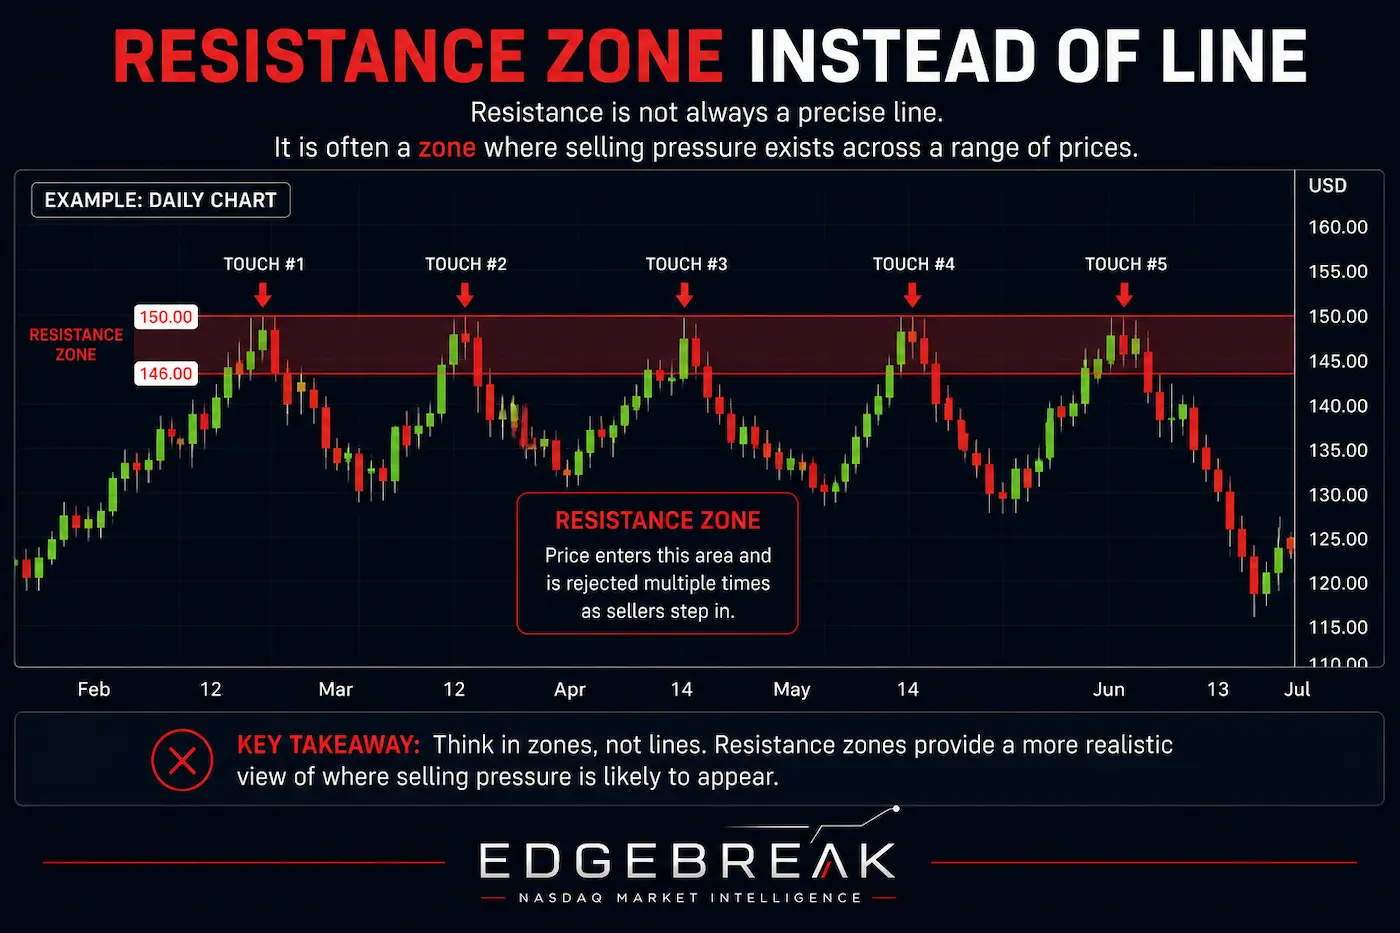
Beginners often draw support and resistance as exact horizontal lines. In reality, these areas are usually better viewed as price zones rather than precise numbers.
Small movements above or below support and resistance occur regularly and should always be interpreted within the context of overall market structure.
Role Reversal
One interesting feature of technical analysis is that resistance can sometimes become support after a successful breakout.
Once buyers establish themselves above resistance, the same price level may attract new buying interest during future pullbacks.
Likewise, broken support can sometimes become new resistance during downtrends.
Understanding this concept helps investors better interpret changing market conditions.
Support & Resistance Inside EdgeBreak
Resistance is one of the primary research characteristics used throughout the EdgeBreak platform.
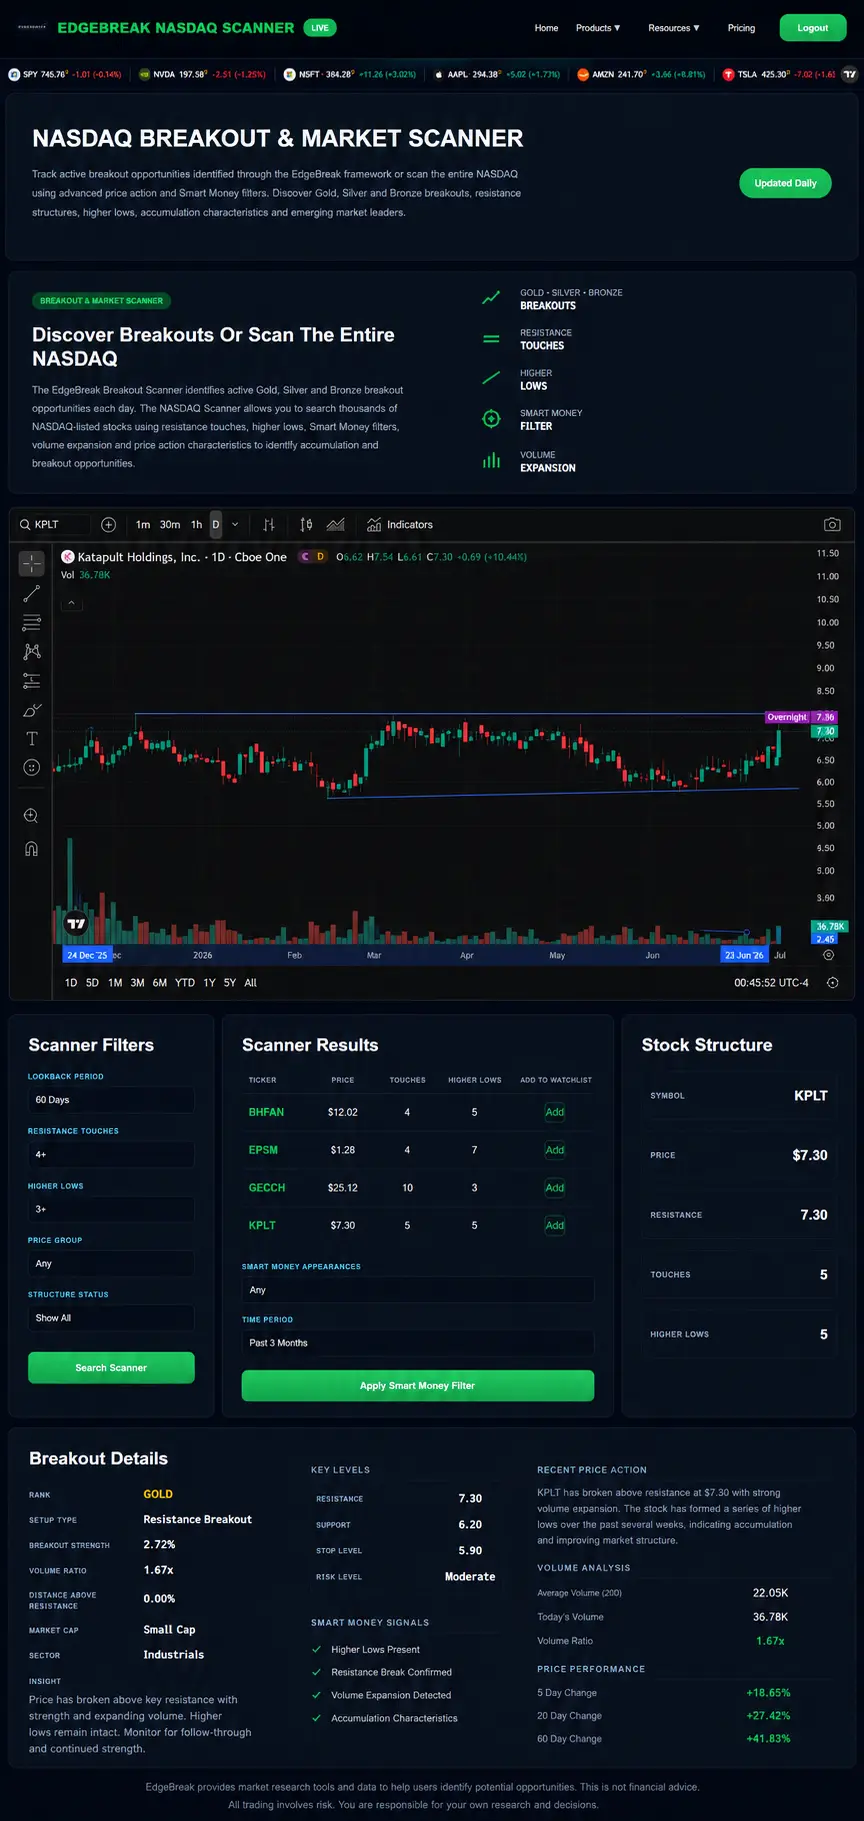
The NASDAQ Scanner identifies stocks displaying repeated resistance touches before a breakout occurs, while the Breakout Scanner highlights stocks that have already moved above resistance according to the EdgeBreak breakout model.
Rather than relying on resistance alone, EdgeBreak combines resistance analysis with higher lows, market structure, volume behaviour and Smart Money characteristics to support a more complete research process.
Lesson Summary
Support and resistance provide important reference points for understanding market behaviour. While no level guarantees future price movement, repeated resistance testing, improving market structure and increasing buying pressure often form the basis of many breakout research strategies. Understanding these concepts is essential before progressing to more advanced lessons.
Key Takeaways
- Support is where buyers have historically entered the market.
- Resistance is where selling pressure has repeatedly appeared.
- Repeated resistance tests often attract increased market attention.
- Support and resistance should be viewed as zones rather than exact prices.
- EdgeBreak uses resistance as one of the foundations of its research methodology.
Common Beginner Mistakes
- Drawing support and resistance as exact lines instead of price zones.
- Assuming every resistance break will become a successful breakout.
- Ignoring overall market structure.
- Relying only on support and resistance without considering volume or higher lows.
- Forcing support and resistance levels where none clearly exist.
Research Reminder
Support and resistance provide useful context for market research but should never be interpreted as guarantees of future price direction. EdgeBreak combines these concepts with other market characteristics to support structured research and does not provide financial advice or investment recommendations.
Continue Your Journey
Lesson 2.3 – Reading Volume
Learn why trading volume matters, how it helps explain buying and selling pressure, and why volume plays an important role when researching potential breakout opportunities.