Understanding Volume
Price tells us what happened. Volume helps explain how much participation was behind that move. Understanding volume is one of the foundations of breakout research because it provides additional context about buyer and seller activity. While volume alone never predicts future price movement, it can help investors better understand the strength behind developing market structures.
What You'll Learn
- What trading volume represents.
- Why volume matters during breakouts.
- The difference between normal and increasing volume.
- What volume dry-up means.
- How EdgeBreak uses volume in market research.
What Is Trading Volume?
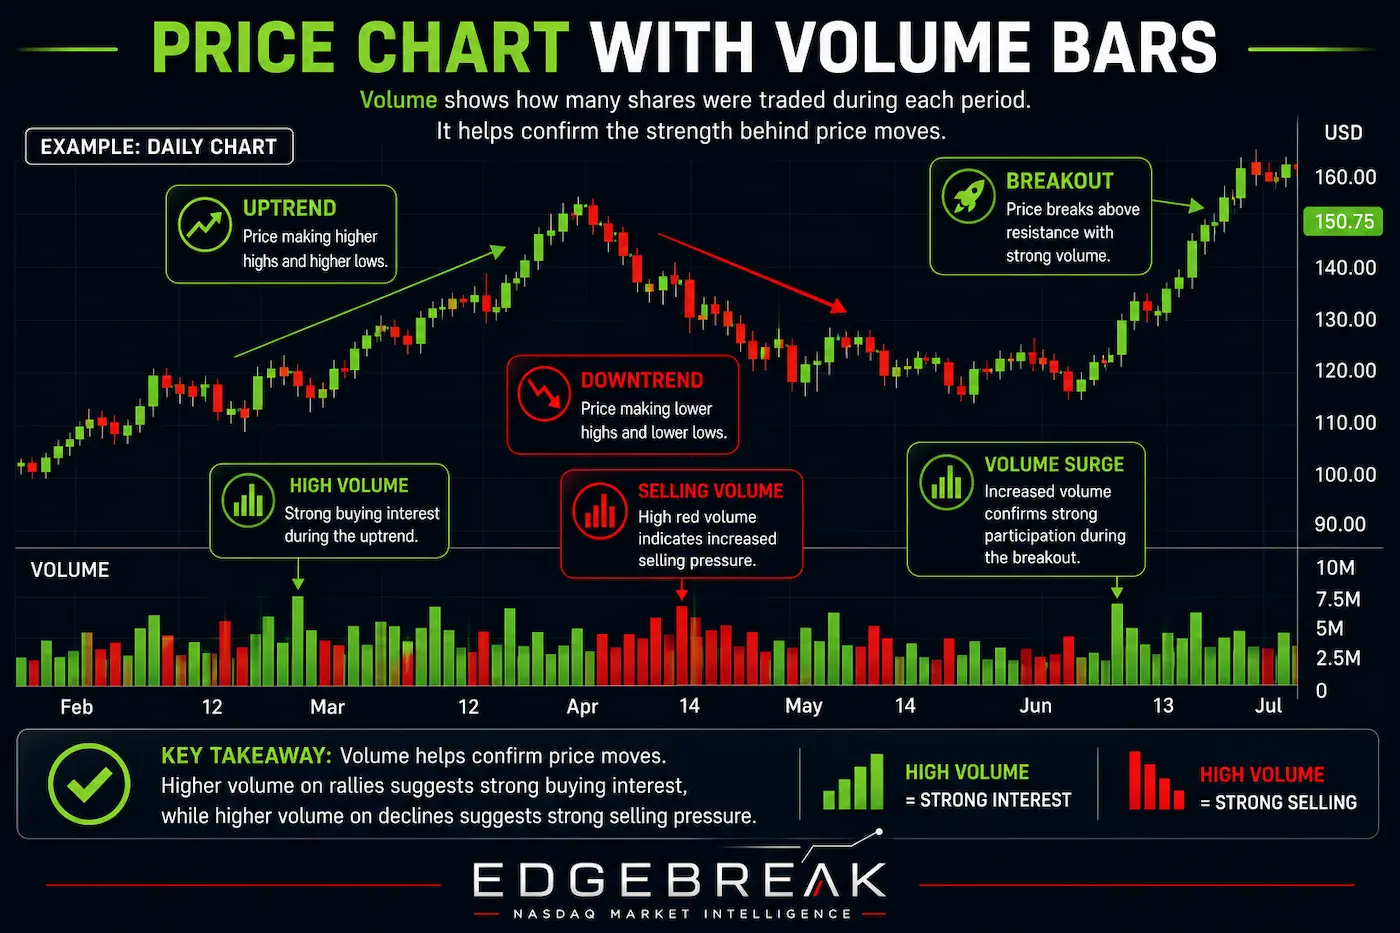
Trading volume measures the number of shares exchanged during a specific period of time. Every transaction requires both a buyer and a seller, making volume a useful measure of market participation.
On a daily chart, volume shows how many shares changed hands during that trading day. Higher volume generally indicates increased market activity, while lower volume suggests fewer participants are actively buying or selling.
Why Volume Matters
Price movements supported by strong participation are often viewed differently from price movements occurring on very low volume.
For example, if a stock breaks above resistance while trading volume increases significantly, it may suggest greater market interest than a breakout occurring with little participation.
Volume does not confirm whether a breakout will succeed, but it provides valuable context that many investors include within their research process.
Normal Volume vs Increasing Volume
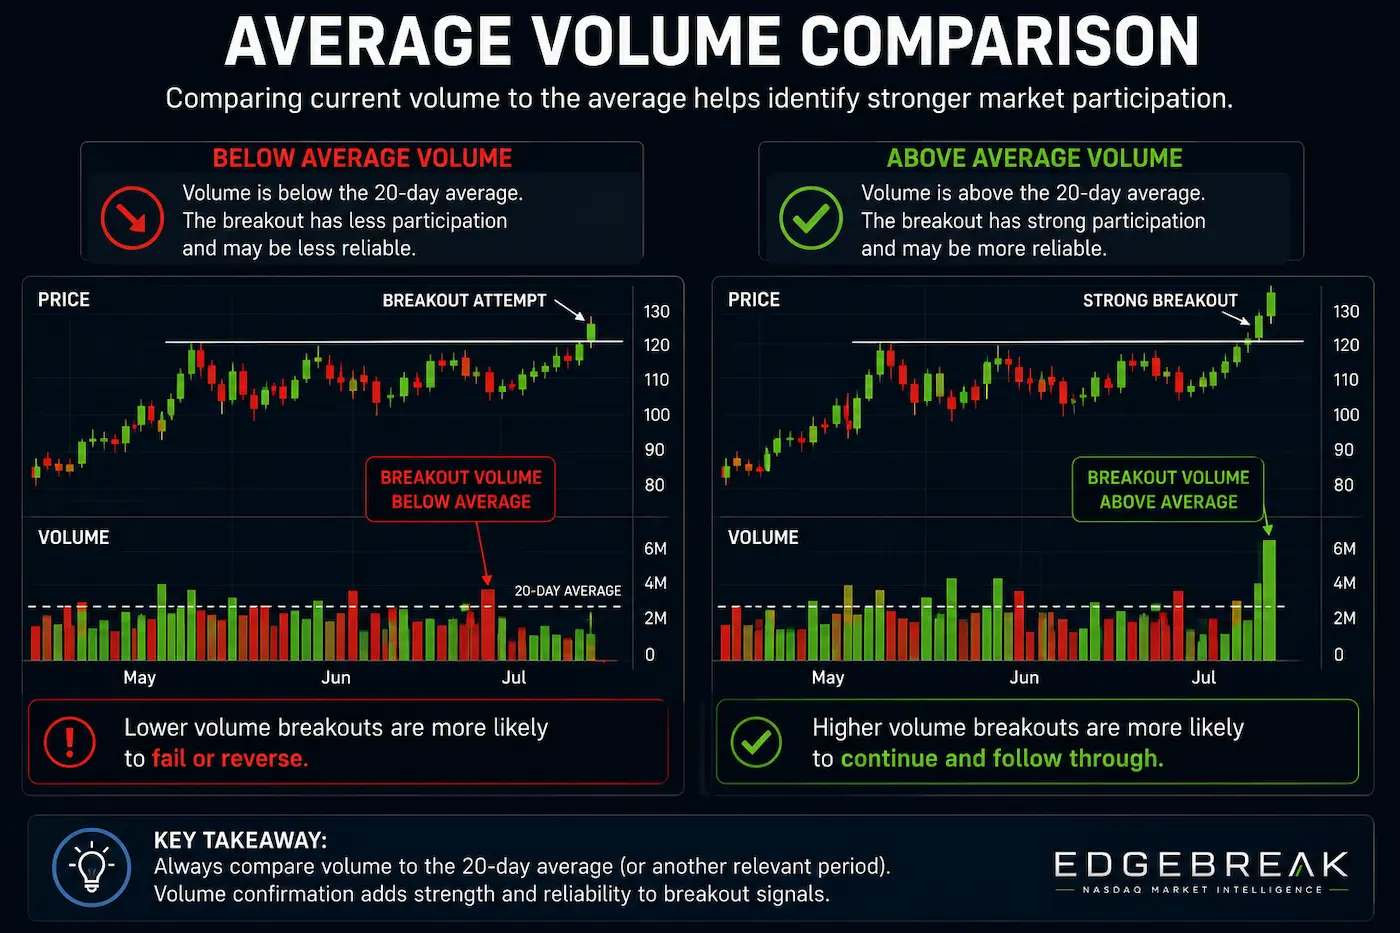
Every stock has its own normal trading activity. Some large companies trade millions of shares every day, while smaller companies may trade much lower volumes.
Rather than comparing one company to another, investors often compare today's volume with the stock's own recent trading history.
An increase above normal daily volume may indicate growing interest from market participants.
Volume During Consolidation
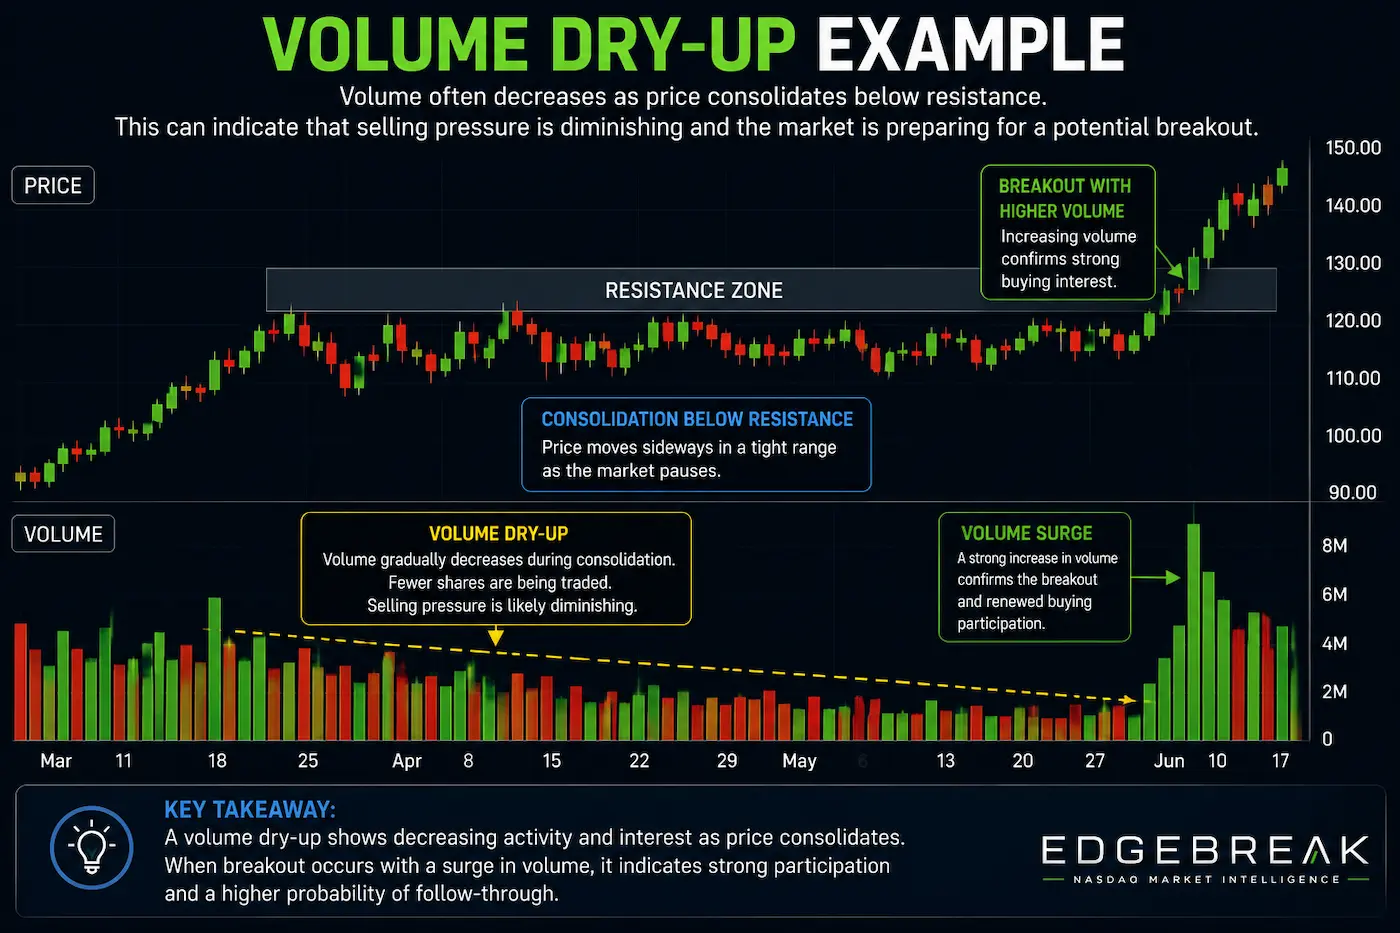
One characteristic often observed before some breakout opportunities is decreasing trading activity during periods of consolidation.
As price trades within a relatively tight range, daily volume may gradually decline while buyers and sellers establish a temporary balance.
This concept is commonly referred to as a volume dry-up.
A volume dry-up does not predict a breakout, but it can indicate that selling pressure has become less aggressive while investors continue monitoring the stock.
Volume Expansion
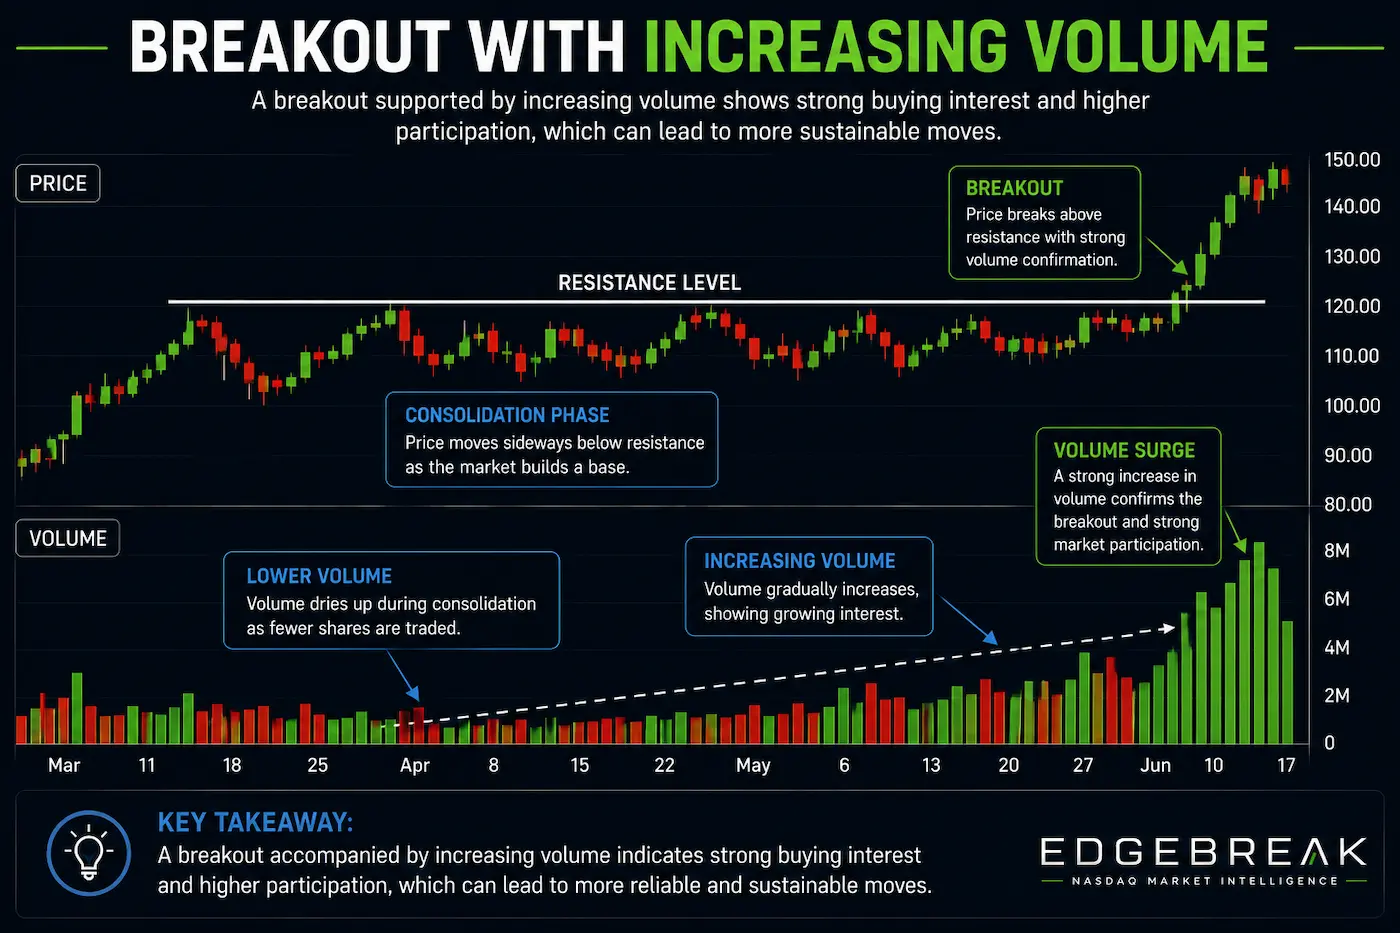
Following periods of quiet trading, some stocks experience noticeable increases in trading activity as price begins moving higher.
Increased participation during a breakout may indicate growing market interest and is one characteristic frequently researched alongside resistance levels and improving market structure.
Again, higher volume never guarantees success, but it often provides additional information that supports broader technical analysis.
Volume Is Only One Piece of the Puzzle
One of the biggest mistakes beginners make is assuming volume alone determines whether a stock is a good research candidate.
Strong breakout research combines multiple characteristics, including:
- Market Structure
- Resistance Levels
- Higher Lows
- Accumulation Characteristics
- Trading Volume
- Overall Market Conditions
Looking at these factors together provides a much more balanced understanding of price behaviour.
How EdgeBreak Uses Volume
EdgeBreak incorporates volume into several areas of the platform to provide additional research context.
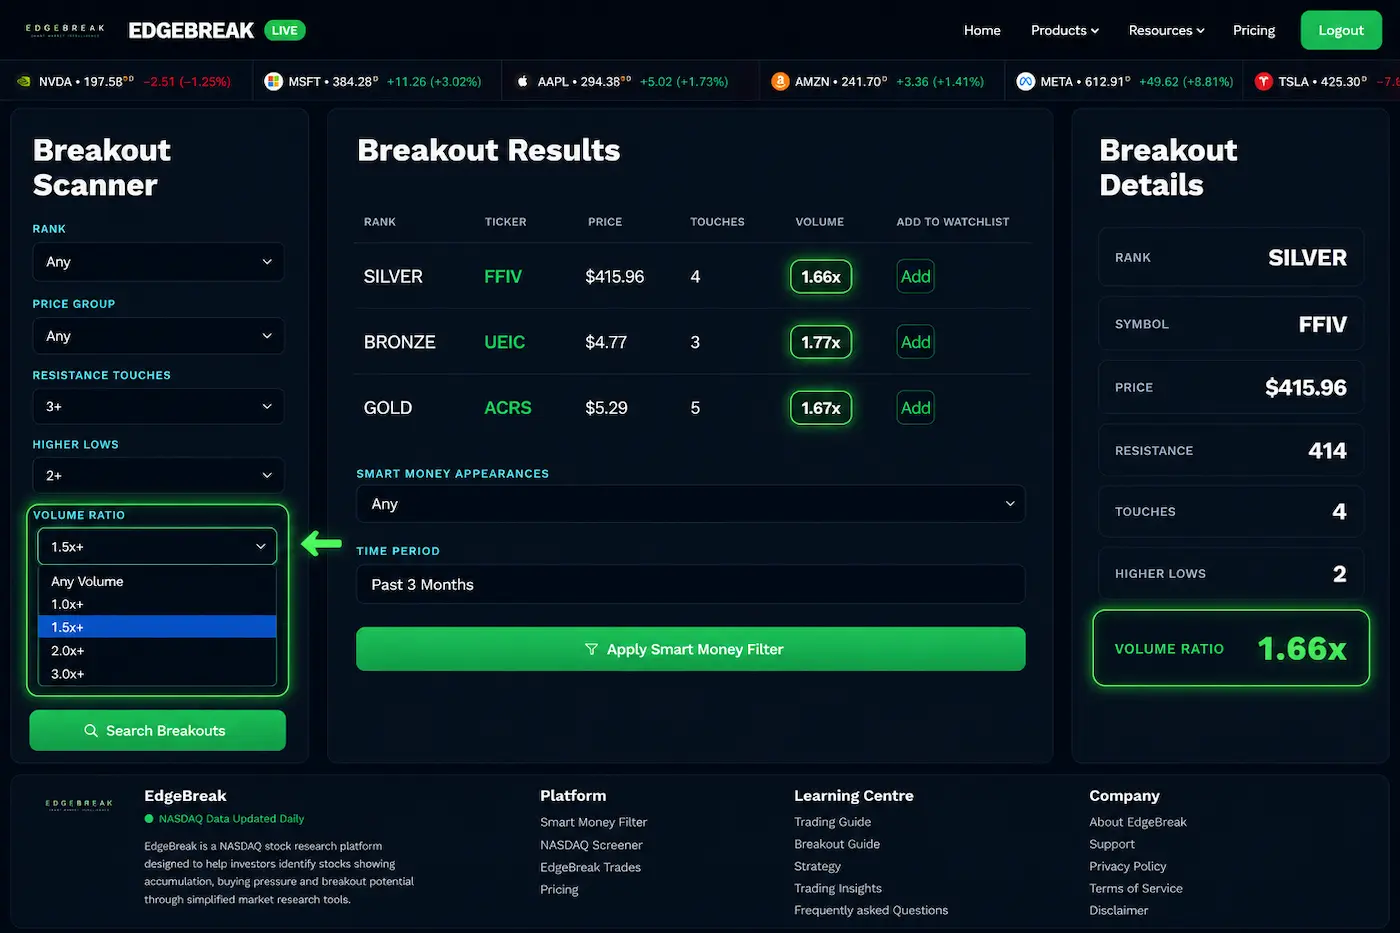
The NASDAQ Scanner includes volume-related information alongside market structure characteristics, while the Breakout Scanner measures volume participation during breakout events. Members can also study historical volume behaviour directly on TradingView charts inside My Workspace.
Rather than acting as a standalone signal, volume becomes one component of a structured research process.
Lesson Summary
Trading volume helps explain the level of market participation behind price movement. While increasing volume often attracts attention during breakout research, it should always be considered alongside market structure, resistance levels, higher lows and other technical characteristics. A balanced approach provides stronger research than relying on any single indicator.
Key Takeaways
- Volume measures market participation.
- Higher volume often indicates increased investor interest.
- Volume dry-ups frequently occur during consolidation.
- Volume expansion can accompany breakout attempts.
- Volume should always be analysed alongside other market characteristics.
Common Beginner Mistakes
- Assuming high volume guarantees a successful breakout.
- Ignoring price action while focusing only on volume.
- Comparing volume between completely different companies.
- Overlooking declining volume during consolidation.
- Using volume as a standalone trading signal.
Research Reminder
Volume provides valuable context for market research but should never be interpreted as a guarantee of future price direction. EdgeBreak combines volume analysis with broader market structure, resistance levels and accumulation characteristics to support independent research. The platform does not provide financial advice or investment recommendations.
Continue Your Journey
Lesson 2.4 – Trend Identification
Learn how to identify uptrends, downtrends and sideways markets by recognising higher highs, higher lows, lower highs and lower lows. Understanding market structure provides essential context before researching breakout opportunities.