Trend Identification
Before researching breakout opportunities, investors first need to understand the direction of the market. Trend identification is one of the foundations of technical analysis because it helps explain whether buyers or sellers are currently in control. Throughout EdgeBreak, market structure plays a far greater role than predicting short-term price movements.
What You'll Learn
- How to identify an uptrend.
- How to recognise a downtrend.
- What higher highs and higher lows mean.
- When markets move sideways.
- How trend analysis supports breakout research.
Why Trends Matter
Markets rarely move randomly for extended periods. Instead, prices tend to develop trends where buyers or sellers gradually gain control over time. Understanding these trends allows investors to place individual price movements into a broader context rather than reacting to every daily fluctuation.
Trend identification helps investors answer one important question:
Who currently appears to be in control — buyers or sellers?
Understanding an Uptrend
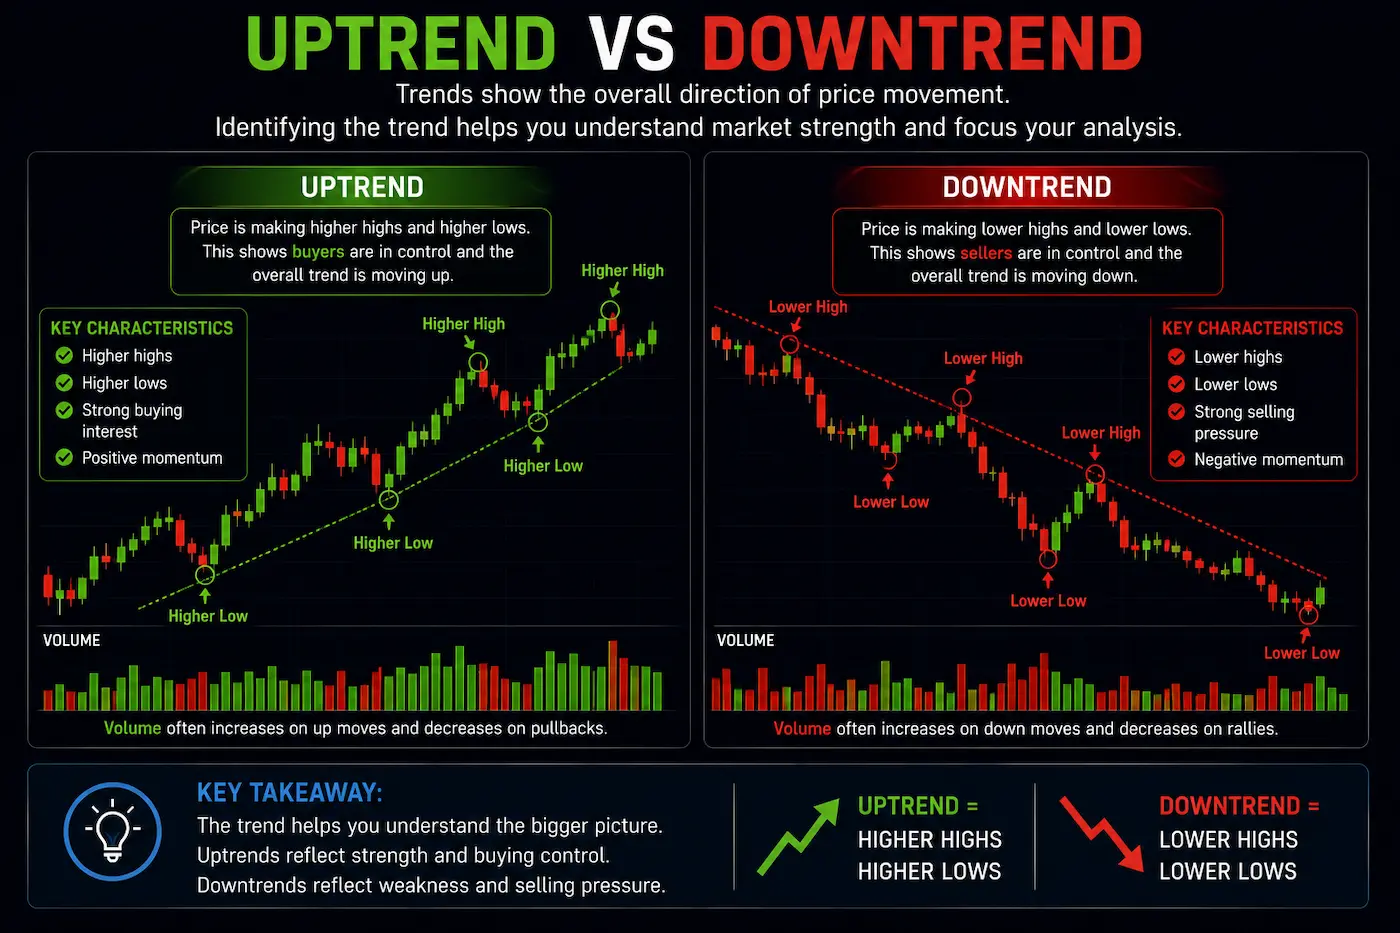
An uptrend develops when price continues making higher highs and higher lows.
Each pullback finds support above the previous low, while each rally pushes above the previous high. This structure indicates that buyers are gradually becoming willing to purchase shares at higher prices.
Strong breakout candidates often develop within established uptrends because the overall market structure already reflects increasing buying pressure.
Understanding a Downtrend
A downtrend occurs when price continues making lower highs and lower lows.
Buyers are unable to maintain previous highs, while sellers continue pushing prices lower after each rally. This structure generally reflects weakening demand and increasing selling pressure.
Researching breakout opportunities during strong downtrends often requires additional caution because the broader market structure remains weak.
Sideways Markets
Not every stock is trending.
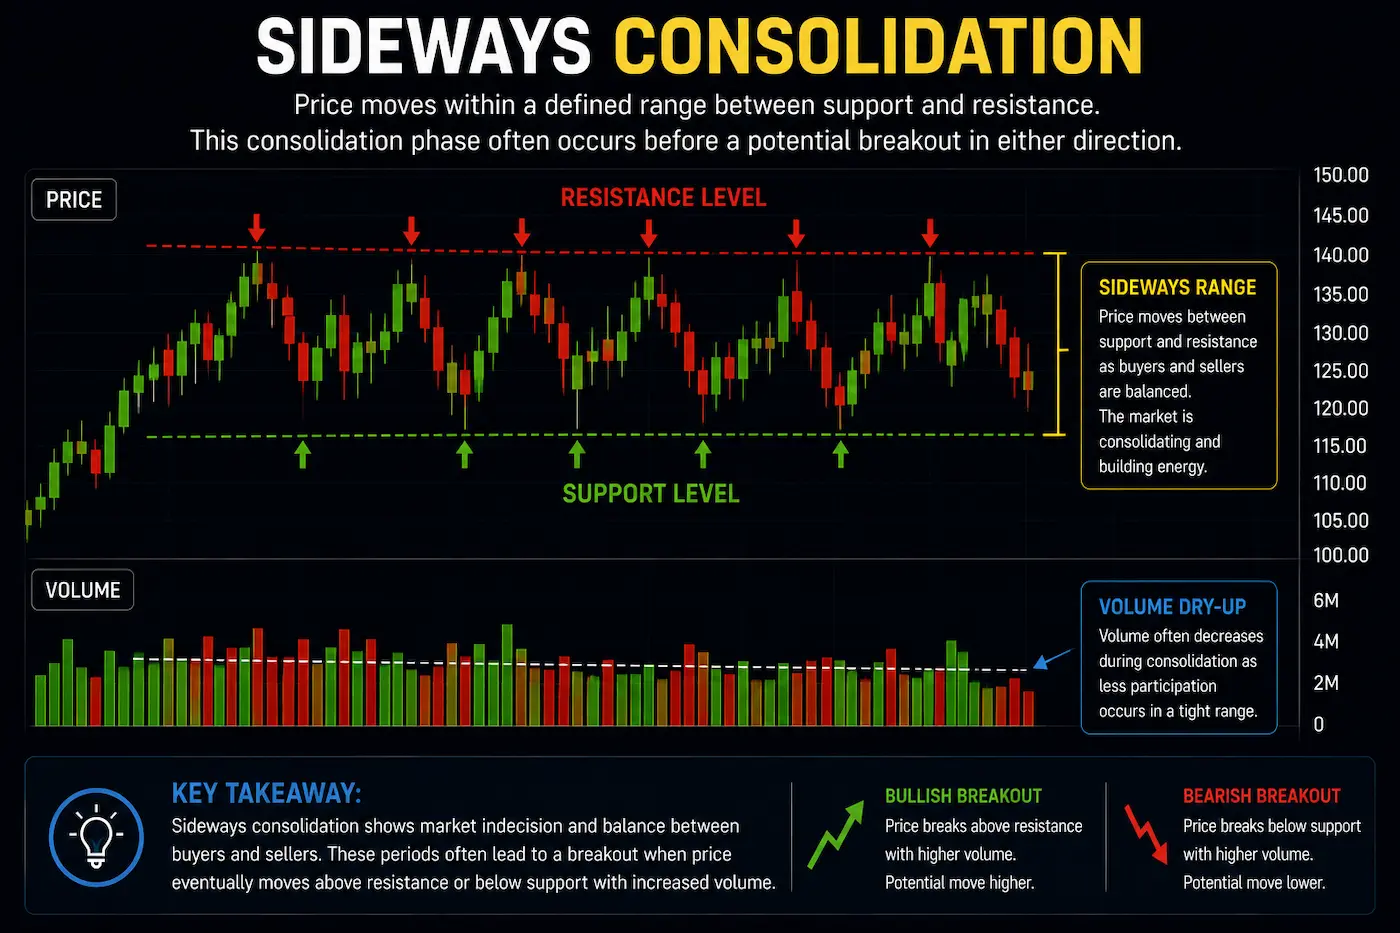
Many companies spend weeks or months moving sideways within relatively well-defined trading ranges. During these periods, buyers and sellers reach a temporary balance while the market decides its next direction.
Sideways markets often become important areas for breakout research because they can contain repeated resistance tests, higher lows and accumulation characteristics.
Trend Changes
Trends do not last forever.
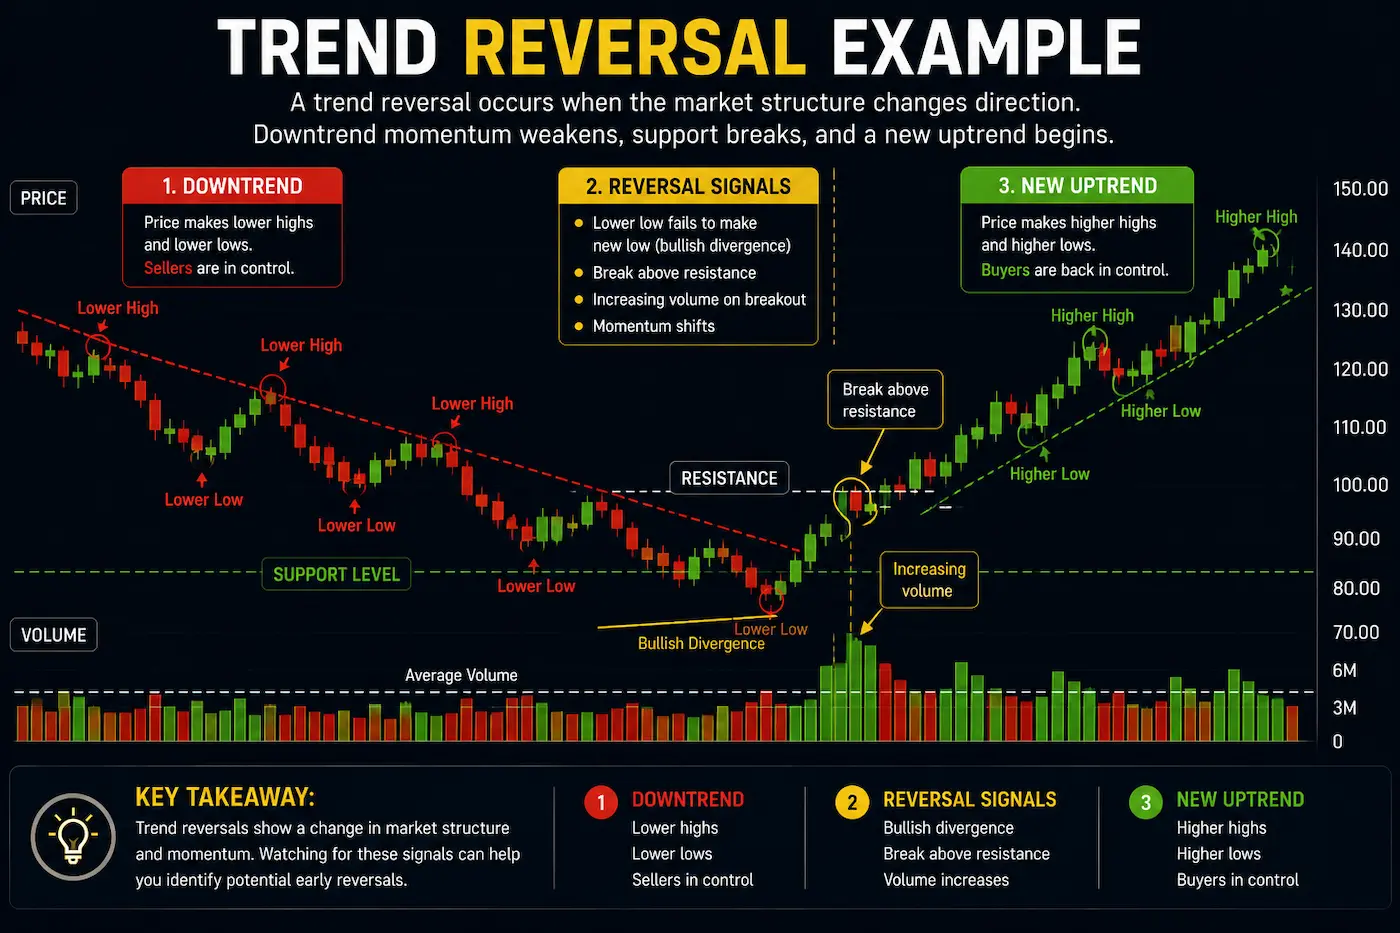
One of the first signs that an uptrend may be weakening is the failure to produce another higher high or the creation of a lower low.
Likewise, a downtrend may begin improving once lower lows stop developing and buyers begin establishing higher lows.
Rather than focusing on exact turning points, many investors simply observe how market structure changes over time.
Trend Strength
Not all trends are equal.
Some trends develop steadily through orderly higher highs and higher lows, while others experience large swings with inconsistent price behaviour.
EdgeBreak places greater emphasis on organised market structure than rapid price movement. A slower, well-structured trend often provides a better research candidate than a highly volatile stock with unpredictable behaviour.
Trend Identification Inside EdgeBreak
Every EdgeBreak scanner incorporates elements of market structure into the research process.
The NASDAQ Scanner searches for stocks displaying higher lows and repeated resistance touches, while the Breakout Scanner identifies stocks that have already moved above resistance. My Workspace allows members to review long-term trends using TradingView charts before deciding whether a stock deserves further research.
Trend identification works alongside volume, accumulation and resistance analysis to build a more complete picture of market behaviour.
Focus on the Bigger Picture
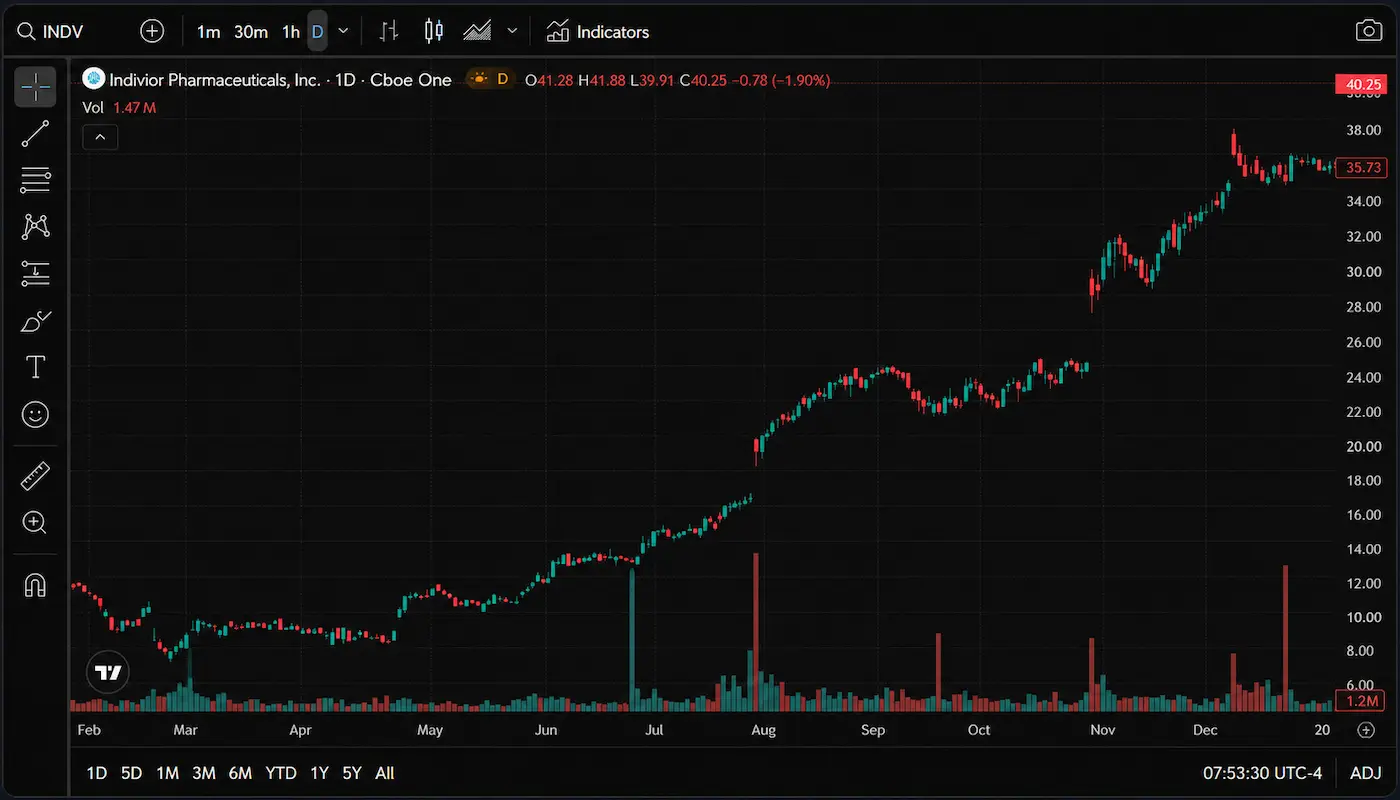
One of the biggest mistakes new investors make is concentrating on individual candles rather than the overall trend.
A single strong day or weak day rarely changes the long-term market structure. Instead, investors should step back and observe how price has behaved over weeks or months.
Understanding the broader trend helps provide context for every other concept you'll learn throughout the Academy.
Lesson Summary
Trend identification provides the foundation for understanding market behaviour. By recognising higher highs, higher lows, lower highs and lower lows, investors can better understand whether buyers or sellers currently control the market. Combined with resistance, volume and accumulation, trend analysis becomes a powerful part of structured breakout research.
Key Takeaways
- Uptrends are formed by higher highs and higher lows.
- Downtrends are formed by lower highs and lower lows.
- Many breakout opportunities begin during sideways consolidation.
- Trend changes occur gradually as market structure evolves.
- Always analyse the broader trend before researching individual price movements.
Common Beginner Mistakes
- Focusing only on today's price movement.
- Ignoring the overall trend.
- Mistaking normal pullbacks for trend reversals.
- Researching breakout opportunities during weak market structures.
- Confusing short-term volatility with long-term trends.
Research Reminder
Trend analysis provides valuable context for market research but should never be relied upon in isolation. EdgeBreak combines trend identification with market structure, resistance, higher lows, volume behaviour and accumulation characteristics to support independent research. The platform does not provide financial advice or investment recommendations.
Continue Your Journey
Lesson 2.5 – Risk Management Basics
Learn the fundamentals of managing risk, including position sizing, protecting capital and why successful market research always begins with controlling downside risk.