Contained consolidation
Price remains organised inside a defined base rather than expanding sharply.
Tight bases keep price contained while volatility and swing amplitude remain controlled. EdgeBreak can surface current NASDAQ stocks matching its Tight Base pattern so you can inspect the consolidation with resistance, higher lows and volume context.
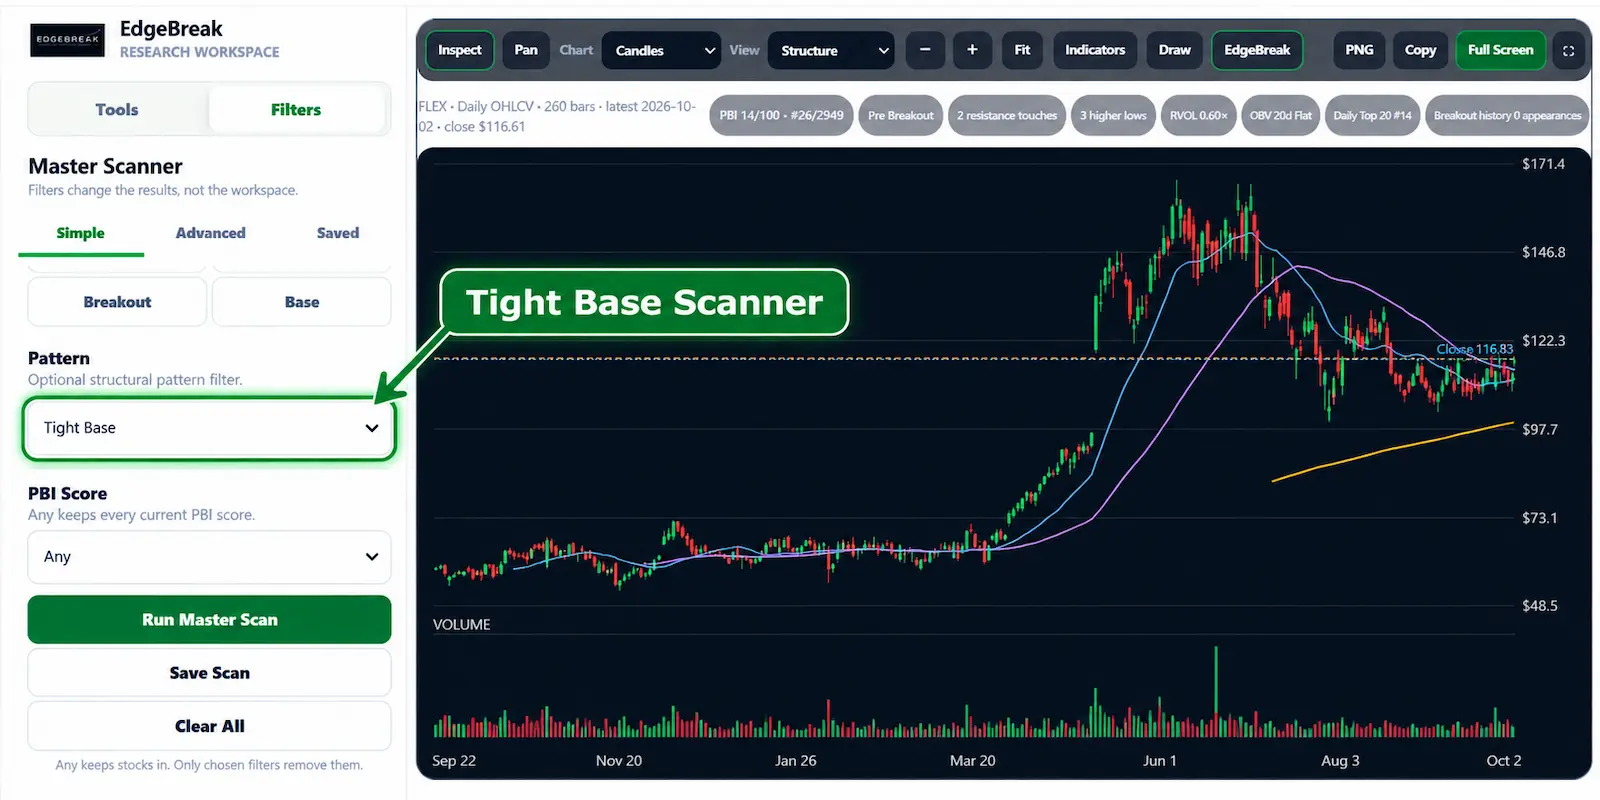
A tight base is a sustained consolidation where price remains inside a relatively contained range instead of expanding into increasingly wide swings. The defining feature is controlled price behaviour, not a prediction that the base will resolve in one direction.
A narrow range can look constructive or fragile depending on what sits around it. The useful questions are whether the base is genuinely contained, whether swings are contracting or stable, whether support is holding and whether the chart still looks organised. EdgeBreak helps narrow the universe before the visual review.
The setup is useful research context only when the underlying structure is visible and coherent.
Price remains organised inside a defined base rather than expanding sharply.
Later swings should stay small enough for the base to remain structurally tight.
The consolidation should not be actively widening into disorderly price action.
A nearby upper boundary can help show where the base is forming in the wider structure.
Improving swing lows can add useful evidence without being required for every tight base.
RVOL, OBV and volume behaviour can be reviewed alongside the base rather than used alone.
Use the Master Scanner to narrow the current NASDAQ universe, combine the pattern with other available technical evidence, open the stock intelligence, inspect the first-party chart, save relevant names to your Watchlist and return after later published scans to see whether the structure changed.
A tight base can widen, lose support, remain range-bound or fail after a breakout attempt. The pattern describes current structure only; it is not a recommendation or prediction.
A tight base is a contained consolidation where price trades in a relatively narrow range and recent swings remain controlled.
Yes. Tight Base is a named EdgeBreak Pattern Library structure available to the Master Scanner for current NASDAQ research.
No. A tight base can persist, widen, lose support or break in either direction. It should be treated as current technical structure.
Volume can add useful context, especially when activity contracts during the base or changes as price approaches an important level.
Use EdgeBreak to surface current Tight Base matches and inspect the consolidation, resistance, higher lows and participation on the chart.