Resistance
Check whether increased activity is occurring near an established technical level.
Relative volume helps show when a stock is trading with more activity than is normal for that stock. EdgeBreak lets you use RVOL as participation context alongside the technical structure.
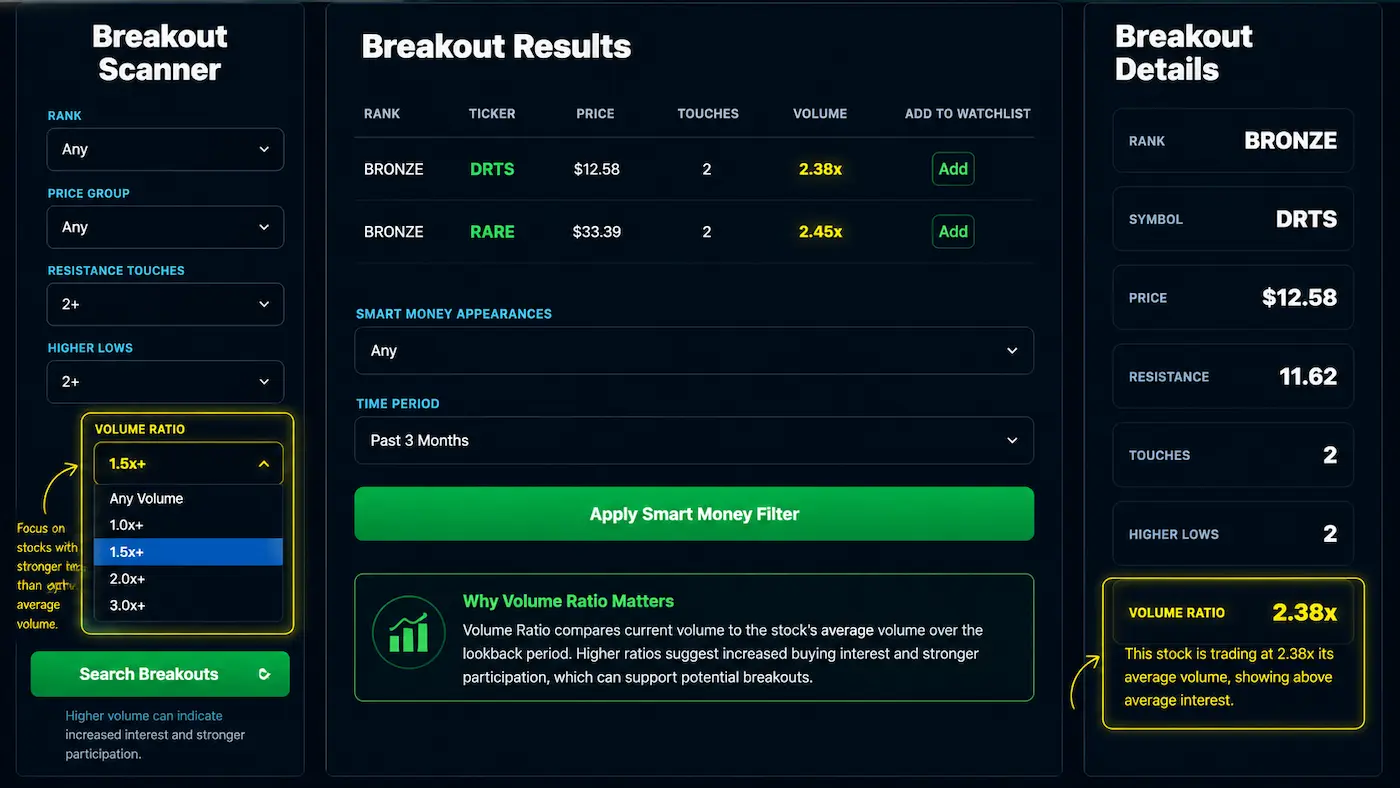
RVOL, or relative volume, compares current or recent trading activity with the stock's normal volume behaviour. It is useful because a raw volume number means very different things for a normally quiet stock and a normally active stock.
A higher relative-volume reading can show that participation has increased. The direction and meaning still depend on the price action: elevated activity can appear during advances, declines, breakouts, failed moves and news-driven volatility.
Traders often use relative volume to decide which stocks deserve a closer look because unusual participation can make a technical move more informative. It can add context around a breakout, a pre-breakout structure or a sharp change in price behaviour.
RVOL should be read with the chart. High activity by itself does not tell you whether the market is accumulating, distributing or reacting to a temporary event.
EdgeBreak combines relative-volume information with the structure around it so the activity can be investigated rather than simply ranked.
Check whether increased activity is occurring near an established technical level.
Compare participation with the quality and persistence of the underlying price structure.
Review whether On-Balance Volume is rising, steady or conflicting with the current setup.
See whether the stock is currently Pre-Breakout, Breakout, Launch Pad or part of the wider universe.
Distinguish organised bases from one-day spikes or highly extended moves.
Inspect volume and price behaviour together on the EdgeBreak chart.
A high RVOL reading near clean resistance can mean something different from the same reading after a large gap or during a steep decline. The surrounding structure determines what deserves further investigation.
Use RVOL with OBV, higher lows, pre-breakout structure and the Breakout Scanner rather than treating volume as an isolated signal.
Relative volume measures unusual participation, not whether that participation is bullish or bearish. A high reading can occur during strong advances, sharp declines or failed moves.
Use the characteristic as a filter, then keep the research connected through the EdgeBreak workflow.
RVOL means relative volume. It compares current or recent trading activity with the stock's normal volume behaviour so unusual participation is easier to identify.
Not automatically. High relative volume can occur during advances, declines, breakouts, failed breakouts or news-driven volatility.
EdgeBreak publishes relative-volume context where available so it can be reviewed with resistance, higher lows, OBV, scanner state and chart structure.
Useful context can include resistance, support, higher lows, OBV, current scanner state and the actual price chart.
Use EdgeBreak to find elevated relative volume and decide whether the surrounding technical structure deserves deeper research.