Identifiable support
The reaction should relate to a visible support level or zone rather than an arbitrary price.
A support bounce begins with price interacting with an identifiable support area and then moving away from it. EdgeBreak can surface current NASDAQ stocks matching its Support Bounce pattern so the reaction can be researched in context.
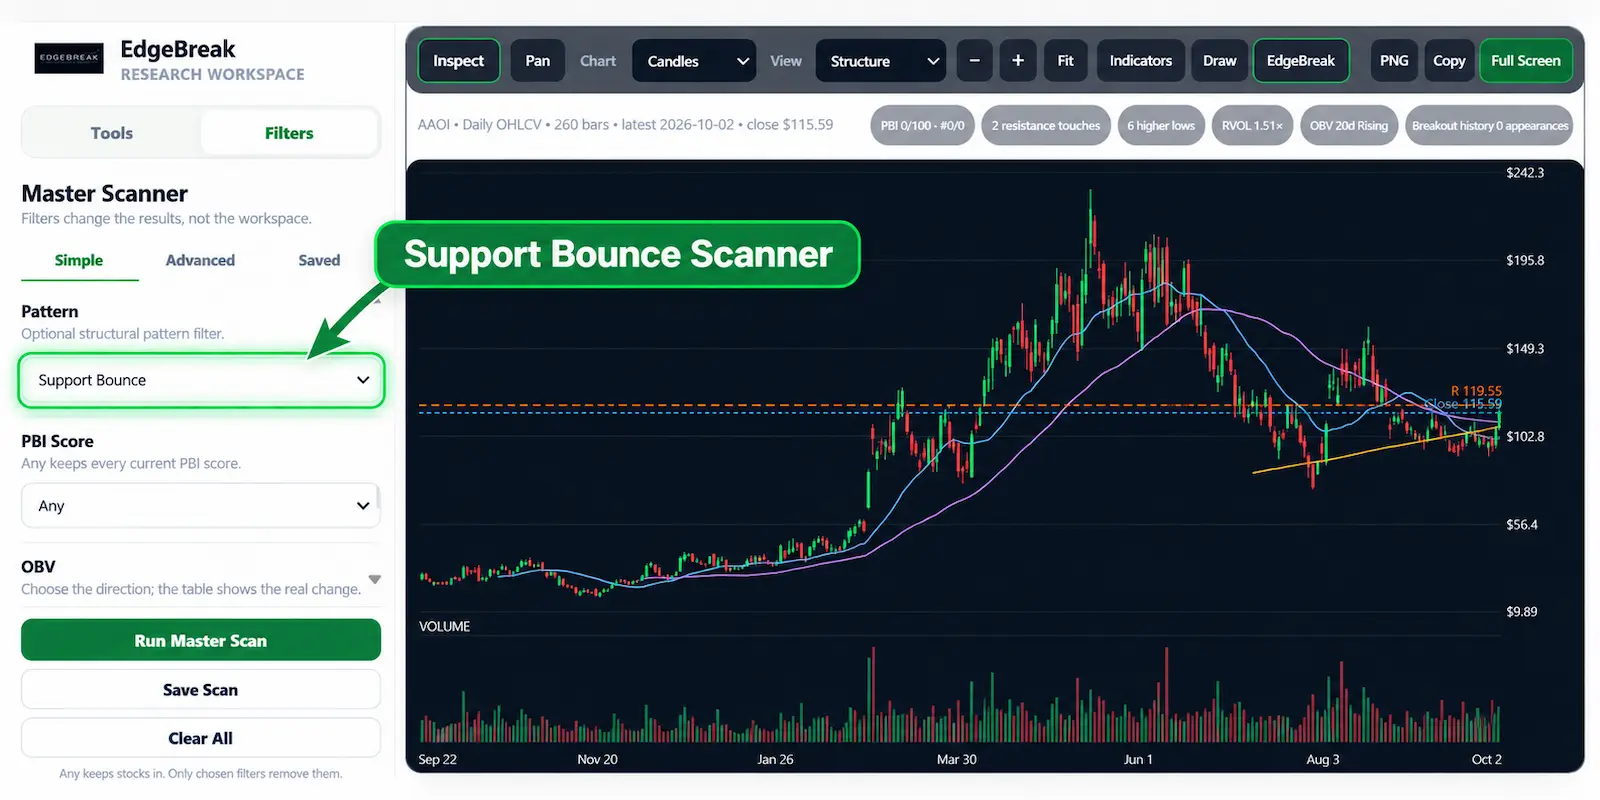
A support bounce is a recent interaction with a support level or zone where price holds above that area and subsequently moves away from it. The important sequence is the support test, the hold and the upward reaction—not simply that price is above an old low.
A bounce can be brief, weak or part of a larger downtrend. Researching the reaction means checking whether support is identifiable, whether price actually responded to the level, how the latest swing developed and whether the wider structure remains coherent. EdgeBreak helps surface that evidence for chart review.
The setup is useful research context only when the underlying structure is visible and coherent.
The reaction should relate to a visible support level or zone rather than an arbitrary price.
Price should have recently tested or approached the area closely enough for the reaction to matter.
The bounce only makes sense while the support area remains structurally relevant.
The latest structural move should show price moving away from the support area.
Multiple meaningful interactions can strengthen the importance of the level when present.
Participation and the surrounding trend should be reviewed alongside the support reaction.
Use the Master Scanner to narrow the current NASDAQ universe, combine the pattern with other available technical evidence, open the stock intelligence, inspect the first-party chart, save relevant names to your Watchlist and return after later published scans to see whether the structure changed.
A support bounce can fail, reverse or remain temporary, and support can later break. EdgeBreak reports the current structure for research; it does not convert support into a stop level or a personal trade instruction.
A support bounce is a price reaction where a stock tests an identifiable support area, holds above it and then moves away from the level.
Yes. Support Bounce is a named EdgeBreak Pattern Library structure available to the Master Scanner for current NASDAQ research.
No. Support can later fail and a bounce can reverse. The pattern describes current price behaviour, not future certainty.
No. EdgeBreak reports factual support structure for research and does not convert that level into a personalised stop or trade instruction.
Use EdgeBreak to surface current Support Bounce matches and review the support interaction, latest swing, participation and wider chart before drawing conclusions.