Prior upward impulse
The setup begins with a clear advance before the consolidation develops.
Bull flags combine a strong prior advance with a shorter, controlled pause. EdgeBreak can surface current NASDAQ stocks matching its Bull Flag pattern so you can compare the consolidation, volume context and chart structure before drawing conclusions.
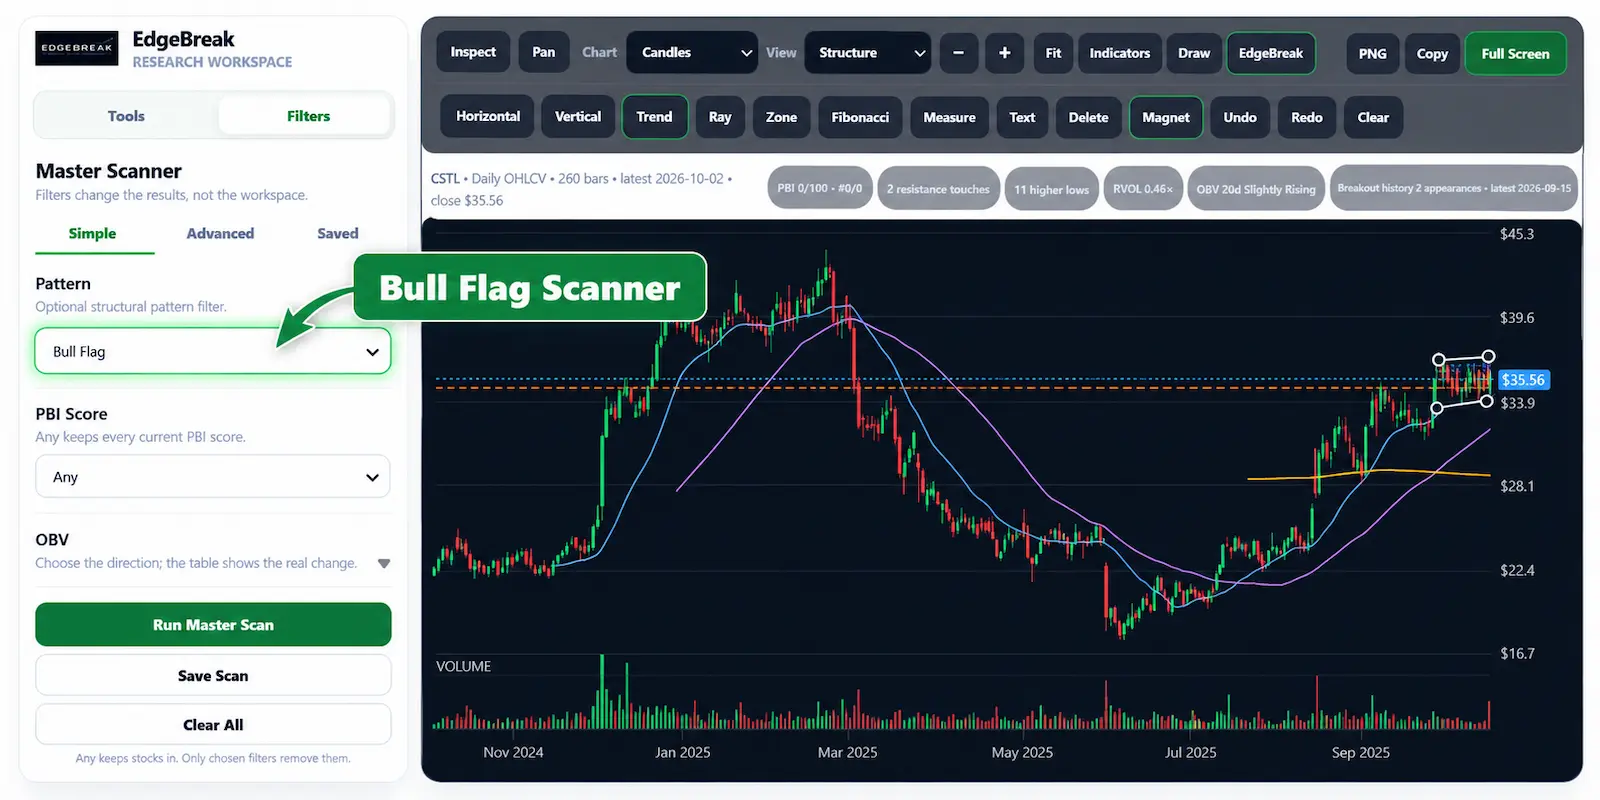
A bull flag is a continuation structure that follows a meaningful upward impulse. Price then pauses in a smaller consolidation or pullback while remaining in a higher price regime. The flag is the controlled pause after the advance, not simply any sideways base.
A pattern name can hide important differences. A useful review asks whether there was a genuine prior impulse, whether the pause is controlled rather than disorderly, whether the range is stable or tightening and whether participation supports the structure. EdgeBreak uses the pattern to narrow research, while the chart remains the final visual check.
The setup is useful research context only when the underlying structure is visible and coherent.
The setup begins with a clear advance before the consolidation develops.
The pause should be materially calmer than the move that preceded it.
Price should remain organised rather than expanding into uncontrolled volatility.
The broader short-term structure should still look constructive rather than deteriorating.
Volume can provide useful participation context during the consolidation and any later move.
Open the chart to confirm that the impulse-and-pause geometry is actually present.
Use the Master Scanner to narrow the current NASDAQ universe, combine the pattern with other available technical evidence, open the stock intelligence, inspect the first-party chart, save relevant names to your Watchlist and return after later published scans to see whether the structure changed.
A bull flag can fail, continue consolidating or lose its prior structure. Scanner classification does not mean price will continue higher and does not provide a buy, sell or hold recommendation.
A bull flag is a continuation structure where a meaningful upward move is followed by a shorter controlled consolidation or pullback.
Yes. Bull Flag is a named EdgeBreak Pattern Library structure available to the Master Scanner for current NASDAQ research.
No. A bull flag can fail, widen, reverse or remain in consolidation. The pattern is research context, not a forecast.
No. They are related continuation concepts, but EdgeBreak currently treats Bull Flag as the supported named scanner pattern rather than labelling bullish pennants as the same pattern.
Use EdgeBreak to surface current Bull Flag matches, then compare the prior impulse, consolidation, participation and actual chart before deciding what deserves deeper research.