Trading Insights
What Is
Volume Dry-Up?
Learn how declining trading activity can appear during consolidation and why volume only becomes useful when it is read alongside price structure.
Volume Analysis
June 2026
6 min read
What is volume dry-up?
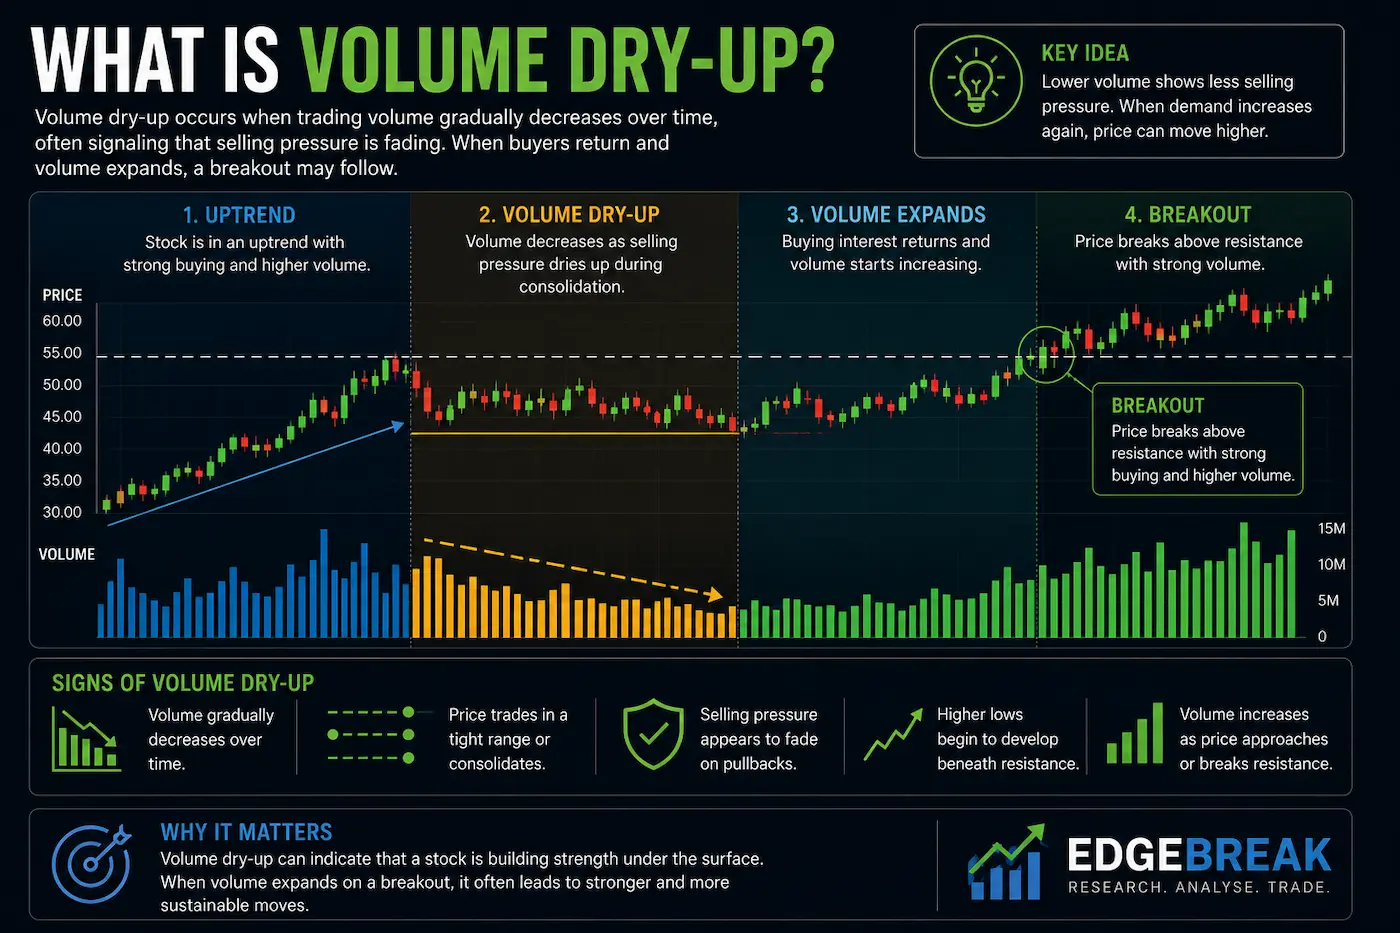
Volume dry-up describes a period where the number of shares changing hands gradually declines over several sessions or weeks.
It often appears while a stock is consolidating, but low volume on its own does not reveal whether sellers are exhausted, buyers are waiting or market participants are simply less active.
Why volume needs price context
Volume tells us how much activity occurred. Price tells us where that activity took place and how the stock responded.
Declining volume beneath resistance can mean something very different when price is forming higher lows and holding a tight range than when the same low volume appears during a weak, drifting decline.
Volume dry-up during consolidation
Some stocks experience declining activity while trading sideways beneath resistance. If the range also becomes tighter and support remains intact, the lower volume can become one part of a constructive technical picture.
The important point is that the volume pattern is being interpreted through the structure rather than in isolation.
What happens when volume returns?
If trading activity later increases while price tests or moves through resistance, the change can show that participation has expanded.
That still does not guarantee that the move will hold. A breakout can occur on stronger volume and still fail, which is why the prior base and post-breakout behaviour remain important.
Volume cannot identify who is trading
Daily volume does not reveal whether a specific group of investors is accumulating or distributing shares. Every completed trade has both a buyer and a seller.
Volume is therefore best used to measure participation and compare current activity with the stock's own recent behaviour.
Look at trends, not one session
One quiet trading day tells very little. A more useful approach is to examine how volume behaves over several sessions or weeks and whether that behaviour lines up with changes in price structure.
Is activity gradually declining while price tightens? Are pullbacks occurring on lighter volume? Does activity expand again as the stock approaches resistance? These questions provide more context than a single volume bar.
Final thoughts
Volume dry-up can be useful because it encourages investors to study how participation changes while a technical structure develops.
Its strongest use is contextual. Declining volume can become more interesting when price remains organised, support holds and resistance stays relevant, but it does not prove reduced selling pressure or predict a breakout.
By reading volume together with price structure, investors can build a more disciplined and transparent research process.