Scan the NASDAQ
Ask for Breakouts, Pre-Breakouts, Launch Pad structures, PBI leaders or a custom Master Scanner search using ordinary language.
Ask EdgeBreak to find setups, refine scanner results, open charts, research a stock, search for similar technical structures and manage your watchlist — without learning a new command language.
EdgeBreak for ChatGPT is preparing for public launch. The EdgeBreak web platform is available now.
EdgeBreak connects conversational requests to the same scanner, chart and research systems behind the EdgeBreak platform.
Ask for Breakouts, Pre-Breakouts, Launch Pad structures, PBI leaders or a custom Master Scanner search using ordinary language.
Narrow the current result set by resistance distance, higher lows, OBV, RVOL, price, structure and other supported EdgeBreak fields.
Render branded EdgeBreak charts with current structure and technical context, then continue through the same result set.
Search for ascending triangles, higher-low bases, resistance compression, tight bases, bull flags and charts resembling a current setup.
Move from the setup into company overview, financial context, news, filings, institutional research, signal history and EdgeBreak intelligence.
Add or remove stocks conversationally and return to the names you are following without rebuilding the research from scratch.
EdgeBreak is designed around the questions traders already ask. Start broad, narrow the result set, inspect the chart and continue into deeper research.
You can also ask follow-up questions such as “show me more”, “only keep rising OBV”, “chart the first four” or “find more like this” while keeping the current research context.
The goal is to bring the same published EdgeBreak intelligence into a conversational interface, while keeping the web platform available for deeper visual exploration.
Start with current EdgeBreak scan results or run a fresh custom search across the reviewed NASDAQ universe.
Use PBI, structure, resistance distance, higher lows, OBV, RVOL and other supported research filters.
Open EdgeBreak charts, compare setups and search for related chart structures or patterns.
Continue into company, financial, market-attention and historical EdgeBreak context before making your own decision.
These three views show the core EdgeBreak research flow: narrow the scanner, open the chart, then investigate the stock in more detail.
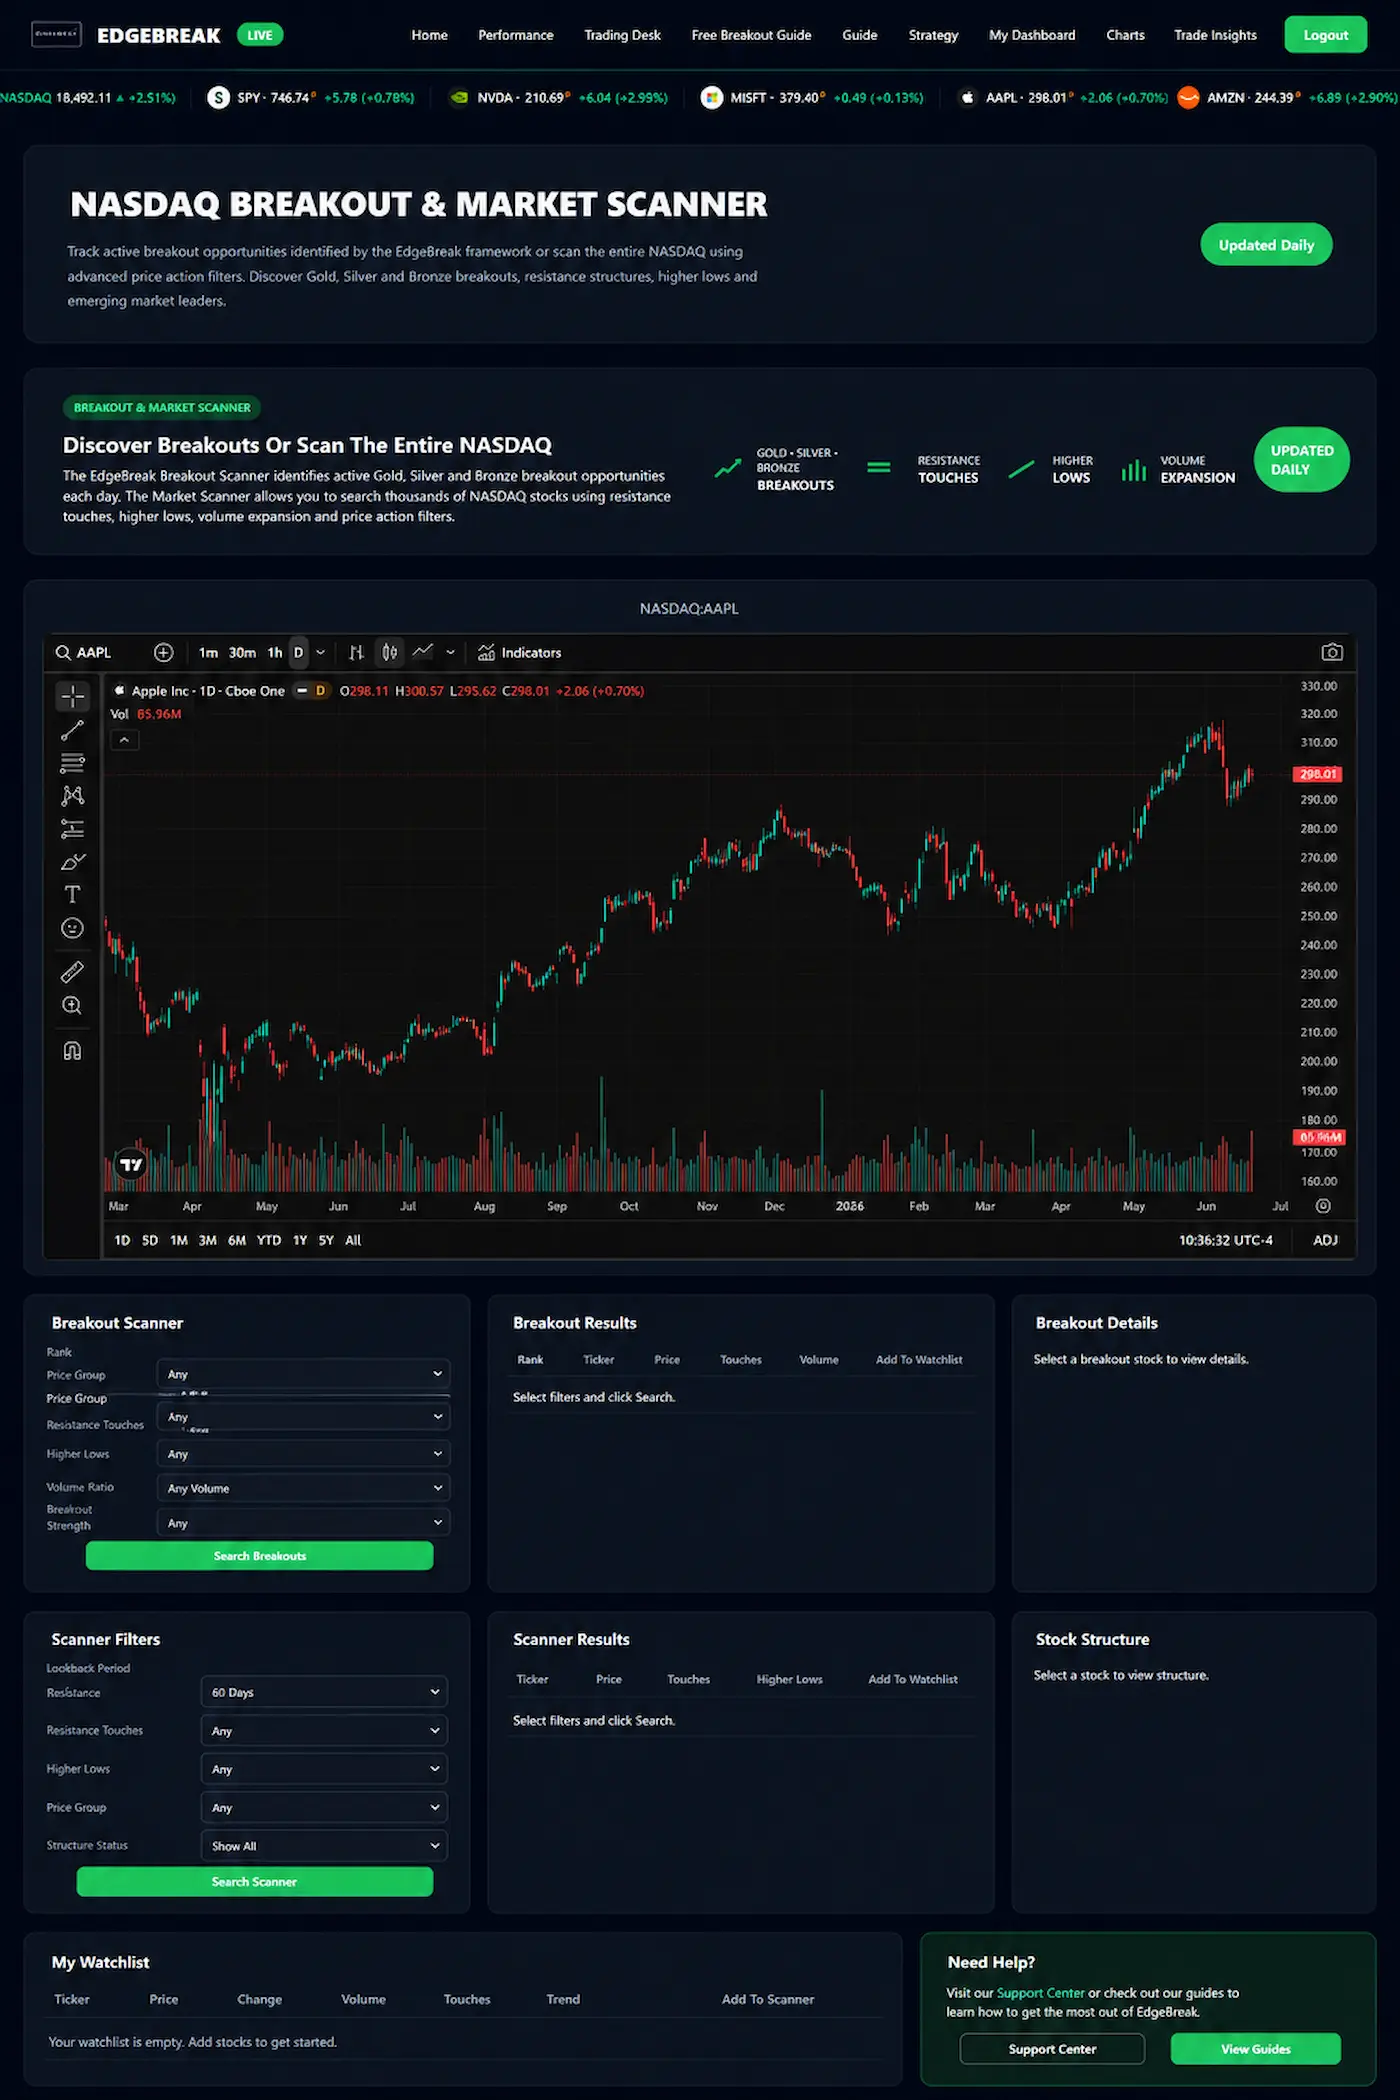
Start with current results and narrow them using structure, resistance distance, higher lows, OBV, RVOL and other supported EdgeBreak fields.
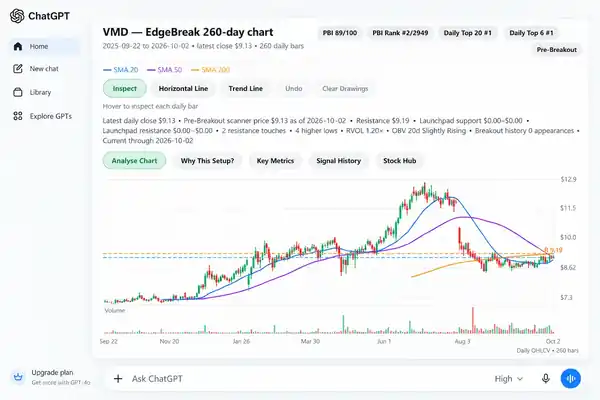
Move from the shortlist into full EdgeBreak charts with structure, moving averages, resistance and supporting metrics without rebuilding the search.
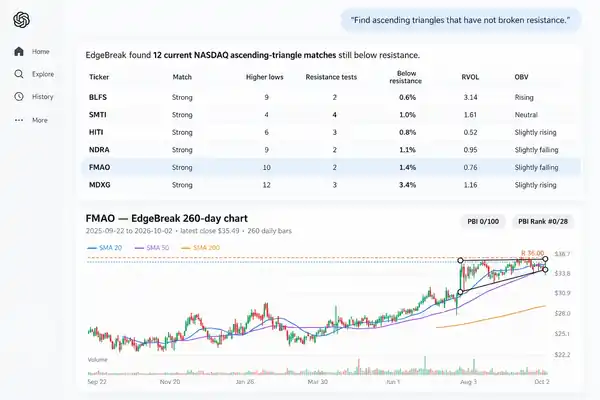
Search the current NASDAQ universe for ascending triangles and other supported structures, then inspect the matching charts in context.
EdgeBreak can search the current NASDAQ universe for similar technical structures instead of forcing you to open thousands of charts manually. Ask for more setups like a ticker you already like, or search directly for a named pattern.
The matching process uses chart structure and supporting evidence such as resistance, support, higher lows, compression, moving-average relationships, relative volume, OBV and other available EdgeBreak context.
Start from a current EdgeBreak ticker or chart and search for other NASDAQ setups with related structure.
Ask for current structures such as ascending triangles and other organised bases without relying on one visual label alone.
Once the pattern search returns candidates, narrow them by PBI, OBV, RVOL, distance to resistance and other supported filters.
A short walkthrough will show the full flow from scanner discovery through filtering, charts, stock intelligence and watchlist actions.
Pricing is now set at $30 USD/month for the EdgeBreak web platform with basic AI, or $50 USD/month for full access including the ChatGPT integration.
For traders who want the EdgeBreak website scanners, charts, research tools and basic AI.
Everything in Standard, plus the complete conversational EdgeBreak experience in ChatGPT when public access is available.
EdgeBreak is designed for stock discovery, chart analysis and market research. The human user remains responsible for investment decisions.
The ChatGPT integration is being prepared for public availability. You can use the EdgeBreak web platform today, create a watchlist, run scanners and start researching current NASDAQ setups while the ChatGPT experience completes launch review.
It is the conversational EdgeBreak experience for ChatGPT. It connects natural-language requests to EdgeBreak's NASDAQ scanning, chart, stock-intelligence, pattern-search and watchlist workflows.
Yes. You can describe the filters you want in normal language and EdgeBreak can translate supported criteria into the same Master Scanner engine used by the EdgeBreak platform.
Yes. EdgeBreak can render branded stock charts with current structure and supporting metrics. Up to four charts are shown in a single response before continuing to the next set.
Yes. EdgeBreak can search current chart structures such as ascending triangles, higher-low bases, resistance compression and tight bases, and can look for setups similar to another EdgeBreak chart.
The scanner product is NASDAQ focused. EdgeBreak is designed around its reviewed NASDAQ universe rather than trying to be a generic all-market screener.
EdgeBreak provides market research and analysis, not financial advice. It can explain factual setup evidence and market structure, while the investment decision remains yours.
No. EdgeBreak does not execute trades, control brokerage accounts or manage portfolios.
It is preparing for public launch. The EdgeBreak web platform and free research tools are available now.
Use EdgeBreak on the web today, then bring the same research workflow into ChatGPT when the integration becomes publicly available.