A scanner can surface dozens of candidates in a few seconds. The harder part is deciding what each result actually represents. A stock near resistance may be consolidating, already breaking out, or simply moving in a wide trading range. Those are different research situations, even if every ticker appears on the same broad list.
Conversational refinement is a useful way to inspect those differences. Instead of rebuilding a form or memorising filter names, you can describe the evidence you want and progressively narrow a published scanner result set. EdgeBreak's ChatGPT integration is designed around this sequence, while the underlying scanner remains the source of the market data.
1. Pick a setup stage before adding indicators
Start by distinguishing a developing setup from a completed move. A Pre-Breakout search focuses on stocks still building a structure below an identified resistance area. A Breakout search looks at names that have moved through an important level. A Base search emphasises consolidation. These buckets answer different questions.
“Show the latest published Pre-Breakout results.”
“Within those results, keep stocks that still have an intact resistance level.”
“Show me which names have been consolidating rather than accelerating away from the structure.”
It helps to request the scan date at the outset. “Today” on a weekend or before an end-of-day publication may refer to the previous completed US market session, not a fresh trading day.
2. Narrow by structure, not by a high score alone
Technical scores can help order candidates, but they should not replace an inspection of the underlying chart. Three structural checks are often more informative together than any one ranking number:
- Distance to resistance: How far is the latest published price from the relevant resistance zone? Very different distances imply different stages of a setup.
- Higher lows: Is the stock showing repeated, meaningful improvements in support, rather than an isolated one-day bounce?
- Consolidation: Has the range tightened or become disorderly? A quiet base and a fast, volatile advance should not be treated as identical.
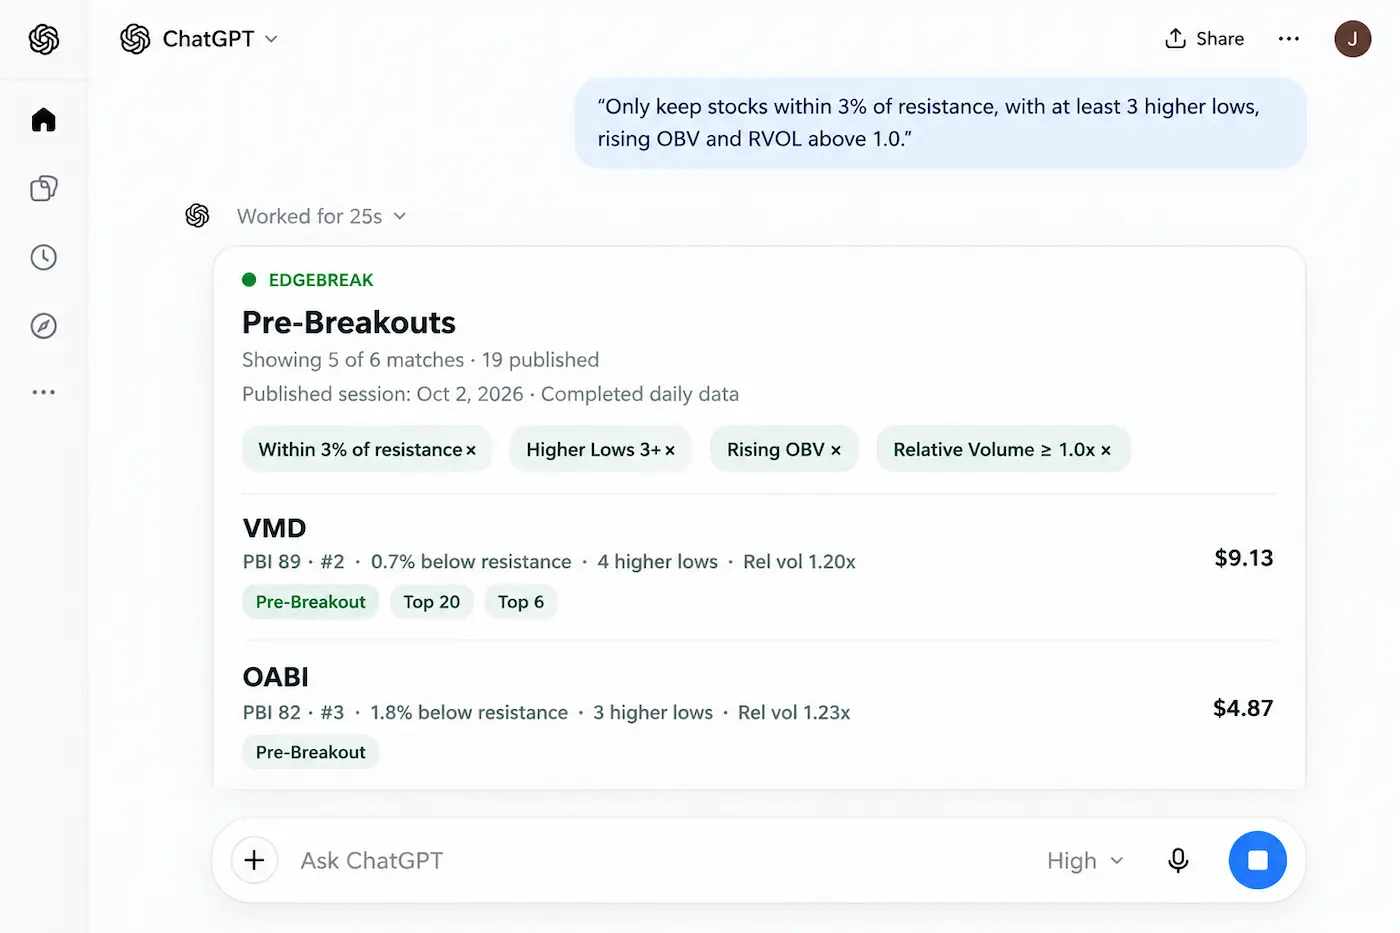
“Only keep names with at least two higher lows and a latest daily close within 3% of identified resistance.”
The percentages and thresholds are research filters, not recommended trading entries. Changing the threshold should change which candidates remain. Keep track of those differences rather than assuming a tighter filter always means a better result.
3. Use volume and OBV as supporting evidence
Relative volume (RVOL) compares recent trading volume with a reference level; on-balance volume (OBV) tracks the direction of volume-adjusted price moves over time. They can provide additional context, but neither establishes who is buying shares or guarantees a breakout.
One useful comparison is to run the same shortlist twice: once asking for rising OBV, and again asking for steady OBV. Review which stocks disappear. A rigid “rising only” requirement might exclude a quiet consolidation that otherwise merits investigation. Alternatively, weak participation may be an important caution. The chart provides the context needed to interpret the difference.
4. Keep the original result set when you ask follow-ups
The practical advantage of conversational screening is continuity. An additional question should narrow the list being reviewed—not silently start an unrelated search. After a scan, use phrases such as “within those results”, “show the remaining names”, or “remove the ones already far above resistance”. Ask for the applied filters to be restated so that the comparison is reproducible.
If you receive no matches, broaden one condition at a time. For example, change a resistance-distance filter from 2% to 4% without changing the OBV requirement. This reveals which constraint was responsible for shrinking the shortlist.
5. Move from the shortlist to the chart
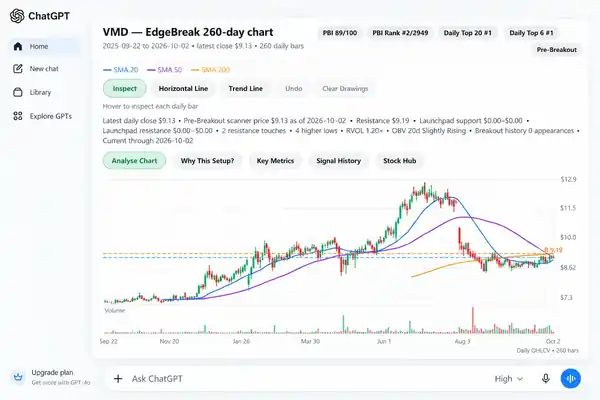
When the list is manageable, inspect each stock individually. Note the last daily bar date, visible resistance, quality of higher lows, volume behaviour and any contradictory evidence. A good-looking scanner row may be much less convincing once the full chart is visible.
For a more disciplined review, keep a short note for each candidate: what qualifies it, what weakens the interpretation, and what information is still missing. That is more useful than treating the top-ranked ticker as an automatic decision.
6. Verify that the market data is current
Scanner results and chart data may be published at different times. Before relying on the output, compare the scanner's session date with the chart's latest daily candle. A missing or stale chart is a reason to stop and check the feed, not to invent a price or assume the previous session is current. The chart verification checklist and the guide to finding similar chart setups explains exactly what to inspect.
Watch the workflow in context
The existing EdgeBreak walkthrough demonstrates scanner discovery, follow-up filtering, charts and stock research in one connected flow. It is the same video used on the main ChatGPT product page.
A repeatable six-question shortlist check
- Which market session does this scan represent?
- Which setup stage am I researching?
- How many results remain after checking resistance and higher lows?
- What changes when I compare rising and steady OBV?
- Do the actual charts support the scanner classification?
- What would weaken or invalidate the research interpretation?
Used consistently, this approach turns a large candidate list into a small set of charts that you can examine on their own merits. It does not rank future returns or replace independent judgement.
See the connected research workflow
Explore how EdgeBreak connects scanner results, technical charts and follow-up research in ChatGPT. Features and availability are described on the product page.
Explore EdgeBreak for ChatGPT →Educational stock-market research only; not financial advice. AI analysis and published market data can be incomplete, delayed or mistaken. Always verify information independently.