Trading Insights

How Often Do Stock
Breakouts Fail?

There is no universal breakout failure percentage. The useful question is why breakouts fail, which warning signs matter before the move, and how to compare stronger setups with more fragile ones.

Breakout Research Updated September 2026 6 min read
How Often Do Breakouts Fail?

How often do stock breakouts fail?

Quick answer: there is no reliable universal percentage for how often stock breakouts fail. Any quoted failure rate depends on how a breakout is defined, how long the move is measured, which market is studied and what counts as failure. That makes a single headline percentage less useful than understanding the structure around the breakout.

In practice, false breakouts are more useful to study as a setup-quality problem: Was resistance clearly established? Were higher lows forming? Was the stock tightly consolidating? Did participation improve? Did price hold above the breakout level? Those questions help separate a cleaner breakout structure from a more fragile one.

If you want to find these structures before the move, EdgeBreak's Breakout Scanner and Pre-Breakout Scanner are designed to narrow the NASDAQ to setups worth researching further.

Breakout failure rates vary because researchers and traders use different definitions, timeframes, markets and rules for deciding whether a breakout succeeded or failed.

The most useful approach is therefore not to rely on one headline failure rate, but to examine the quality of the setup: how clearly resistance is defined, whether support is improving, how tight the consolidation is, what volume is doing and whether the broader market is supportive.

What is a failed breakout?

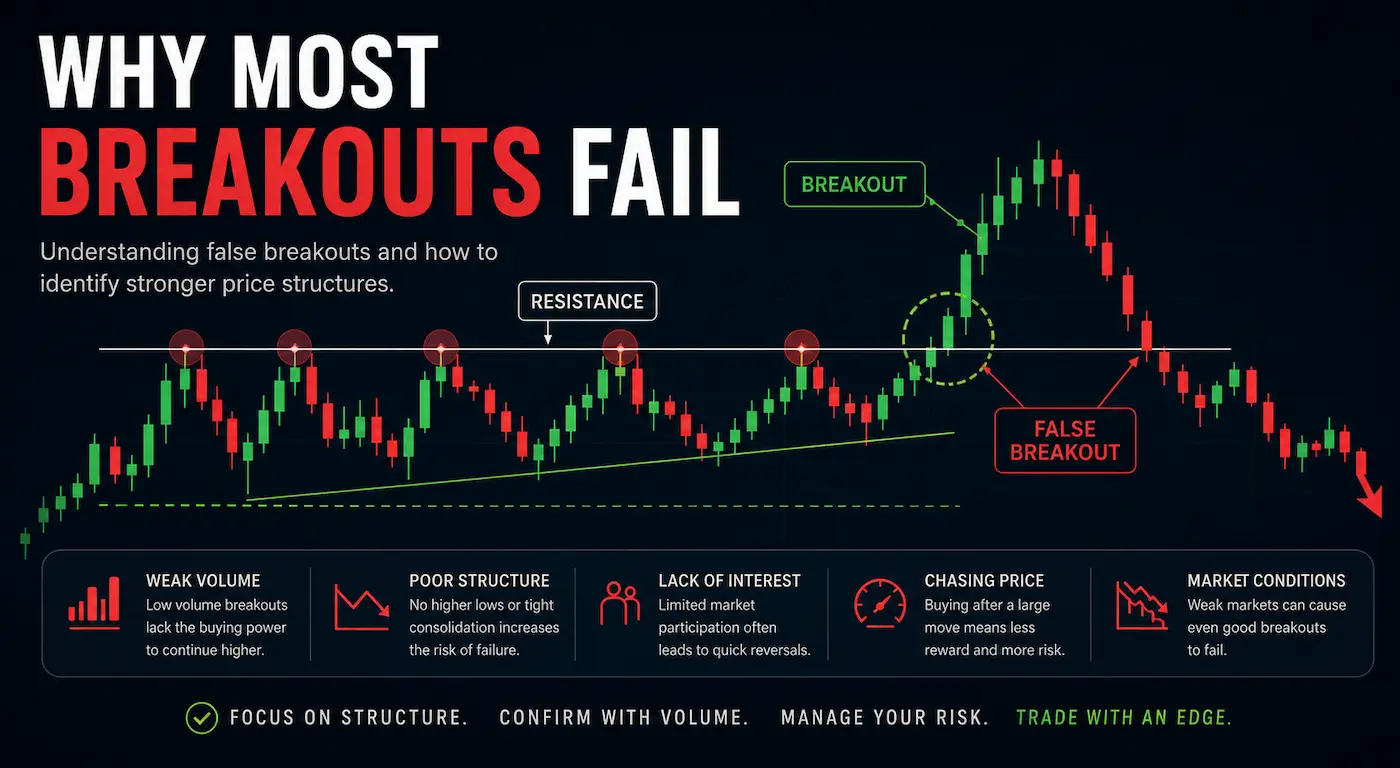
A failed or false breakout occurs when price moves above an established resistance area but cannot hold the move. Instead of building above the level, the stock falls back into the previous range.

That does not make the breakout candle meaningless. It shows that moving through resistance is only one stage of the structure, not proof that a new trend has begun.

Why breakout failure rates vary

A reported breakout success or failure rate can change substantially depending on the definition of a breakout, the holding period, the market being studied and the threshold used to label a move successful. That is why a single percentage should not be treated as a universal rule.

What a useful breakout failure statistic must define

A breakout failure statistic is only meaningful when the study explains exactly what was measured. At minimum, the research needs to define the market, the breakout rule, the resistance rule, the starting price, the holding period and what counts as failure.

For example, a study that calls a breakout a failure after one close back below resistance is measuring something different from a study that waits five sessions, requires a percentage decline or measures whether price ever reaches a specified gain first. Both can be valid, but their percentages are not directly comparable.

EdgeBreak maintains historical scanner records for research and product validation, but the currently verified archive is not yet a controlled outcome study with one standard success/failure definition across a complete historical sample. Until that methodology is complete, EdgeBreak will not publish a headline failure percentage that the data cannot support.

That is why this guide focuses on the evidence that can be evaluated consistently: resistance quality, higher-low structure, consolidation, participation, extension and whether price can hold the breakout area.

Why failure is normal

Markets are uncertain. Buyers and sellers continually adjust their decisions as price, news, liquidity and broader market conditions change.

Even technically organised setups can fail. The practical goal is therefore not to eliminate every failed breakout, but to understand which structures provide stronger evidence before the move occurs.

The key idea

A breakout can be real
and still fail.

Price can genuinely move through resistance and then reverse. Good research focuses on the quality of the structure around the move rather than assuming every breakout must continue.

Common weaknesses

Five reasons a setup may be more fragile.

None of these factors guarantees failure, but several appearing together can make the breakout less convincing.

01
Weak structure Resistance may be poorly defined or the base may lack higher lows and organised support.
02
Limited participation Low or inconsistent volume can provide less evidence that the move is attracting broader activity.
03
Too much extension A stock already well above its base may be harder to evaluate against the original setup.
04
Weak closes Price repeatedly losing the breakout level can show that the new structure is not holding cleanly.
05
Weak market backdrop Broader market or sector weakness can make it harder for individual stocks to sustain momentum.
Compare the setup

More organised
versus more fragile.

More organised

A stronger breakout research case usually contains more evidence before price moves through resistance.

✓
Repeated resistance testing over a meaningful period.
✓
Higher lows or stable support beneath the level.
✓
Tighter consolidation and reduced volatility.
✓
Volume and broader market context support further investigation.

More fragile

A breakout can be less convincing when the move appears without enough technical foundation underneath it.

—
Resistance is poorly established or barely tested.
—
Lower highs or weak support dominate the structure.
—
Large volatile swings appear before the breakout.
—
Price quickly loses the breakout level after the move.

Poor price structure

The breakout candle often receives the most attention, but the base underneath the move can be more informative. Repeated resistance tests, higher lows and tighter consolidation can create a clearer market structure to evaluate. The EdgeBreak Breakout Guide and Academy lesson on breakout quality expand on how those pieces fit together.

When those characteristics are missing, the breakout may have less technical evidence behind it.

Volume is useful, but not decisive

Stronger activity around a breakout can show that participation has increased, while very weak volume may make the move less convincing. Periods of volume dry-up during consolidation can also provide useful context before a breakout attempt.

But volume cannot guarantee success. A breakout on high volume can still fail, and volume does not reveal exactly who is buying or selling. It should be interpreted alongside price structure.

Chasing an extended move

Once a stock has moved far above the original base, the structure that created the research case may become less useful.

Earlier discovery allows the investor to understand resistance, support and the quality of the base before price becomes widely extended. A focused NASDAQ stock scanner can help narrow the market to structures worth researching in more detail.

Broader conditions still matter

A strong individual setup exists inside a broader market. Sector weakness, index pressure or rapidly changing market conditions can affect how easily momentum is sustained.

This does not mean broad conditions decide the outcome, but they can add important context when evaluating breakout quality.

Failure does not always mean the setup is finished

Some stocks briefly move above resistance, fall back into the range and later rebuild. Others lose support entirely and form a new structure.

The useful question is what the chart looks like after the failure: does support remain intact, does resistance continue to matter, and is the structure becoming more organised again?

How EdgeBreak approaches this

Find the structure.
Then test the evidence.

EdgeBreak uses rules-based NASDAQ scanning to identify technically relevant structures, then adds market activity, company information and chart research as additional context rather than treating any single factor as confirmation.

✓
Technical filtering first Resistance, higher lows, bases, reversals, consolidation and extension are assessed across more than 3,200 NASDAQ-listed stocks.
✓
Market activity as context Unusual off-exchange and multi-venue behaviour can add evidence without being labelled confirmed institutional buying.
✓
Continue the investigation AI company research, AI chart analysis, EdgeBreak Charts, watchlists and My Workspace help users examine what happens before and after the breakout.

Breakout failure FAQs

How often do stock breakouts fail?

There is no single universal failure rate. The answer changes with the market, timeframe, breakout definition, holding period and the rule used to decide whether the move succeeded or failed. A percentage without those definitions can be misleading, so breakout quality is better assessed by examining resistance, support, consolidation, participation and whether price can hold above the breakout level.

What counts as a failed breakout?

There is no single definition. A study might count failure as a close back below resistance, a decline of a specified percentage, failure to make follow-through within a set number of sessions or another clearly stated rule. The definition must be known before a failure rate can be interpreted.

What causes a breakout to fail?

Common weaknesses include poorly defined resistance, weak support, inconsistent participation, excessive extension, repeated closes back below the breakout level and an unsupportive market or sector backdrop.

Does high volume guarantee a breakout will hold?

No. Higher volume can indicate increased participation, but it cannot guarantee continuation. Volume is most useful when it is interpreted alongside resistance, support, consolidation and broader market structure.

Final thoughts

Failed breakouts are a normal part of technical markets. No combination of resistance, higher lows, consolidation, volume or market context can remove uncertainty.

The strongest use of breakout research is therefore not to search for certainty, but to compare the quality of one setup with another.

By studying the structure before the move and continuing to evaluate what happens afterwards, investors can build a more disciplined and transparent research process.

Research the setup

Before trusting
the breakout.

Use EdgeBreak to scan more than 3,200 NASDAQ-listed stocks, identify technically relevant structures and continue your research with market activity, company information and chart analysis.

Chart Analyzer $25 • Standard $35 • Full Access $50
Research and educational information only • Not financial advice