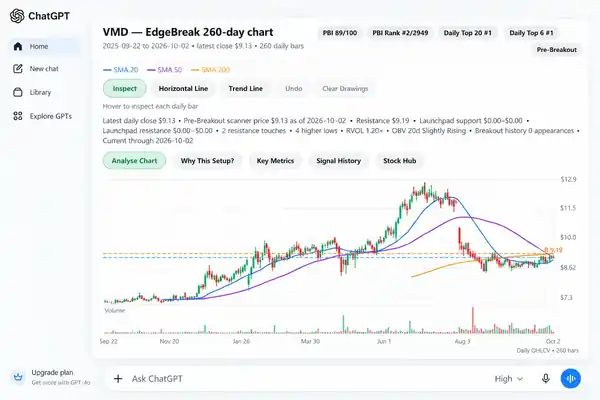
Seeing a ticker in a breakout or pre-breakout scan is only the first step. The next step is to open its chart and check whether the evidence behind the label is still present. That means confirming which market session the data represents, where price sits relative to structure, and whether volume indicators agree with the visible chart.
EdgeBreak can bring charts and market research into the ChatGPT research workflow, but the verification method is useful with any serious stock research tool. The goal is to identify missing or inconsistent information before drawing conclusions.
1. Check the date of the latest candle
The date matters as much as the displayed price. A daily candle from the previous completed US session is normal on weekends. After a weekday's close, a daily scan may require additional processing before its current-session publication is available. “Today” in Australia and “today” on a US stock exchange can also refer to different calendar dates.
- Expected session: Which US market trading day should be present?
- Latest chart bar: Does the final candle correspond to that session?
- Scanner publication: Is the scanner result from the same session as the chart?
- Intraday versus daily: Is a displayed price a live quote, an intraday reading, or a completed daily close?
These are not interchangeable. A current live quote does not prove that an end-of-day technical scan has published successfully.
“Show me this stock's chart, the latest daily candle date and the scanner's publication date. Flag any difference instead of assuming the data is current.”
If the tool reports zero chart bars, unavailable history or a stale publication, the correct response is to investigate the data status. It is not safe to interpret a chart that was never returned.
2. Compare price with the relevant resistance zone
Resistance is not always a single perfect horizontal number. Multiple price tests may define a zone, while a gap or one unusual spike can distort an otherwise orderly structure. Ask whether the level was established by several meaningful attempts and whether the latest price remains near that area or has already moved well beyond it.
This distinction is particularly important when comparing a developing base with an already extended breakout. The same historical resistance level can describe very different current situations if price has moved dramatically since the scan.
3. Inspect higher lows and the condition of the base
Counting higher lows can be helpful, but count quality matters. Several small fluctuations over a few sessions should not automatically be treated as equivalent to well-separated support tests across a sustained base.
Look at the whole visible structure: Is the trading range tightening? Are pullbacks becoming shallower? Has price respected support repeatedly? Has a large gap or sharp sell-off changed the pattern? A scanner classification should prompt these questions, not end them.
4. Read OBV and RVOL with the price chart
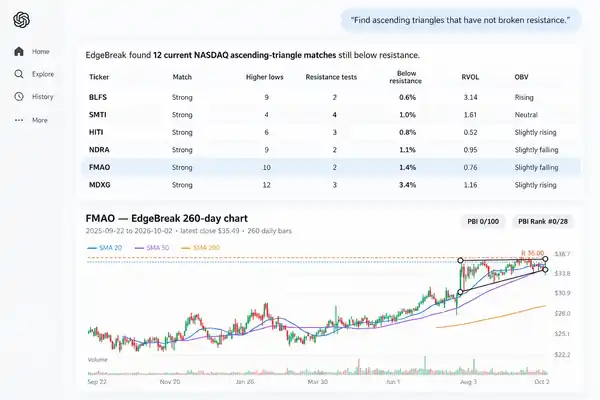
OBV attempts to characterise directional volume pressure. RVOL describes how current volume compares with a chosen baseline. Both can contribute to an evidence-based chart review; neither guarantees buying demand, institutional activity or future price movement.
Compare the indicators with the actual price action. A rising OBV reading may provide one kind of confirmation. Steady OBV alongside an increasingly tight base may provide a different kind of context. High RVOL on a disorderly reversal can mean something different from high RVOL accompanying an orderly move through resistance.
5. Ask what would contradict the setup
Every chart review benefits from a short counterargument. A classification may be weakened by a broken support area, an unusually extended move, conflicting volume behaviour, stale candles or insufficient history. Good research does not require that all evidence point in one direction.
“Summarise the evidence supporting this classification, then list the strongest reasons it might be misleading. Keep observations separate from guesses.”
6. Keep the scanner and chart connected—but distinguish their jobs
A scan helps decide which charts deserve attention. A chart shows what is visible in the price and volume history. Company and market research can then add context that technical indicators do not contain. None of these tools independently determines whether a security is suitable for a particular person.
When you want to reduce a large result list before opening charts, see our separate guide to refining a stock scanner shortlist with follow-up questions. It covers stage selection, resistance-distance filters and OBV comparisons without silently switching to a new search.
See scanner-to-chart research in one walkthrough
EdgeBreak's existing video shows how discovery, charts, stock intelligence and subsequent questions can fit together. We have reused it here so the example is consistent with the main product demonstration.
The five-point check to keep beside every chart
- Session: Does the chart include the expected US trading session, and is the latest price labelled accurately?
- Structure: Is resistance identifiable and still relevant to the current price?
- Support: Are higher lows and consolidation visible in the actual candles?
- Volume: Do OBV, RVOL and price action tell a consistent story—or do they conflict?
- Limitations: What relevant evidence is missing, stale or contrary to the initial classification?
This checklist deliberately stops short of recommending an entry, exit, position size or stock to purchase. Its purpose is to make the research process more transparent and easier to verify.
See the connected research workflow
Explore how EdgeBreak connects scanner results, technical charts and follow-up research in ChatGPT. Features and availability are described on the product page.
Explore EdgeBreak for ChatGPT →Educational stock-market research only; not financial advice. AI analysis and published market data can be incomplete, delayed or mistaken. Always verify information independently.