Trading Insights
AI Stock Chart Analysis:
How It Works.
Learn what AI can actually identify on a stock chart, how to use it step by step,
what questions to ask, and where AI-assisted chart analysis stops being reliable.
AI Chart Research
August 2026
7 min read
What is AI stock chart analysis?
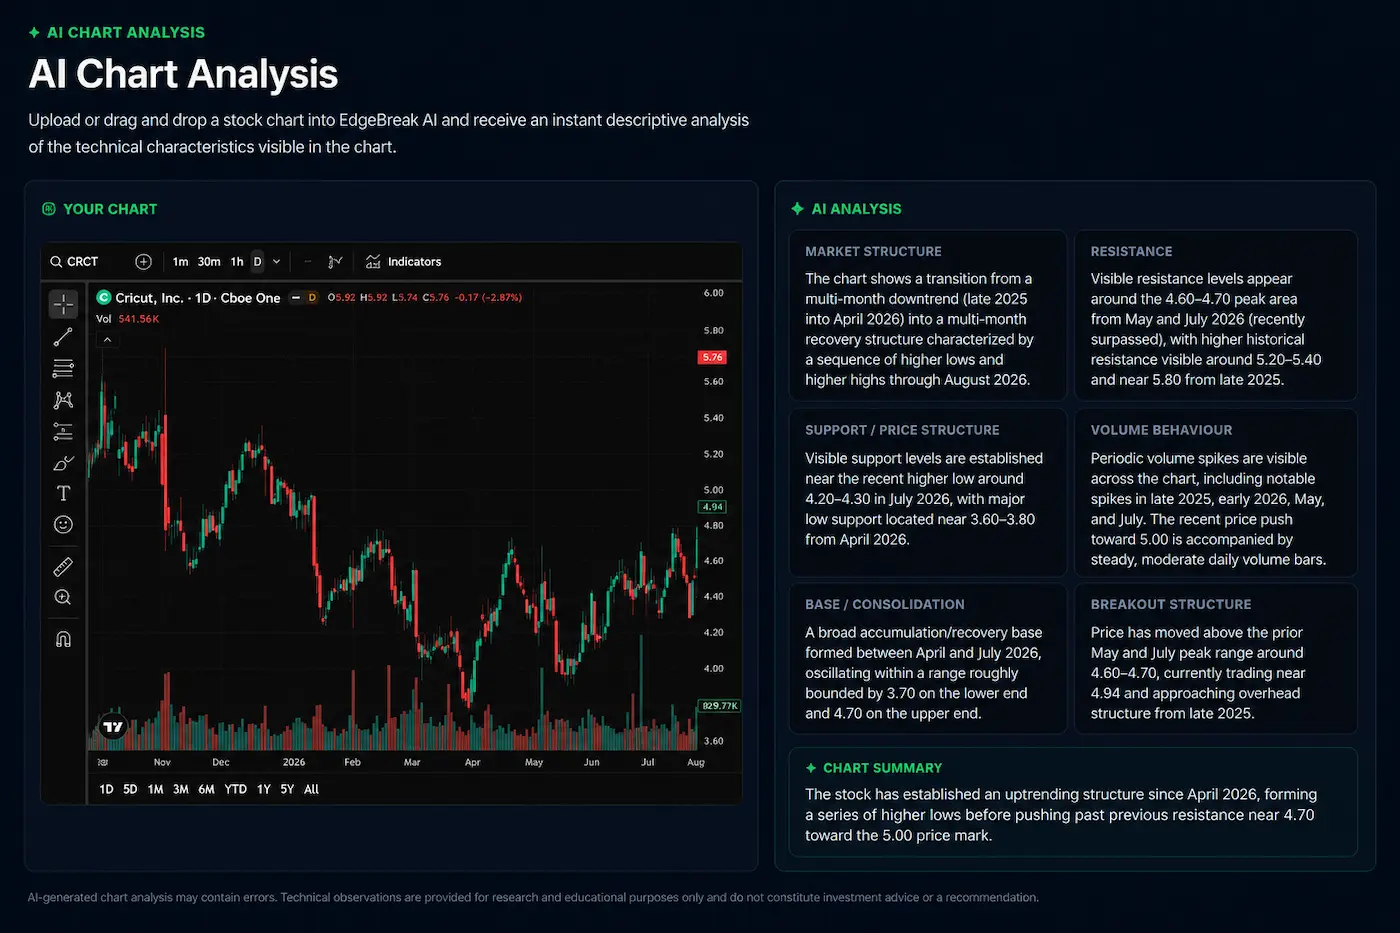
AI stock chart analysis uses artificial intelligence to interpret visible information from a stock chart. Depending on the system, the AI may analyse an uploaded image, chart screenshot or structured market data and then describe the technical characteristics it can see.
The goal is not to replace technical analysis. AI can provide another research perspective by explaining areas such as support, resistance, trend direction, consolidation and volume in clear language.
What can AI identify on a chart?
A chart contains several layers of information. AI can help organise those layers by identifying visible structures and explaining how they relate to one another.
Useful observations can include higher highs and higher lows, lower highs and lower lows, repeated resistance tests, support zones, trading ranges, breakouts, failed breakouts and changes in volume behaviour.
Why use AI for chart research?
Technical charts can contain a large amount of information. Newer investors may find it difficult to decide which parts of a chart deserve attention, while more experienced investors may use AI as a second descriptive perspective.
AI can help explain why a resistance area matters, whether higher lows are developing beneath resistance, how organised a consolidation appears or how visible volume relates to the price structure.
AI chart analysis and breakout research
Breakout research is well suited to chart analysis because it often involves repeated resistance tests, support, higher lows, consolidation and volume.
A scanner can first identify stocks displaying relevant technical characteristics. AI chart analysis can then help explain the visible setup in more detail so the investor can continue investigating it.
Can AI predict a breakout?
No chart analysis method can guarantee that a breakout will occur or predict the exact future price of a stock. Technical patterns describe current and historical behaviour rather than providing certainty about future outcomes.
AI is therefore most useful as a research and education tool. It can help interpret the chart in front of you, but it should not be treated as an automated trading instruction system.
If you want to test this workflow directly, the EdgeBreak AI Stock Chart Analysis tool
lets you upload, paste or drag and drop your own chart for descriptive analysis.
Final thoughts
AI stock chart analysis can make technical research easier to understand by turning visible chart characteristics into a clearer explanation of what price is doing.
Its strongest role is descriptive. Support, resistance, trends, consolidation, breakout structure and volume can all be investigated without pretending that the chart provides certainty about the future.
When AI chart analysis is combined with company information, broader market context and independent verification, it can become a useful part of a more structured research process.