Trading Insights
AI Stock
Chart Analyzer.
Learn how AI can examine a stock chart and explain visible support, resistance, trends, consolidation, breakout structure and volume without turning the chart into a prediction.
AI Chart Research
August 2026
6 min read
What is an AI stock chart analyzer?
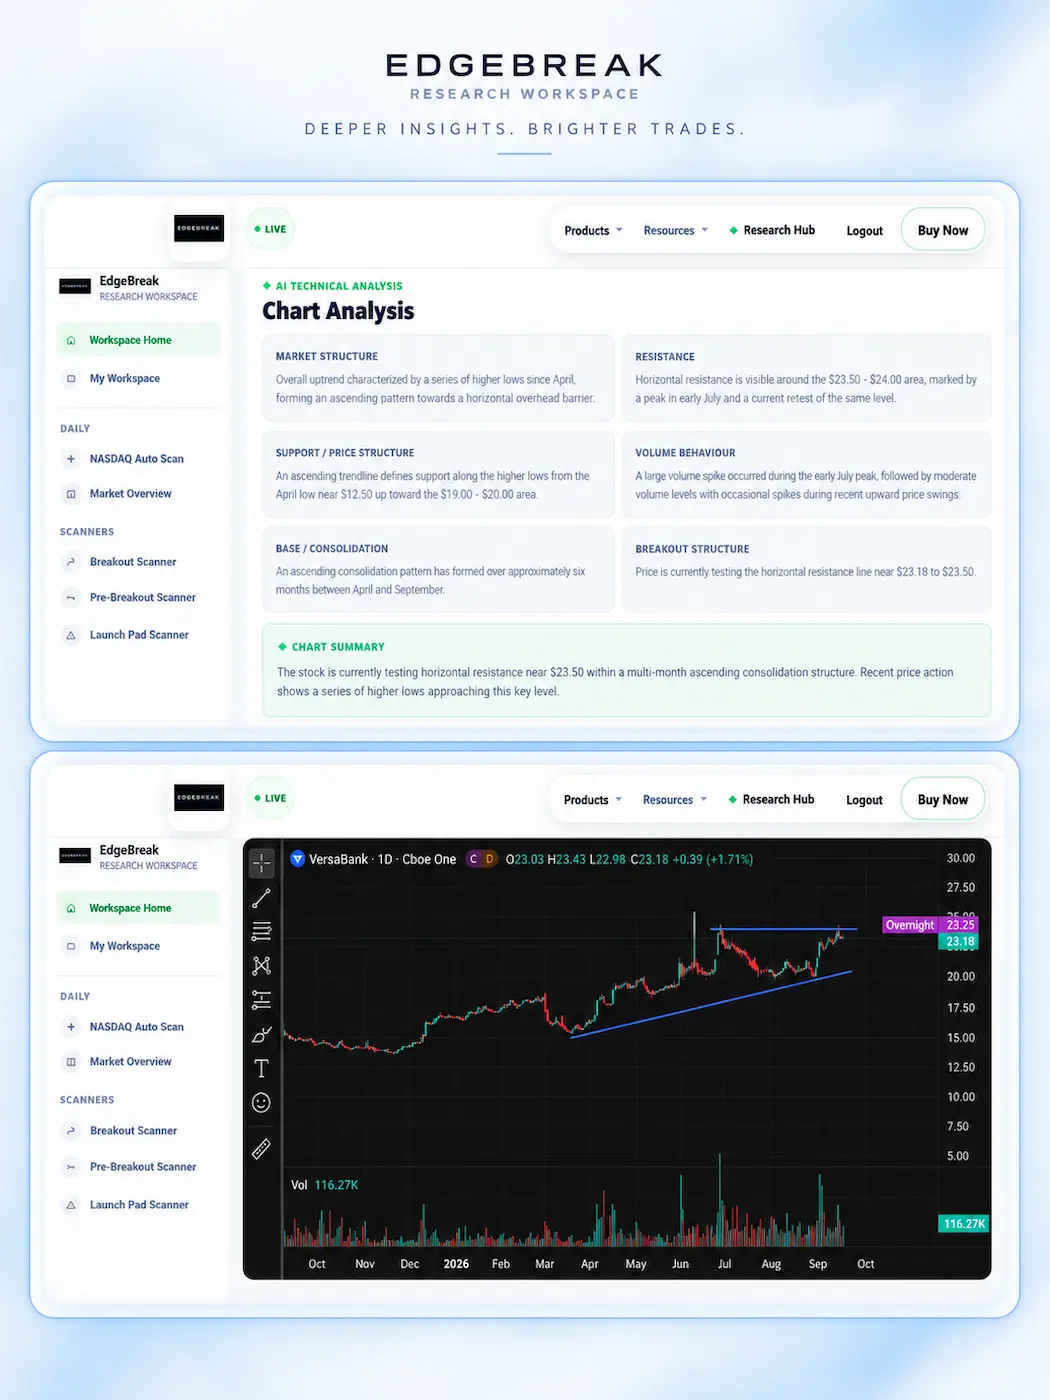
An AI stock chart analyzer is a tool designed to examine a stock chart and provide observations about the visible technical structure. Instead of requiring the user to manually describe every price level or pattern, the AI can analyse the chart image itself and organise what it sees into a clearer explanation.
The purpose is not to replace technical analysis. The analyzer can help identify visible characteristics such as support, resistance, trend direction, consolidation, breakout structure and volume so the investor has a more structured starting point for further research.
How does it analyse the chart?
Visual AI systems can examine an uploaded screenshot or chart image and look for recurring price behaviour. This may include areas where price repeatedly reacts, whether highs and lows are rising or falling, whether price is tightening inside a range, and how volume behaves around important technical levels.
The output should be treated as a description of the visible evidence rather than a forecast of what price will do next.
Support and resistance
Support and resistance are among the most common areas investors investigate on technical charts. An AI analyzer can help identify price areas where the market has repeatedly reacted and explain why those levels may be relevant to the current structure.
Repeated interaction with the same area can provide context, but the level should still be treated as part of the broader structure rather than a guaranteed turning point.
Trend and market structure
The analyzer can also examine whether price is developing higher highs and higher lows, lower highs and lower lows, or a more neutral trading range. These characteristics help describe whether the stock is trending, consolidating or beginning to change structure.
Looking at the relationship between highs and lows is often more useful than focusing on one candle in isolation.
Consolidation and breakout structures
Stocks often spend time trading within ranges before a larger directional move occurs. An AI chart analyzer can help identify repeated resistance testing, rising support, tightening price behaviour and existing breakout attempts.
These observations can make a chart easier to investigate, but they should not be interpreted as a guarantee that a breakout is about to happen.
Volume behaviour
Volume adds another layer of context because it shows how actively shares are being traded. An analyzer can describe whether visible volume is expanding, contracting or changing around support, resistance and breakout areas.
Volume is most useful when interpreted alongside price structure rather than as a standalone signal.
Final thoughts
AI stock chart analyzers can make technical analysis easier to access by turning visible chart characteristics into a clearer explanation of what price is doing.
Their strongest value is descriptive rather than predictive. Support, resistance, trends, consolidation, breakout structure and volume can all be investigated without pretending the chart provides certainty about future outcomes.
Used inside a broader research process, an AI chart analyzer can help investors move from simply looking at a chart to understanding which technical characteristics deserve closer attention.