Mastering My Workspace
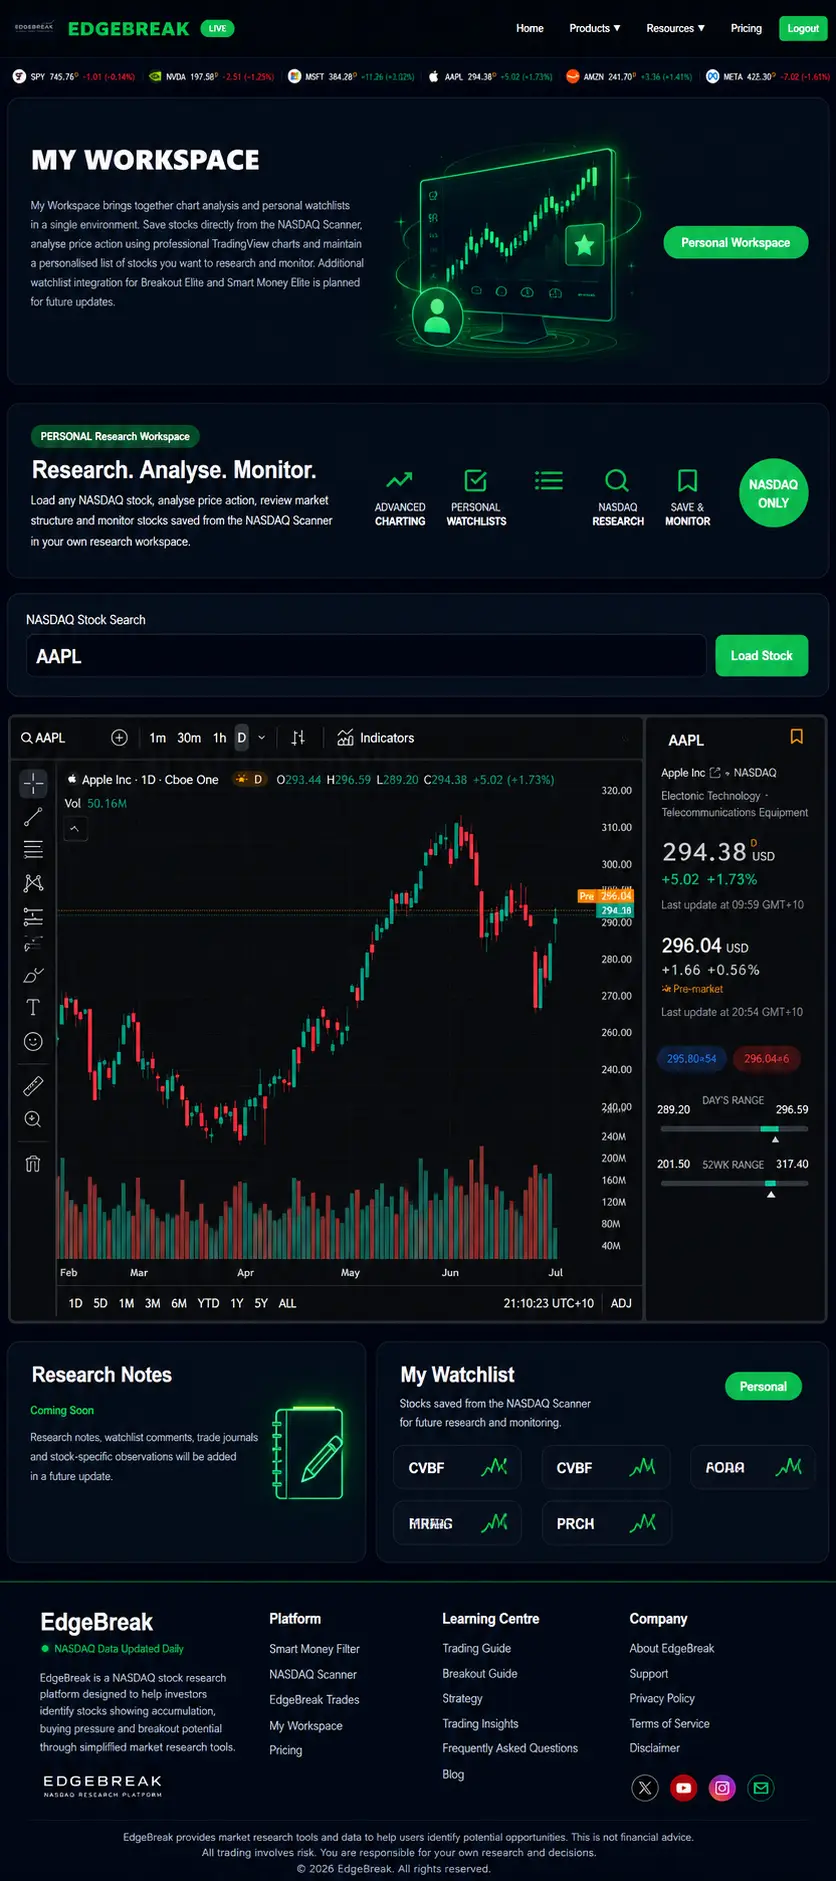
My Workspace is your personal research hub within EdgeBreak. It allows you to organise watchlists, analyse charts, monitor developing market structures and build a consistent research routine. Rather than repeatedly searching the market for the same opportunities, My Workspace keeps your research organised in one convenient location.
What You'll Learn
- How My Workspace is organised.
- Managing your research watchlist.
- Using the interactive TradingView chart.
- Developing a daily research routine.
- Monitoring market structure over time.
Your Personal Research Hub
My Workspace has been designed to become the centre of your EdgeBreak research process.
Every stock you save from the NASDAQ Scanner or Breakout Scanner is stored here, allowing you to monitor developing market behaviour without searching for the same companies each day.
Think of My Workspace as your own organised research library.
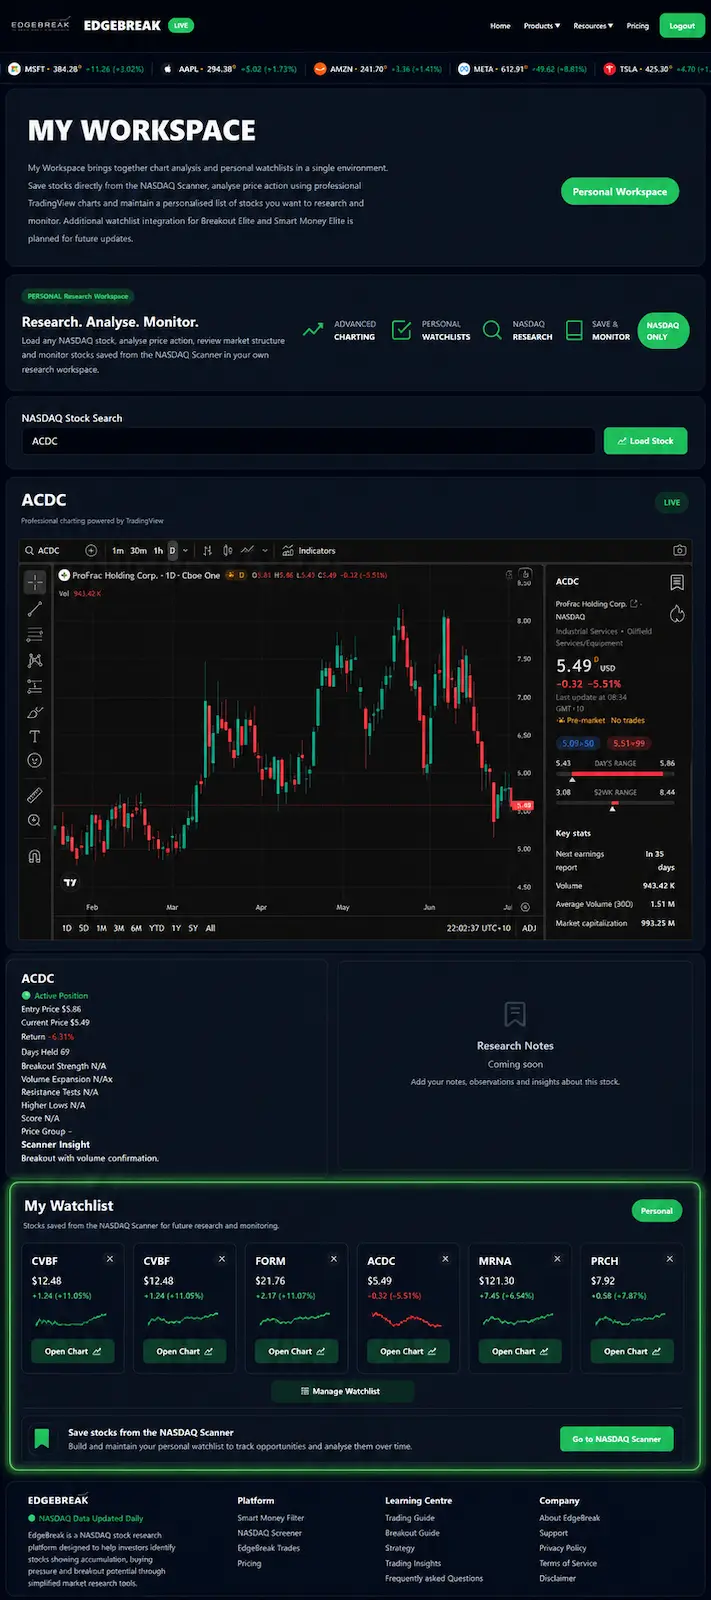
Managing Your Watchlist
Your watchlist should contain stocks that genuinely deserve continued research.
Rather than saving every interesting chart, aim to build a focused collection of companies displaying organised market structure, higher lows and well-defined resistance.
Review your watchlist regularly and remove stocks that no longer fit your research criteria.
A smaller, high-quality watchlist is often far more useful than one containing hundreds of symbols.
Opening Charts
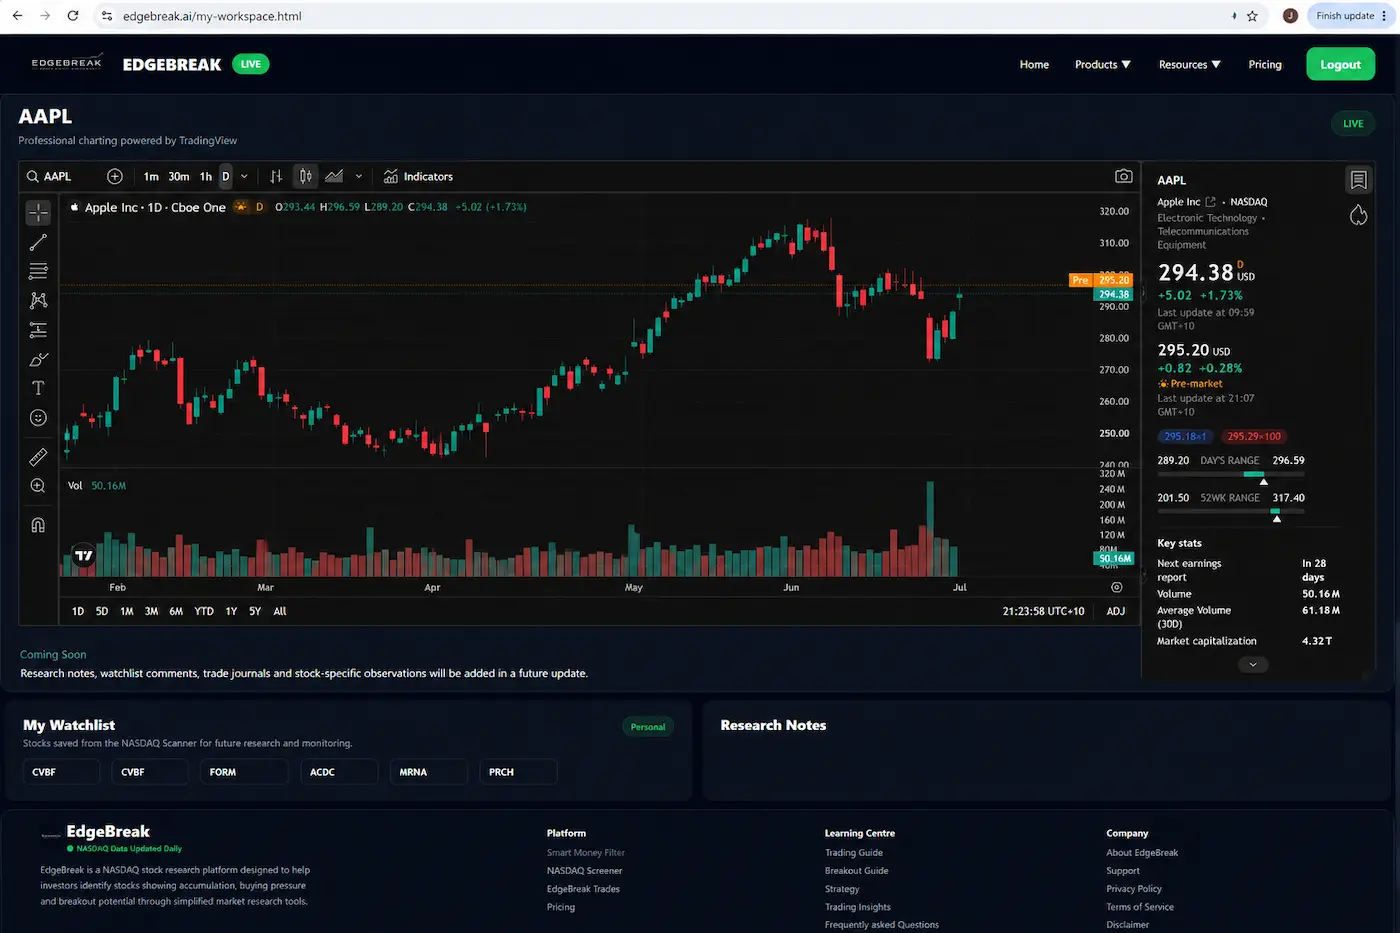
Selecting a stock from your watchlist automatically loads its TradingView chart.
This allows you to immediately review:
- Market structure.
- Resistance levels.
- Higher lows.
- Volume behaviour.
- Weekly and daily trends.
- Overall breakout quality.
Because the chart updates instantly, moving between research candidates becomes quick and efficient.
Using TradingView Tools
The integrated TradingView chart includes professional charting tools that allow you to perform your own technical analysis.
Members can draw support and resistance levels, identify trend lines, measure price movement and switch between different chart timeframes.
These tools encourage independent research and help visualise developing market structure.
Reviewing Market Structure
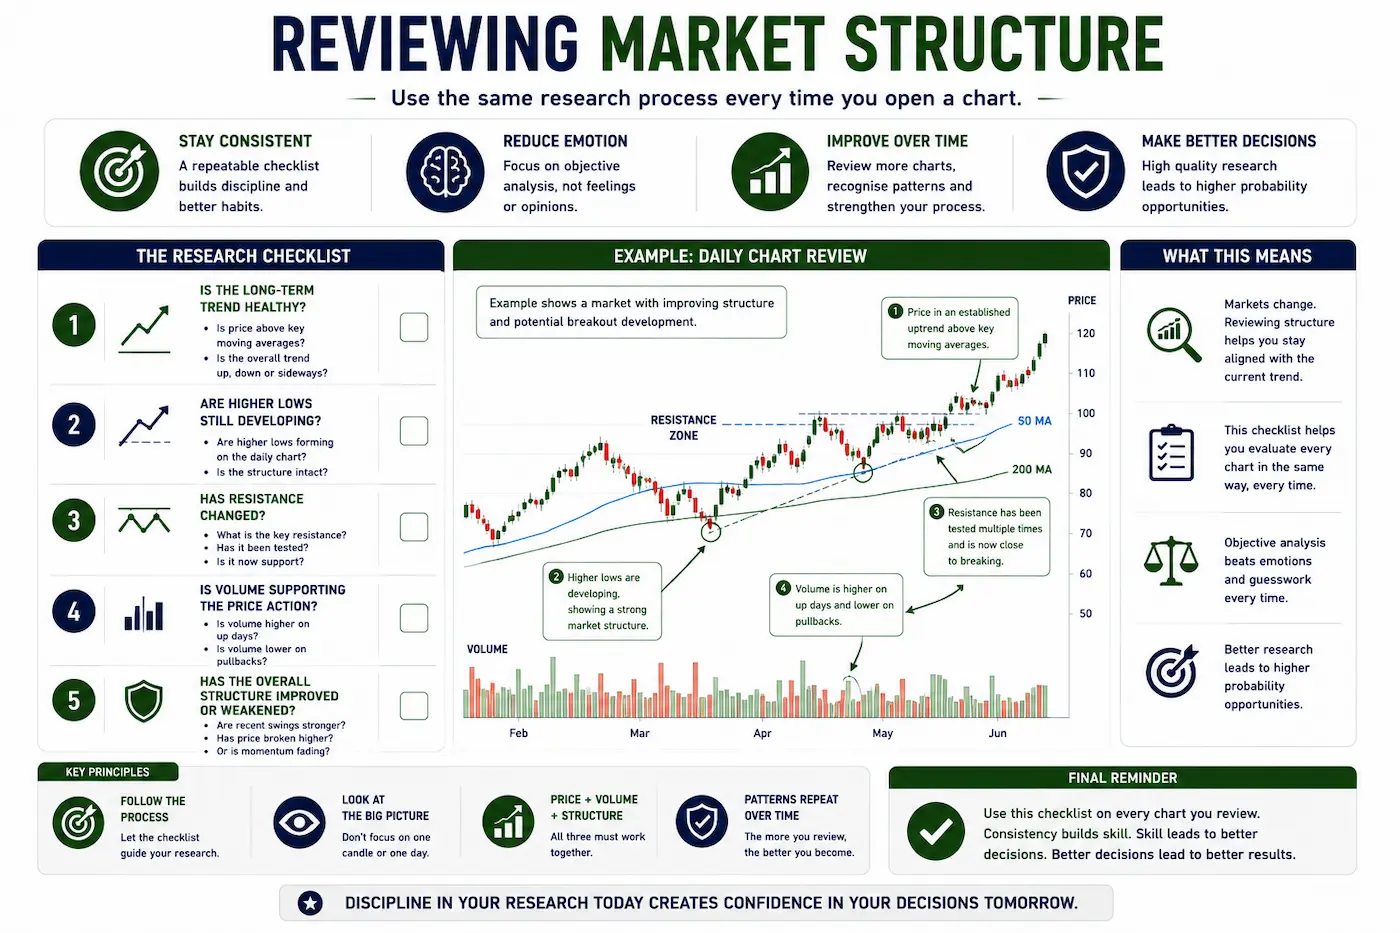
Each time you open a chart, work through the same research process.
- Is the long-term trend healthy?
- Are higher lows still developing?
- Has resistance changed?
- Is volume supporting the price action?
- Has the overall structure improved or weakened?
Following the same checklist every time helps build consistency and reduces emotional decision-making.
Keeping Your Watchlist Organised
Markets change every day.
Some stocks will continue developing while others lose momentum or break their previous market structure.
Make it a habit to review your watchlist each week, removing research candidates that no longer deserve attention and replacing them with stronger opportunities identified through the scanners.
Your watchlist should evolve alongside the market.
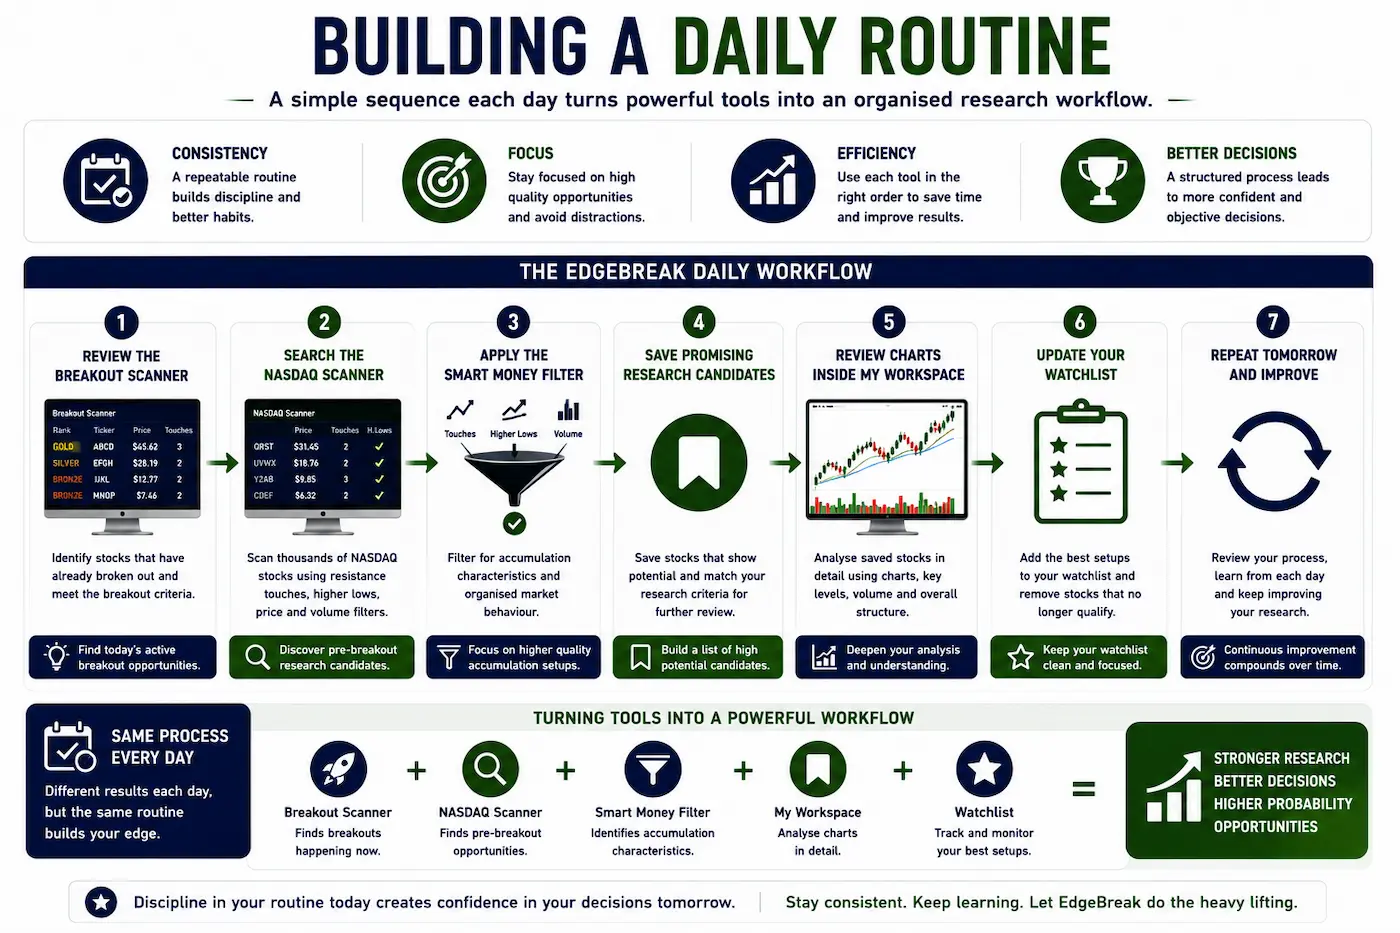
Building a Daily Routine
Many members find it helpful to follow the same sequence each day.
- Review the Breakout Scanner.
- Search the NASDAQ Scanner.
- Apply the Smart Money Filter.
- Save promising research candidates.
- Review charts inside My Workspace.
- Update your watchlist.
This routine helps transform individual tools into one organised research workflow.
Preparing for Future Features
My Workspace will continue expanding as EdgeBreak evolves.
Future updates may include additional research tools, enhanced note-taking, performance tracking and further workflow improvements, making My Workspace an even more powerful research environment.
Your watchlist will remain the foundation of this personalised research experience.
Lesson Summary
My Workspace brings together your watchlist, TradingView charts and research workflow into one organised environment. By regularly reviewing market structure, updating your watchlist and maintaining a consistent research routine, members can build a personalised research process that evolves alongside the market.
Key Takeaways
- Use My Workspace as your personal research hub.
- Keep your watchlist focused on quality research candidates.
- Review charts regularly using TradingView.
- Update your watchlist as market conditions change.
- Follow a consistent daily research routine.
Practical Exercise
Spend 30 minutes organising your research inside My Workspace.
- Review every stock currently saved.
- Open each TradingView chart.
- Check the weekly and daily market structure.
- Remove any stocks that no longer fit your research criteria.
- Add two new research candidates from today's NASDAQ Scanner results.
Congratulations!
You've now completed Module 4 – Mastering EdgeBreak.
You understand how every major component of the platform works, including the NASDAQ Scanner, Breakout Scanner, Smart Money Filter and My Workspace.
You're now ready to begin applying these tools to real market examples while continuing to build a structured, repeatable research process.
Research Reminder
EdgeBreak is an educational research platform designed to help members organise and analyse market information. The platform does not provide financial advice, investment recommendations or guarantees of future market performance. Always conduct your own independent research before making financial decisions.
Congratulations!
Lesson 5.1 – Analysing a Successful Breakout
Put everything you've learned into practice by analysing a real breakout from start to finish. You'll see how market structure, resistance, higher lows, volume and accumulation come together in the complete EdgeBreak research process.