Analysing a Successful Breakout
Throughout the Academy you've learned the individual characteristics commonly associated with quality breakout structures. In this lesson we'll combine those concepts by analysing a real breakout from beginning to end. Rather than focusing only on the breakout itself, we'll study how the market structure developed over time and identify the characteristics that made the stock worthy of further research.
What You'll Learn
- How to analyse a breakout from start to finish.
- Recognising accumulation before expansion.
- Identifying higher-quality market structure.
- Reviewing volume and resistance together.
- Applying the complete EdgeBreak research process.
Start Before the Breakout
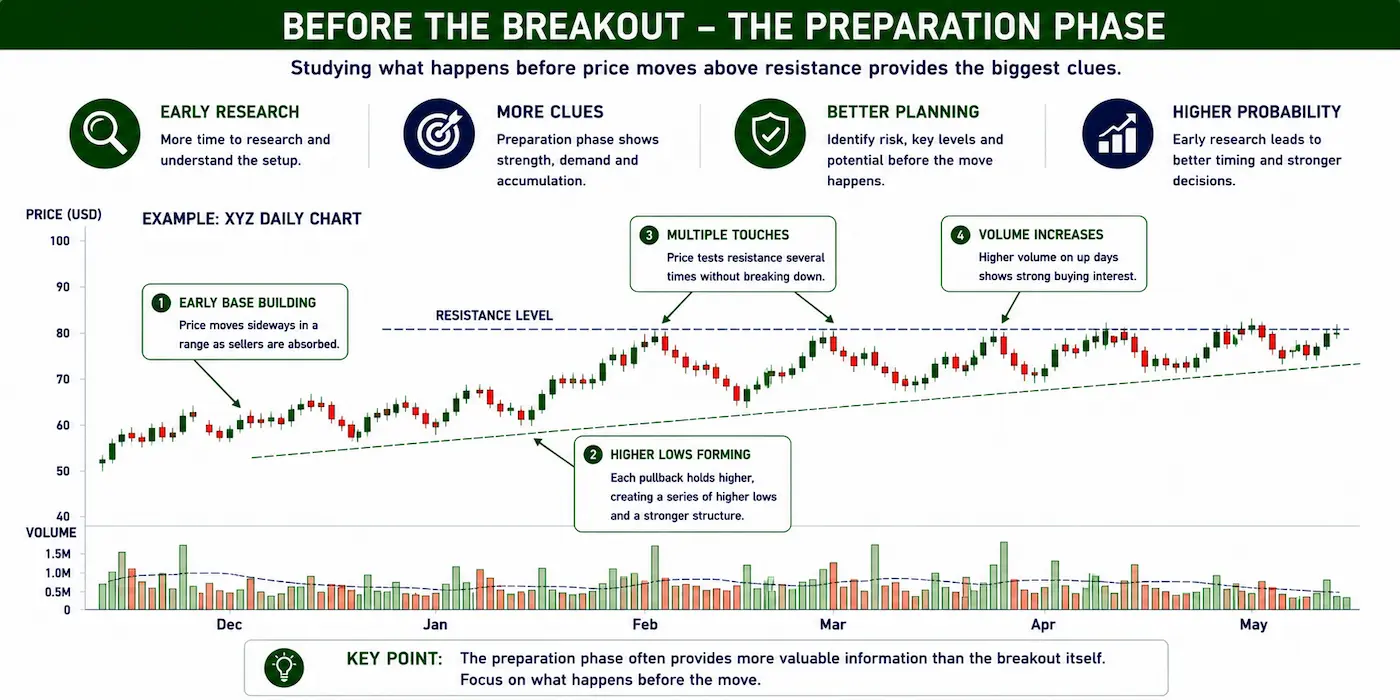
One of the biggest mistakes newer investors make is beginning their analysis after a breakout has already occurred.
EdgeBreak encourages members to study what happened before price moved above resistance.
The preparation phase often provides more valuable information than the breakout itself.
Step 1 – Identify the Market Structure
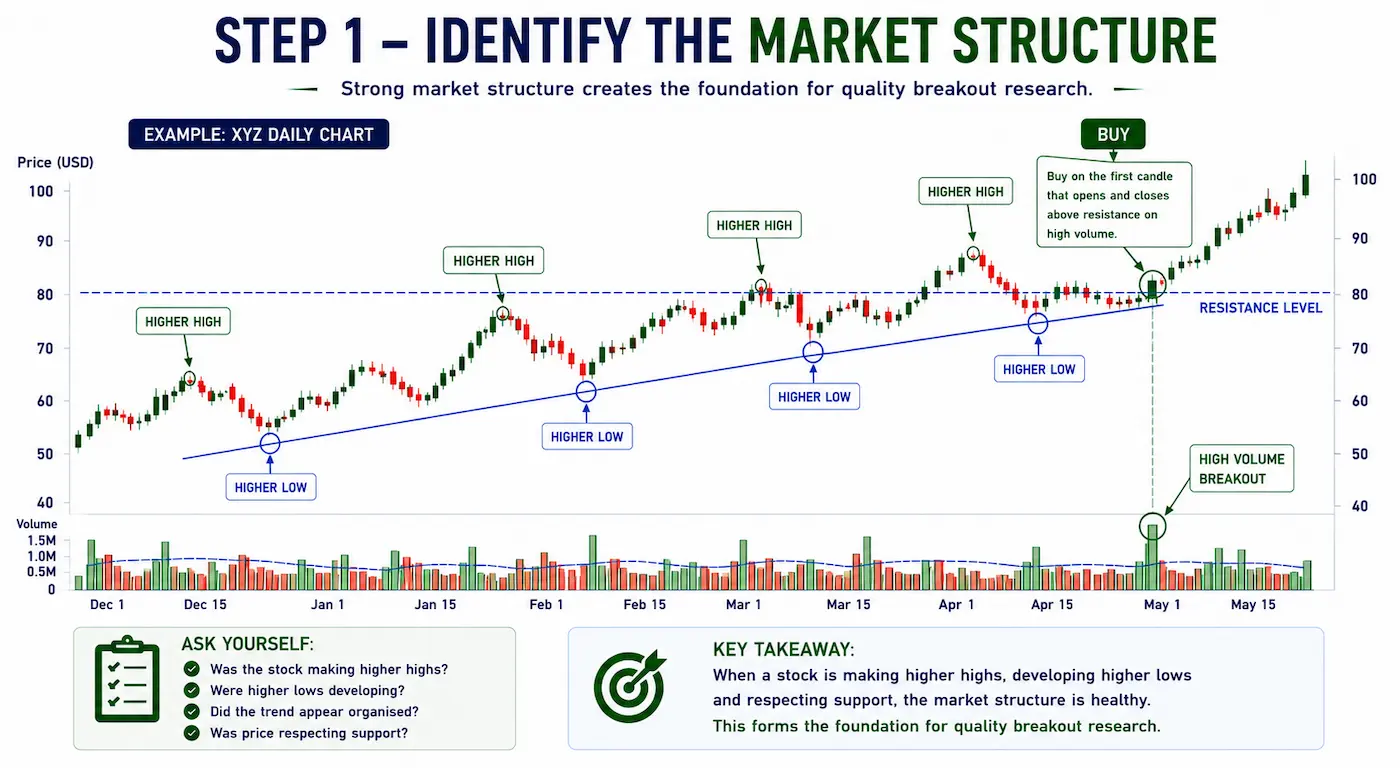
Begin by reviewing the overall trend.
Ask yourself:
- Was the stock making higher highs?
- Were higher lows developing?
- Did the trend appear organised?
- Was price respecting support?
Strong market structure creates the foundation for quality breakout research.
Step 2 – Locate Resistance
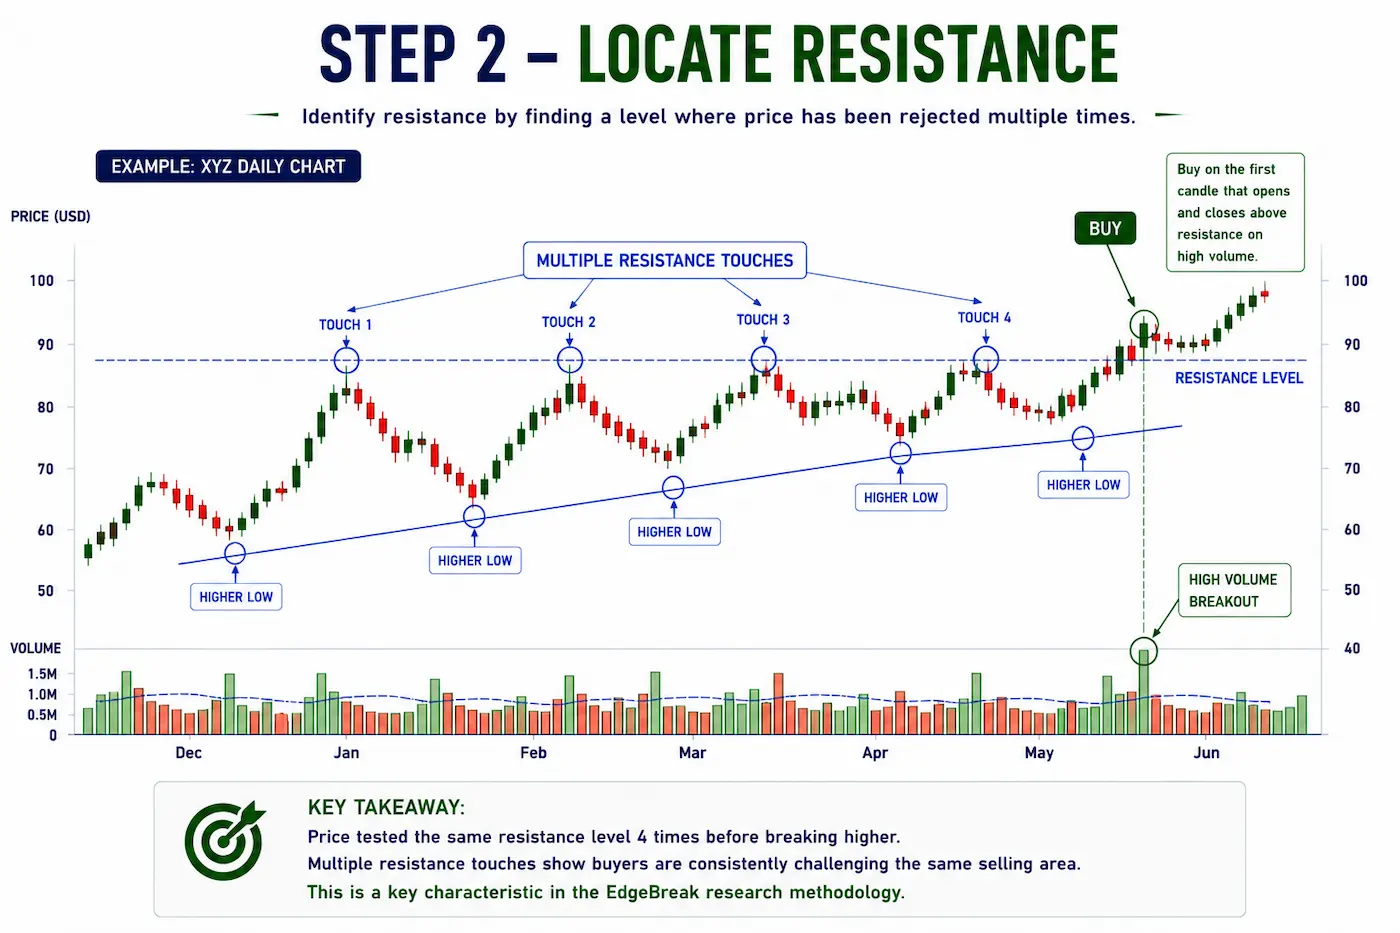
Next, identify the resistance level.
Notice how price tested the same level multiple times before finally breaking higher.
Each resistance touch demonstrates buyers continuing to challenge the same selling area.
Multiple resistance tests are one of the key characteristics used throughout the EdgeBreak research methodology.
Step 3 – Review Higher Lows
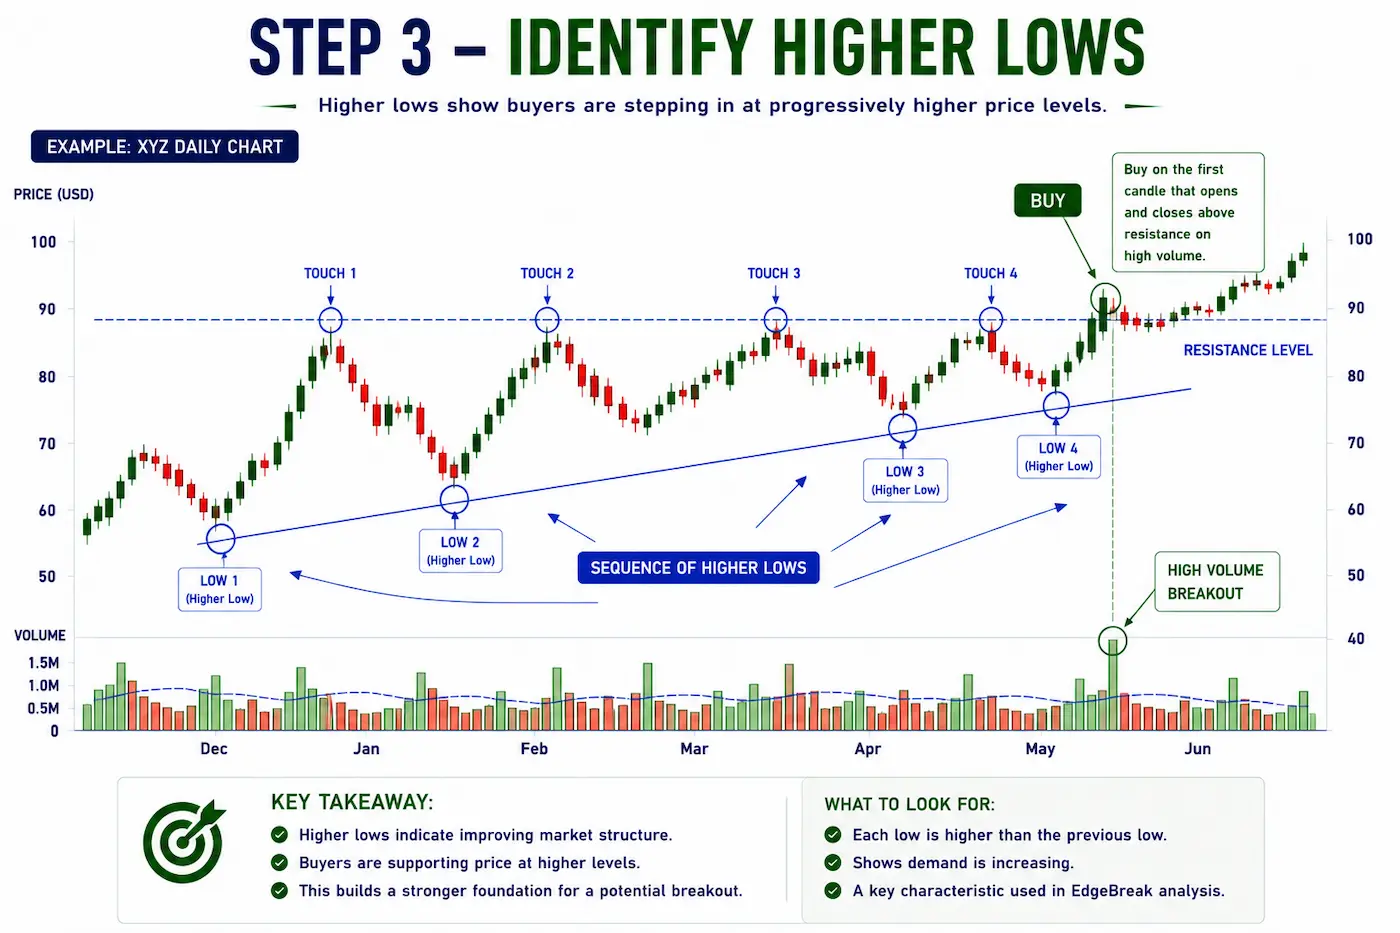
Between each resistance test, buyers gradually supported higher prices.
These higher lows reduced the distance sellers could push price lower after each rejection.
This combination of rising demand beneath flat resistance often creates organised breakout structures.
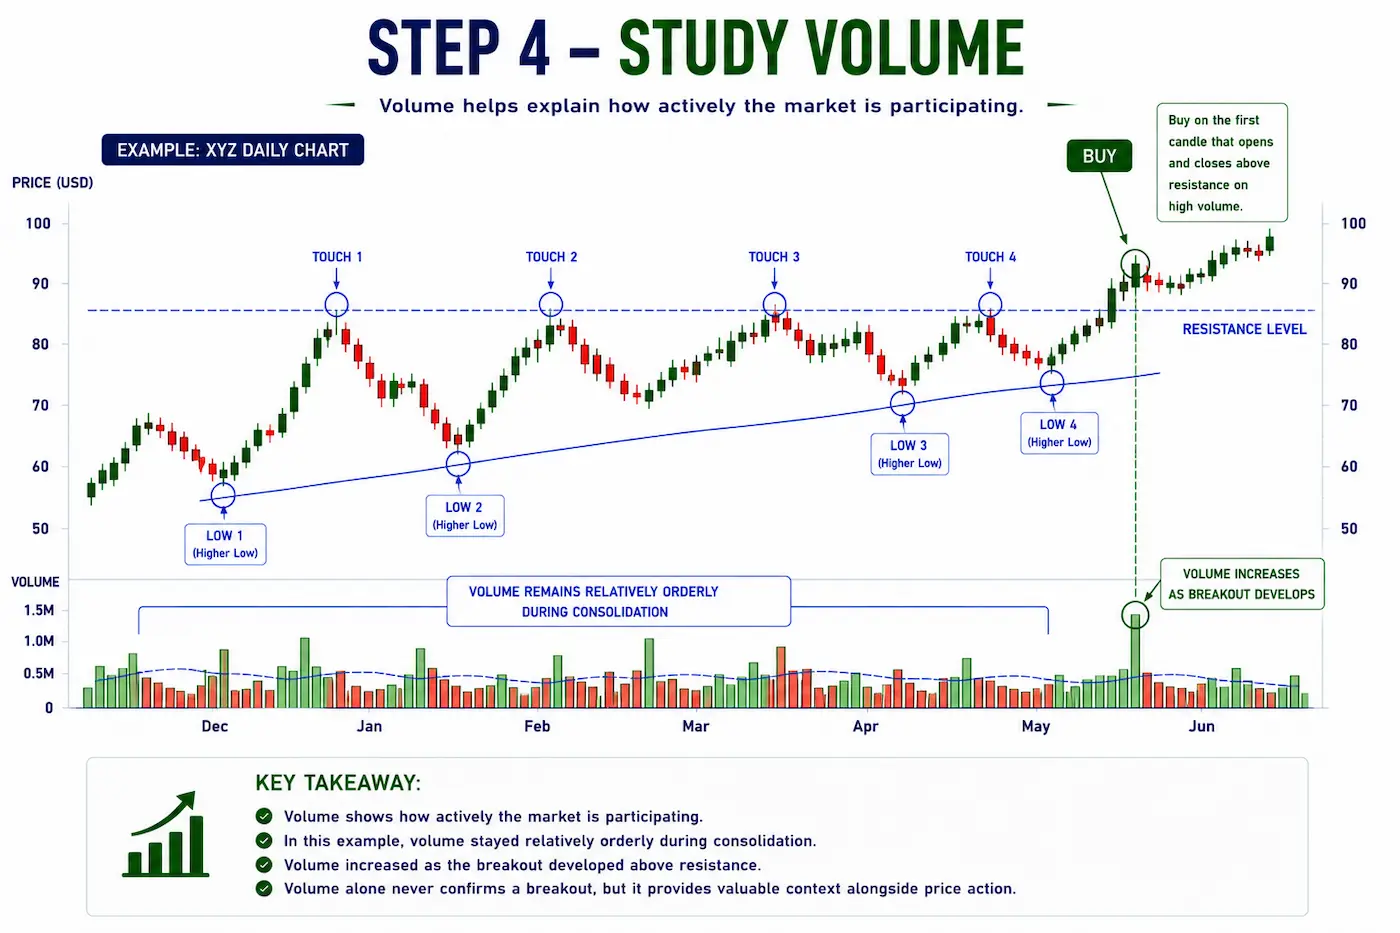
Step 4 – Study Volume
Volume helps explain how actively the market is participating.
During this example, volume remained relatively orderly throughout consolidation before increasing as the breakout developed.
Volume alone never confirms a breakout, but it provides valuable context when considered alongside price action.
Step 5 – Look for Accumulation
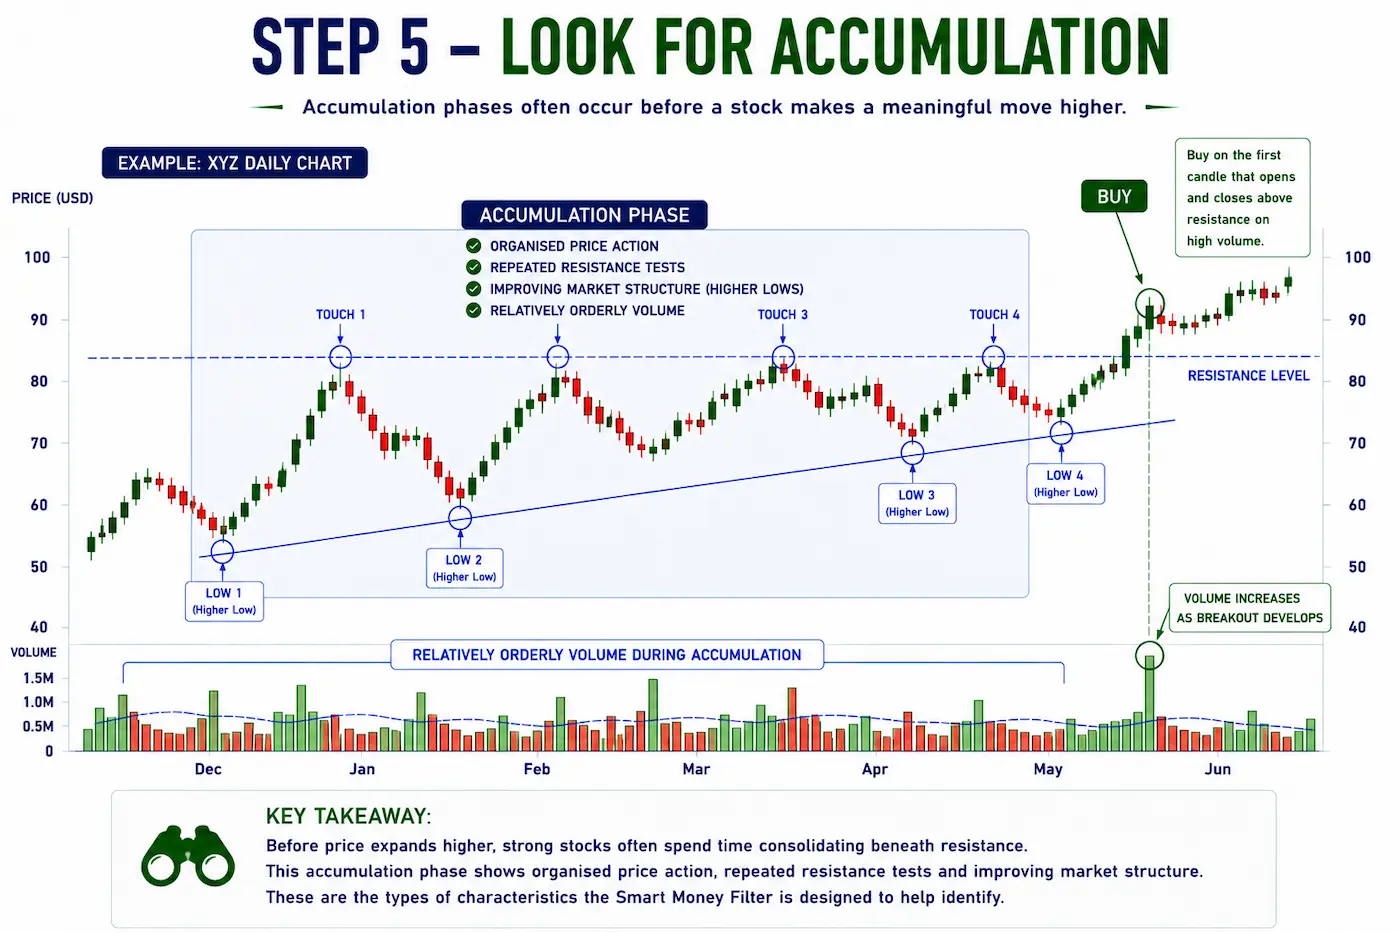
Before price expanded higher, the stock spent considerable time consolidating beneath resistance.
This period displayed several characteristics commonly associated with accumulation, including organised price action, repeated resistance tests and improving market structure.
These are the types of characteristics the Smart Money Filter is designed to help identify.
Step 6 – The Breakout
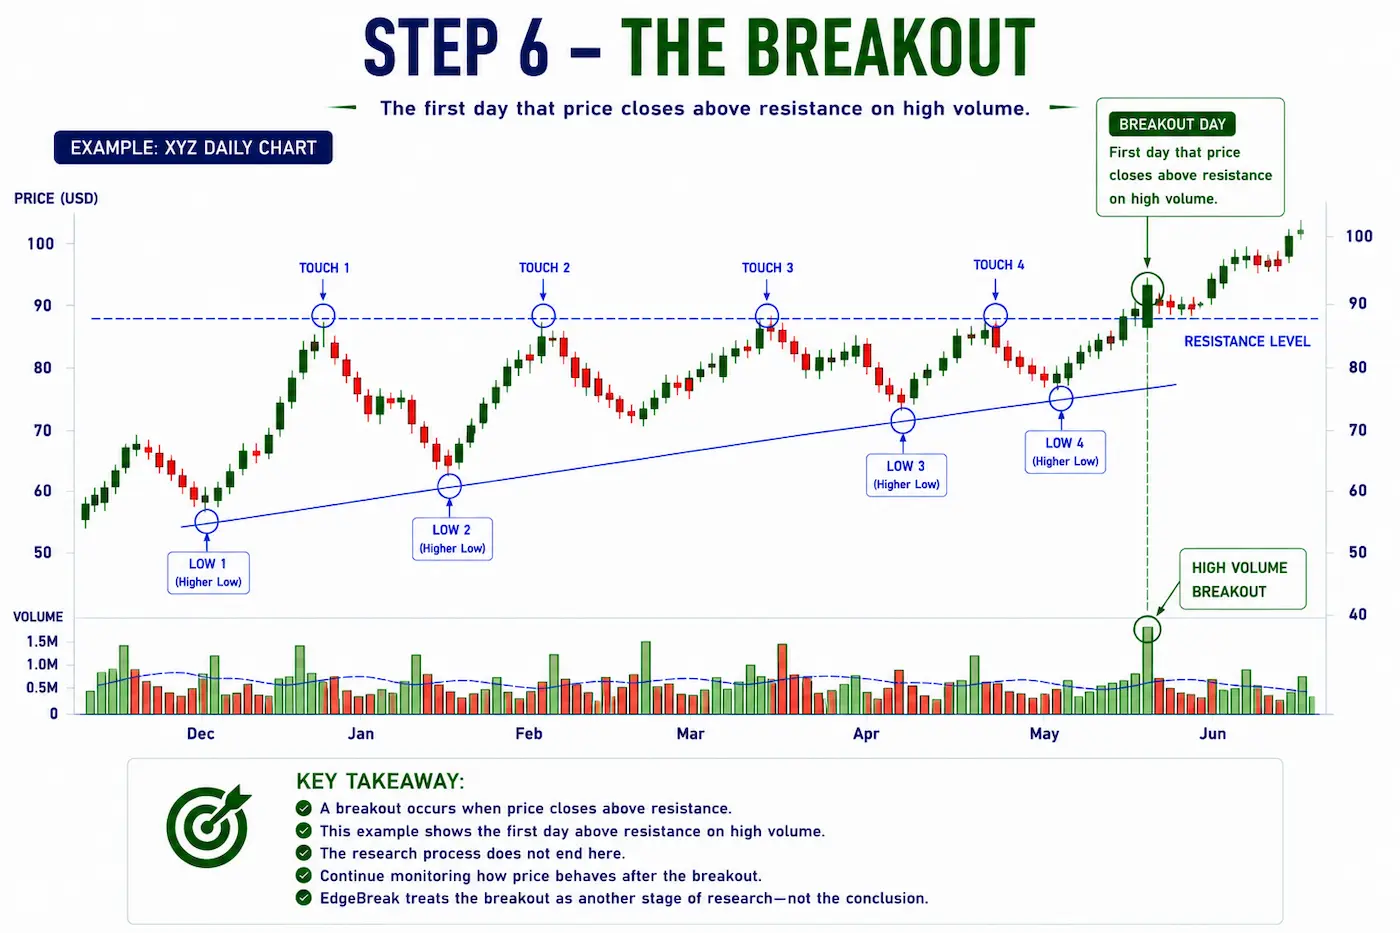
Eventually price closed above resistance, completing the breakout.
At this stage the research process does not end.
Continue monitoring how price behaves after the breakout rather than assuming every breakout will continue higher.
EdgeBreak treats the breakout as another stage of research—not the conclusion.
Would EdgeBreak Have Found This?
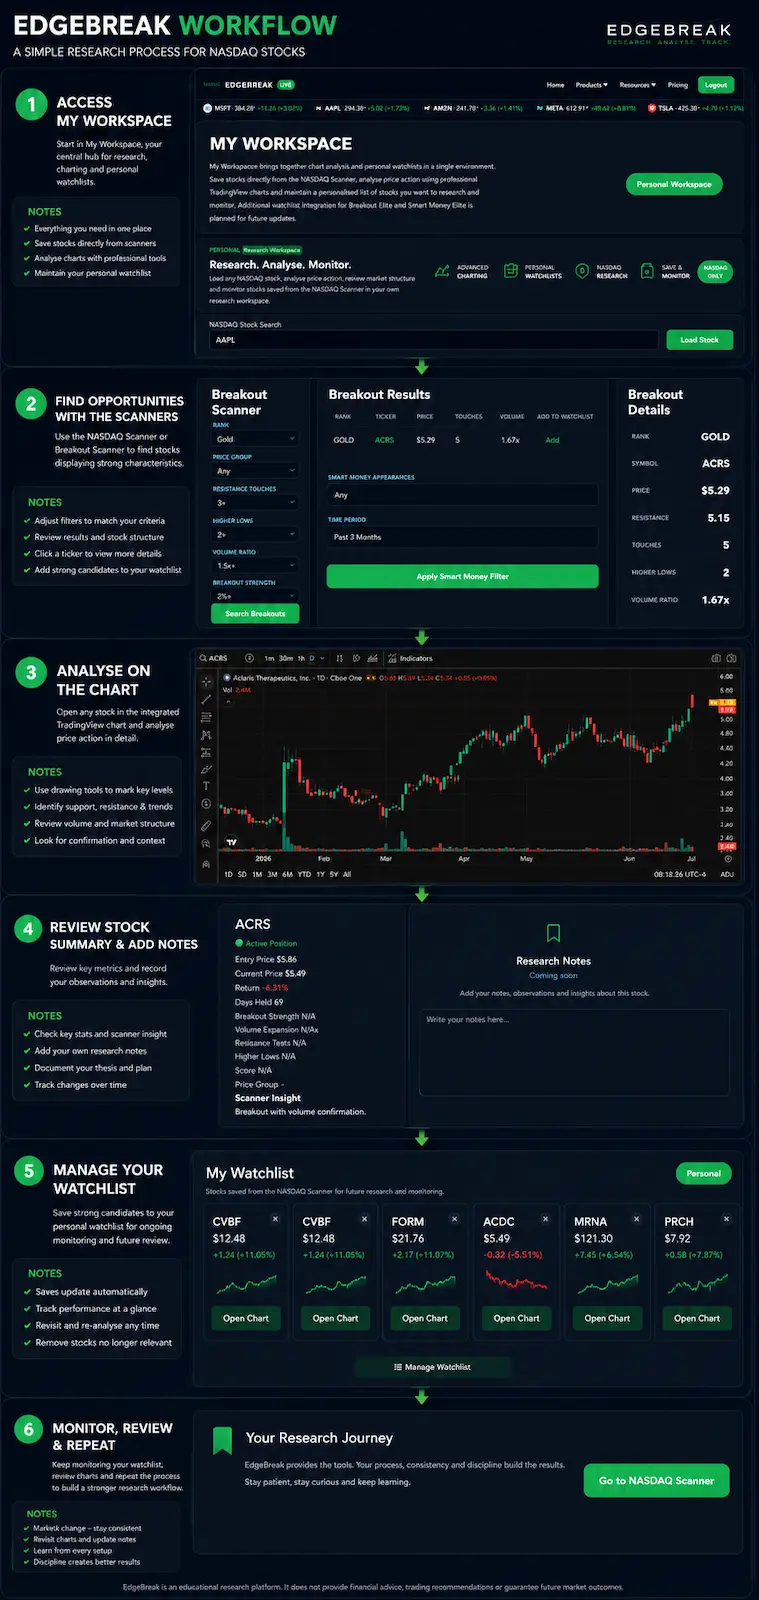
Looking back through the chart, ask yourself which EdgeBreak tools would have highlighted this opportunity.
- NASDAQ Scanner
- Higher Lows Filter
- Resistance Touches
- Smart Money Filter
- Breakout Scanner
- My Workspace
This exercise helps reinforce how each tool contributes to the overall research process.
Key Lessons
The breakout itself was only one part of the story.
The market structure, higher lows, resistance tests, orderly consolidation and volume behaviour all developed before price moved above resistance.
Understanding these earlier stages helps investors build stronger research habits and recognise similar opportunities in the future.
Lesson Summary
Successful breakout research begins long before price breaks above resistance. By studying market structure, accumulation, higher lows, resistance behaviour and volume together, investors can better understand how organised breakout structures develop over time. EdgeBreak combines these characteristics into one structured research workflow designed to support independent market analysis.
Key Takeaways
- Study the chart before the breakout.
- Strong market structure develops gradually.
- Multiple resistance touches strengthen research.
- Higher lows demonstrate improving demand.
- Use every EdgeBreak tool together as one research process.
Practical Exercise
Open a recent Gold breakout from the EdgeBreak Breakout Scanner.
- Mark the resistance level.
- Count the resistance touches.
- Identify the higher lows.
- Review the volume behaviour.
- Explain why the breakout qualified as a strong research candidate.
Research Reminder
This lesson is intended to improve pattern recognition and market research skills. Historical examples are provided for educational purposes only and should not be interpreted as investment recommendations or evidence of future market performance.
Continue Your Journey
Lesson 5.2 – Analysing a Failed Breakout
Learn why some breakout structures fail, recognise common warning signs and discover how reviewing unsuccessful examples can improve your future market research.