Analysing a Failed Breakout
Not every breakout develops into a sustained trend. In fact, studying failed breakouts is one of the most valuable ways to improve your market research. This lesson examines how breakout structures can weaken after moving above resistance and demonstrates why ongoing research is just as important after the breakout as it is before it.
What You'll Learn
- Why some breakouts fail.
- How market structure can change.
- Recognising early warning signs.
- Reviewing failed research objectively.
- Improving future market analysis.
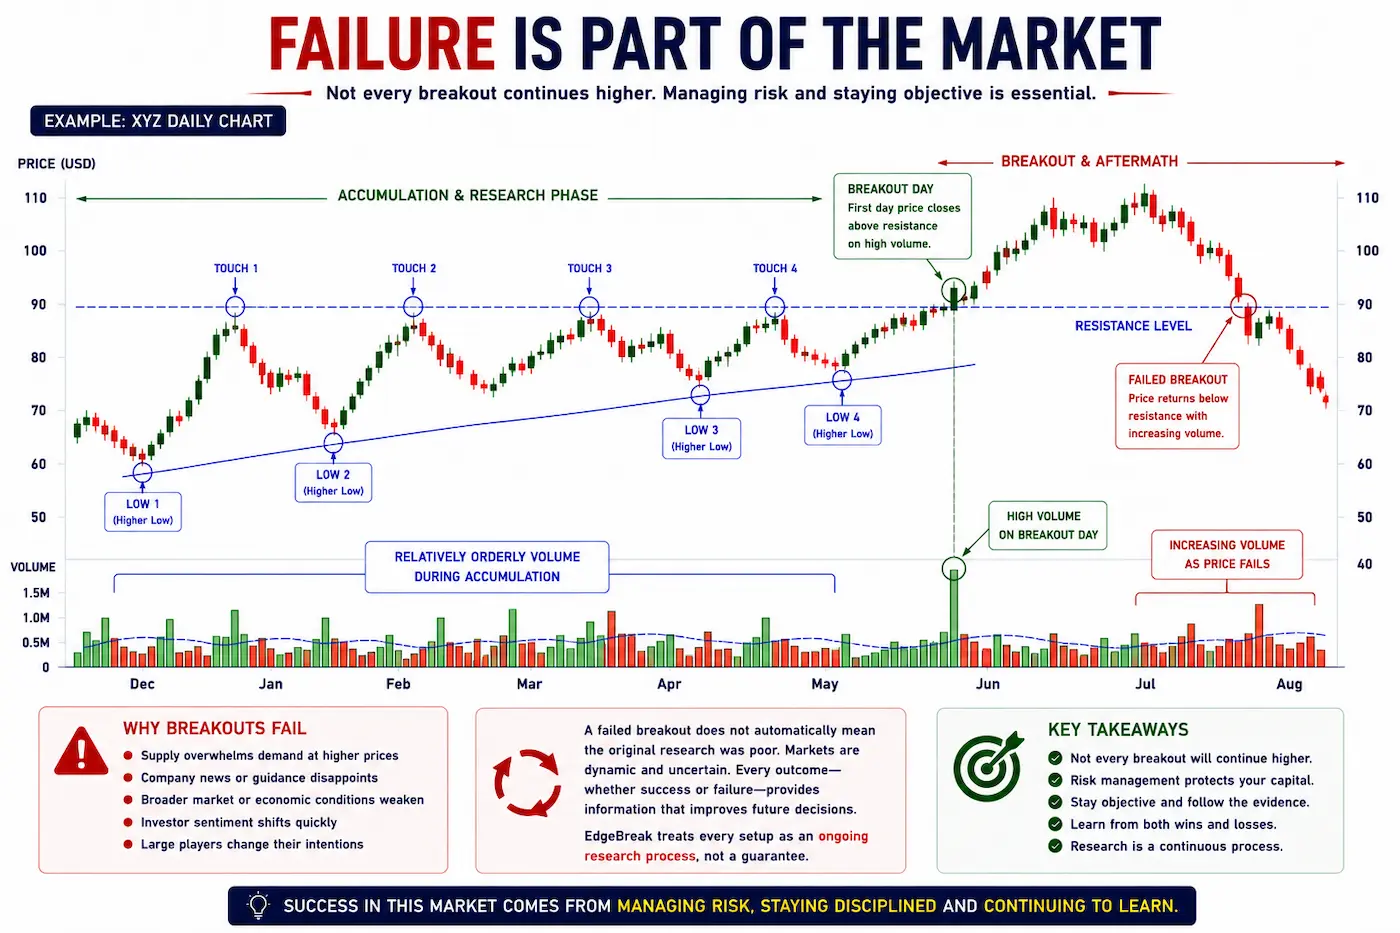
Failure Is Part of the Market
Every experienced investor understands that not every breakout continues higher.
Markets are influenced by changing supply and demand, company announcements, broader economic conditions and investor sentiment.
A failed breakout does not necessarily mean the original research was poor. Instead, it reminds us that markets remain uncertain and that research is an ongoing process.
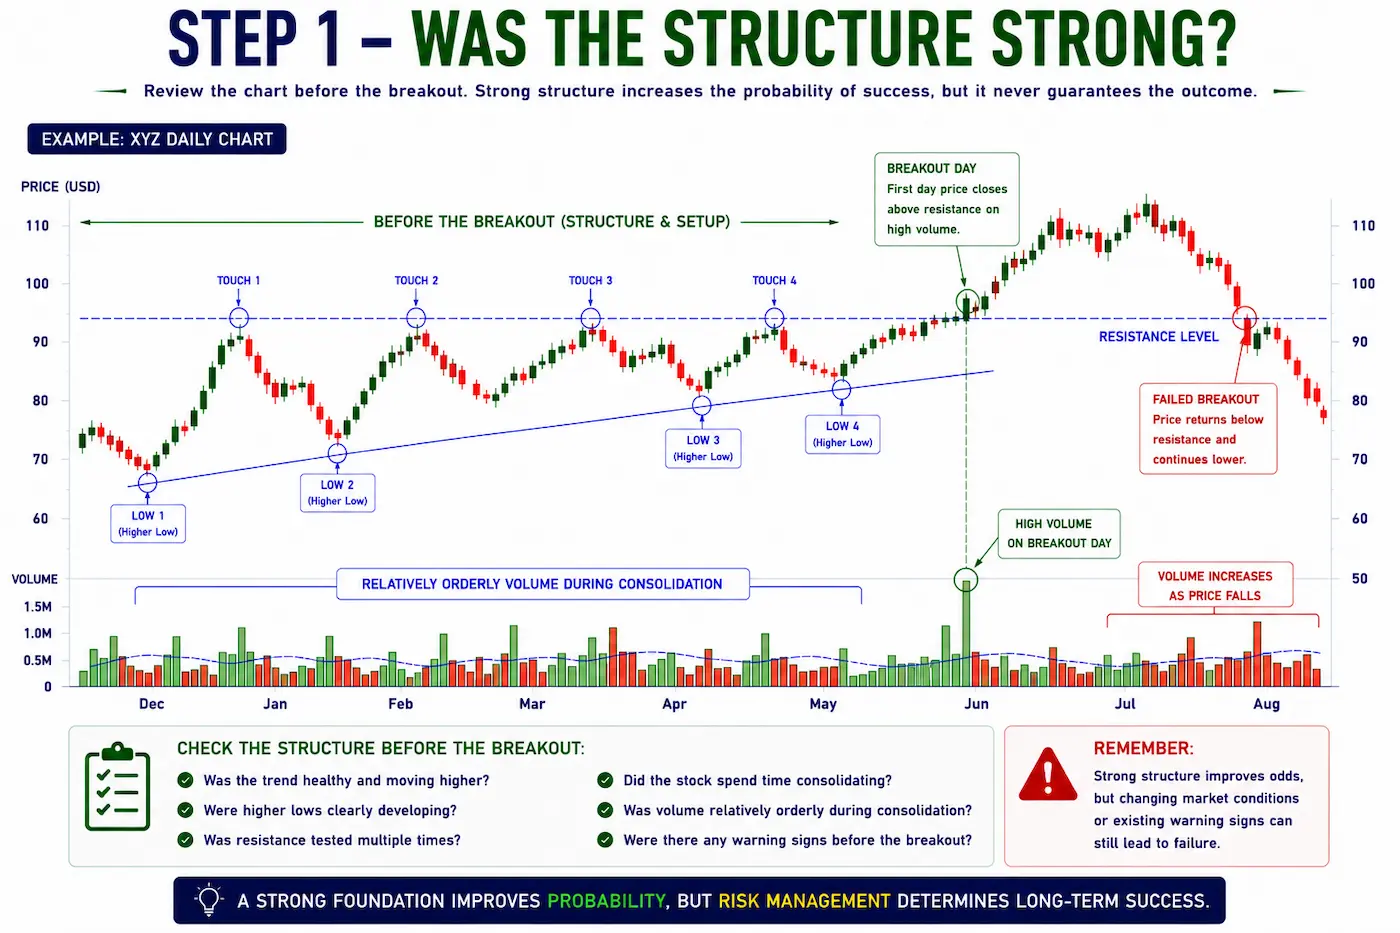
Step 1 – Was the Structure Strong?
Begin by reviewing the chart before the breakout occurred.
Ask yourself:
- Was the trend healthy?
- Were higher lows developing?
- Was resistance clearly defined?
- Did the stock spend time consolidating?
Sometimes the structure was strong, but market conditions changed afterwards.
Other times, warning signs were already visible before the breakout occurred.
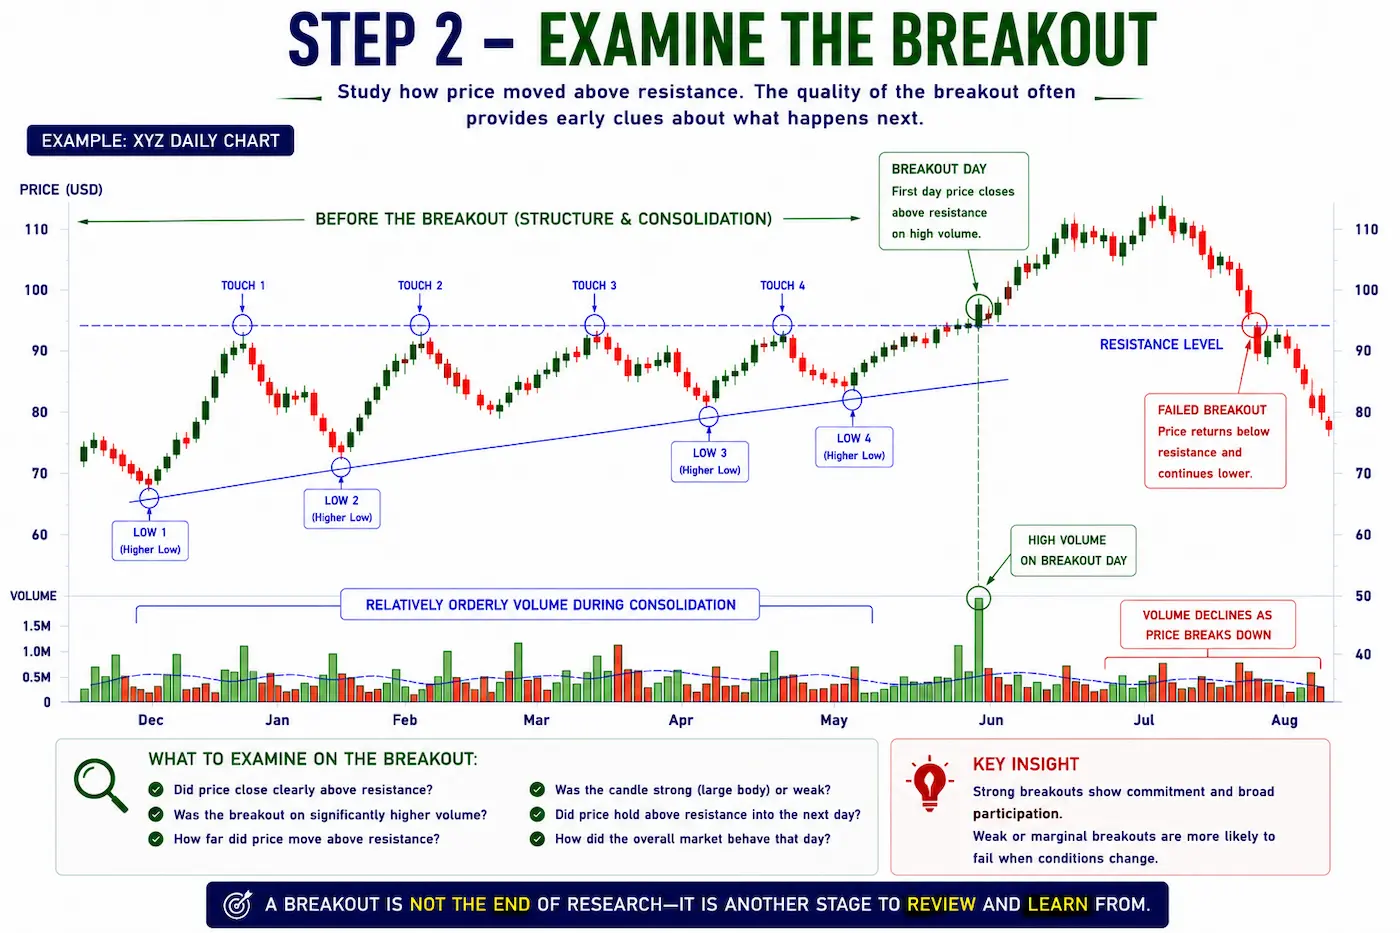
Step 2 – Examine the Breakout
Study how price moved above resistance.
Did the breakout occur with strong participation, or did price only move marginally above resistance before losing momentum?
Understanding how the breakout unfolded provides valuable context for reviewing the overall research process.
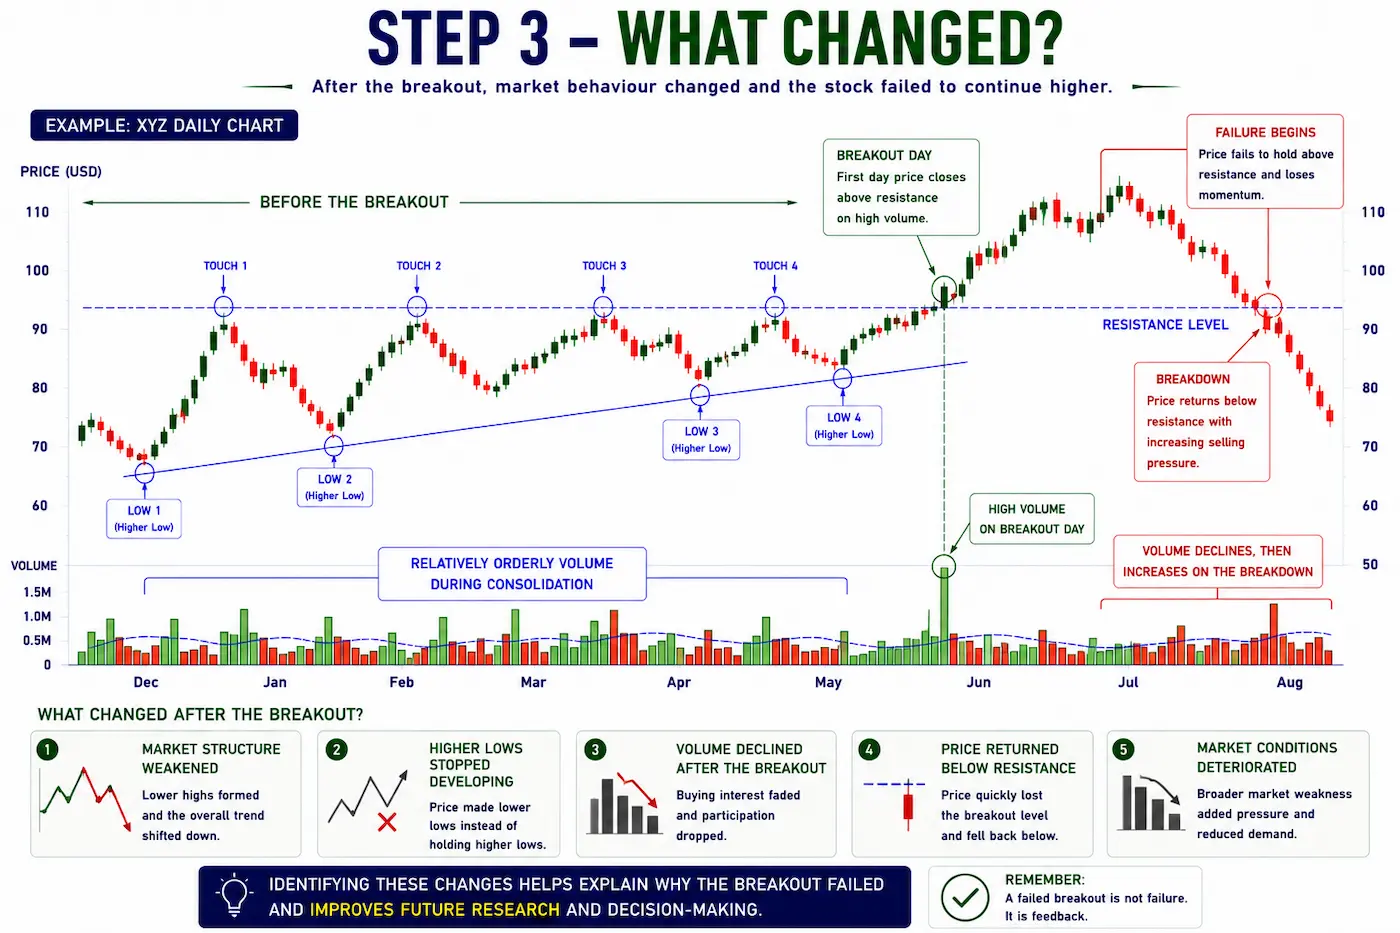
Step 3 – What Changed?
After the breakout, review how market behaviour evolved.
Consider whether:
- Market structure weakened.
- Higher lows stopped developing.
- Volume declined.
- Price quickly returned below resistance.
- Broader market conditions deteriorated.
Identifying these changes helps explain why the breakout failed.
Warning Signs
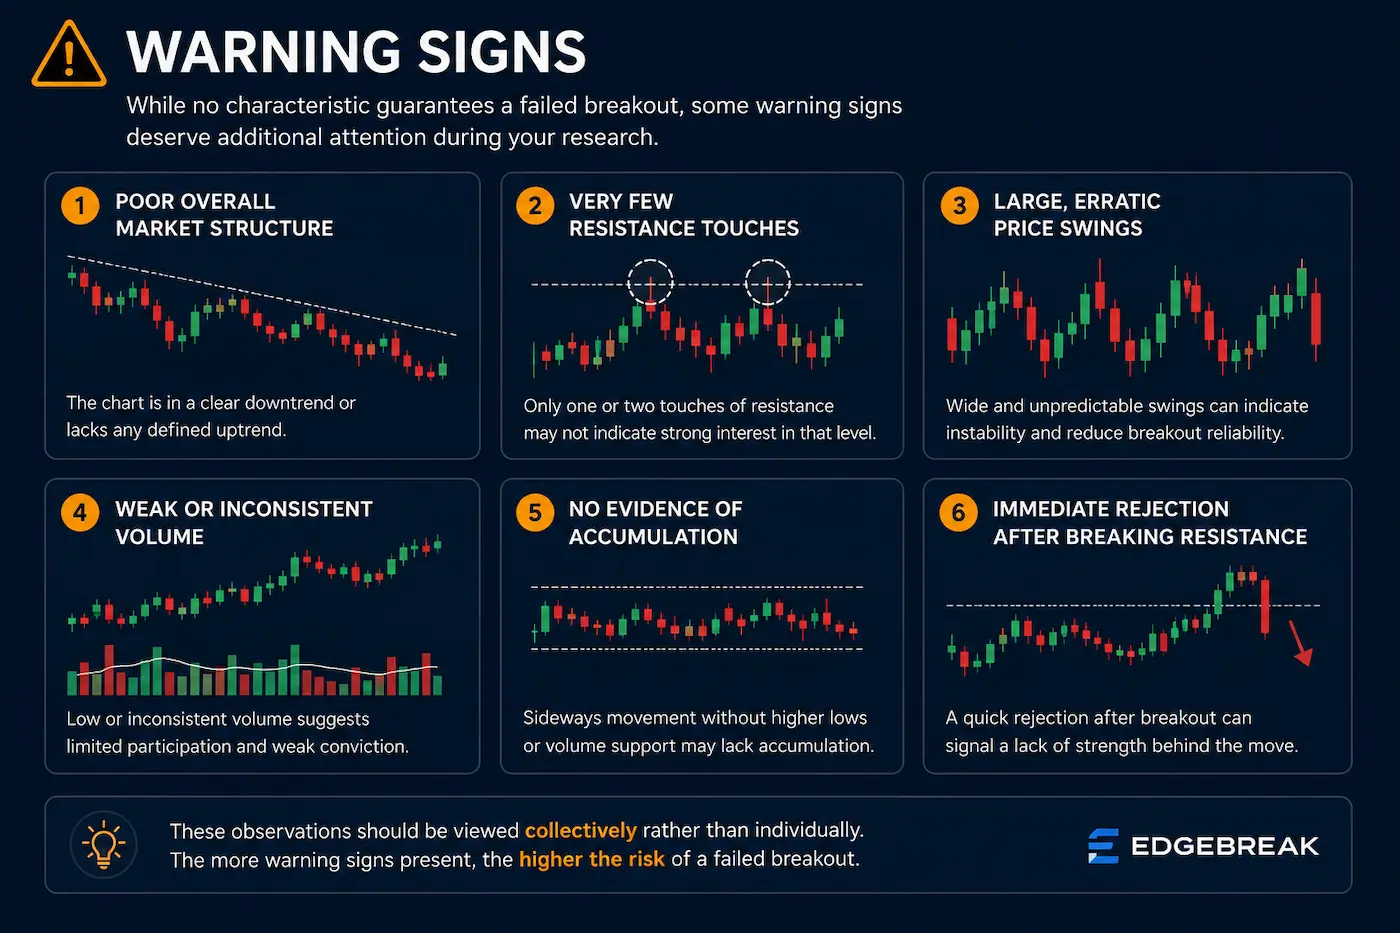
While no characteristic guarantees a failed breakout, some warning signs deserve additional attention during your research.
- Poor overall market structure.
- Very few resistance touches.
- Large, erratic price swings.
- Weak or inconsistent volume.
- No evidence of accumulation.
- Immediate rejection after breaking resistance.
These observations should be viewed collectively rather than individually.
What Can We Learn?
Failed breakouts often provide more valuable lessons than successful ones.
They encourage investors to review market structure more carefully, question assumptions and improve future research.
Every chart—whether successful or unsuccessful—adds to your understanding of how markets behave.
How Would EdgeBreak Handle This?
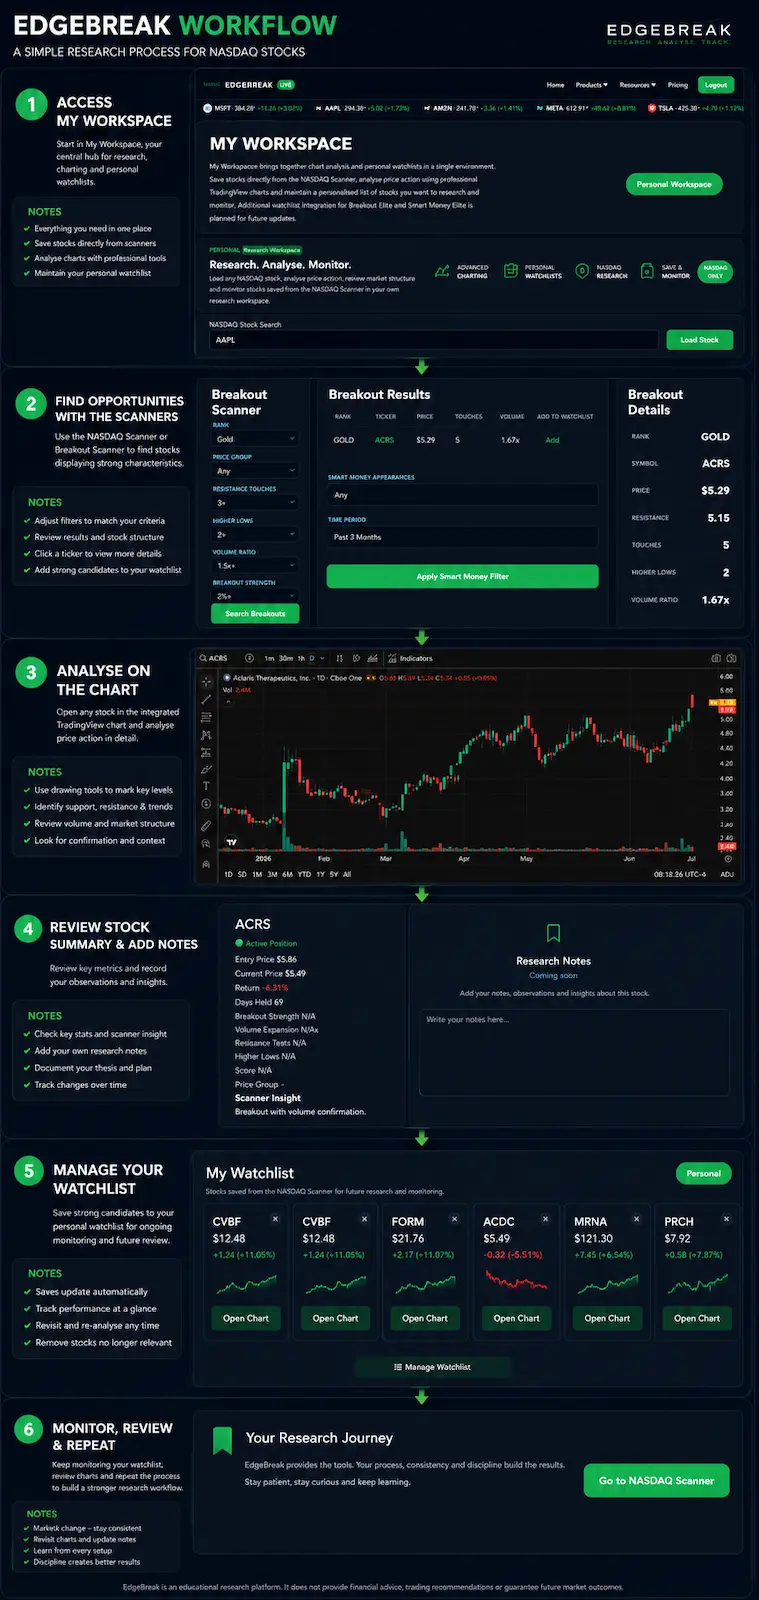
Imagine this stock appeared in the Breakout Scanner.
After reviewing the chart you might ask:
- Would I still save this to My Workspace?
- Would the Smart Money Filter strengthen the research?
- How does this compare with today's Gold breakouts?
- What warning signs can I identify now?
These questions help reinforce independent thinking rather than relying solely on scanner results.
Research Never Ends
One of the biggest lessons EdgeBreak teaches is that research continues after a breakout.
Continue monitoring market structure, higher lows, resistance and volume as new market information becomes available.
The objective is not to predict every outcome—it is to continually improve your understanding of market behaviour.
Lesson Summary
Failed breakouts are a normal part of financial markets. Studying these examples helps investors improve their pattern recognition, understand changing market structure and refine their research process. EdgeBreak encourages members to learn from both successful and unsuccessful examples while maintaining an objective, evidence-based approach to market analysis.
Key Takeaways
- Not every breakout succeeds.
- Review the structure before and after the breakout.
- Watch for changes in market structure and volume.
- Failed examples often provide the greatest learning opportunities.
- Research should continue long after a breakout appears.
Practical Exercise
Find a historical breakout that eventually failed.
- Mark the resistance level.
- Identify the higher lows.
- Review the volume behaviour.
- Determine where market structure began changing.
- Write down three lessons you learned from the chart.
Research Reminder
Historical market examples are provided for educational purposes only. A failed breakout should never be viewed as evidence that a particular research method is ineffective, just as a successful breakout should not be interpreted as proof of future performance. EdgeBreak encourages continuous learning through objective market research.
Continue Your Journey
Lesson 5.3 – Recognising Accumulation Before Breakouts
Learn how accumulation develops over time by analysing real market examples and identifying the characteristics that often appear before organised breakout structures emerge.