MODULE 5 • LESSON 21

Recognising Accumulation Before Breakouts

Estimated Time: 30 Minutes Real Market Research Examples

One of the most rewarding parts of market research is recognising organised accumulation before a breakout occurs. While no investor can predict future market movements, studying how accumulation develops allows you to identify research candidates earlier in the process. This lesson uses real market examples to demonstrate how accumulation often develops long before a breakout appears.

What You'll Learn

  • How accumulation develops.
  • Early signs of organised buying.
  • The difference between accumulation and random sideways movement.
  • How the Smart Money Filter supports this research.
  • Recognising accumulation using real charts.

What Does Accumulation Look Like?

Accumulation is rarely dramatic.

Instead of large price movements, accumulation often develops quietly through weeks or months of organised price action.

During this period, buyers gradually absorb selling pressure while the stock remains within a relatively defined trading range.
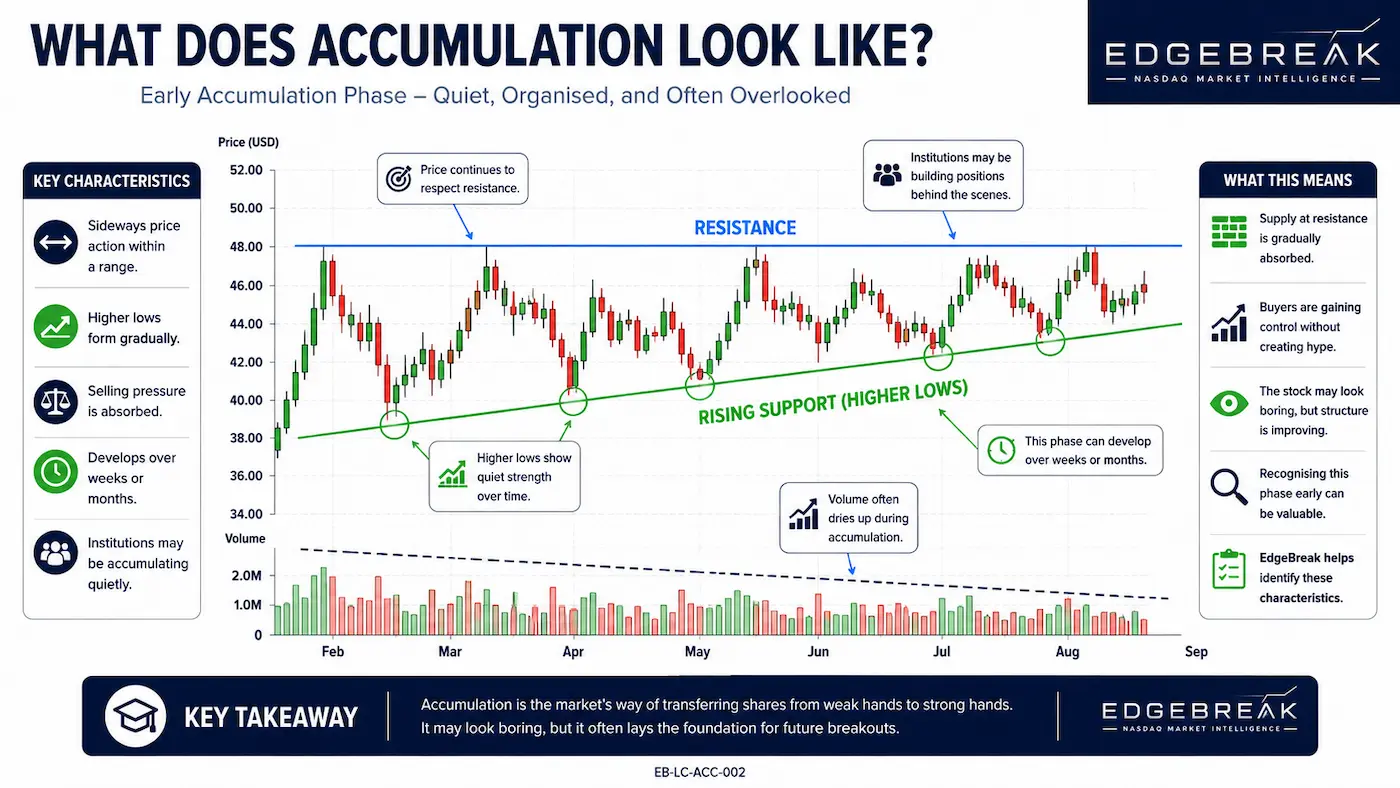
Early accumulation phase showing a stock trading within a defined range while gradually developing higher lows beneath resistance.
This illustration demonstrates an early accumulation phase, where price may remain within a relatively defined trading range while gradually developing stronger market structure. Rather than producing rapid price advances, accumulation often unfolds quietly as buyers absorb selling pressure over an extended period. The higher lows suggest improving demand, while repeated tests of resistance indicate that supply is being gradually absorbed. Within the EdgeBreak research process, recognising these characteristics can help investors identify stocks that may be transitioning from consolidation towards a potential breakout, while remembering that no single pattern guarantees future price movement.

Example One – Healthy Accumulation

In our first example, notice how price repeatedly approaches resistance but continues finding support at progressively higher prices.

The market structure remains organised, daily price swings become more controlled and higher lows continue developing beneath resistance.

Although no breakout has occurred yet, the stock is displaying several characteristics commonly associated with organised accumulation.

Early accumulation phase showing a stock trading within a defined range while gradually developing higher lows beneath resistance.
This illustration demonstrates an early accumulation phase, where price may remain within a relatively defined trading range while gradually developing stronger market structure. Rather than producing rapid price advances, accumulation often unfolds quietly as buyers absorb selling pressure over an extended period. The higher lows suggest improving demand, while repeated tests of resistance indicate that supply is being gradually absorbed. Within the EdgeBreak research process, recognising these characteristics can help investors identify stocks that may be transitioning from consolidation towards a potential breakout, while remembering that no single pattern guarantees future price movement.

Example Two – Sideways Without Accumulation

Not every sideways market represents accumulation.

Compare the previous chart with one showing inconsistent price movement, large swings and no obvious higher lows.

While both stocks appear to be moving sideways, only one demonstrates organised market behaviour.

Learning to recognise this difference is an important research skill.
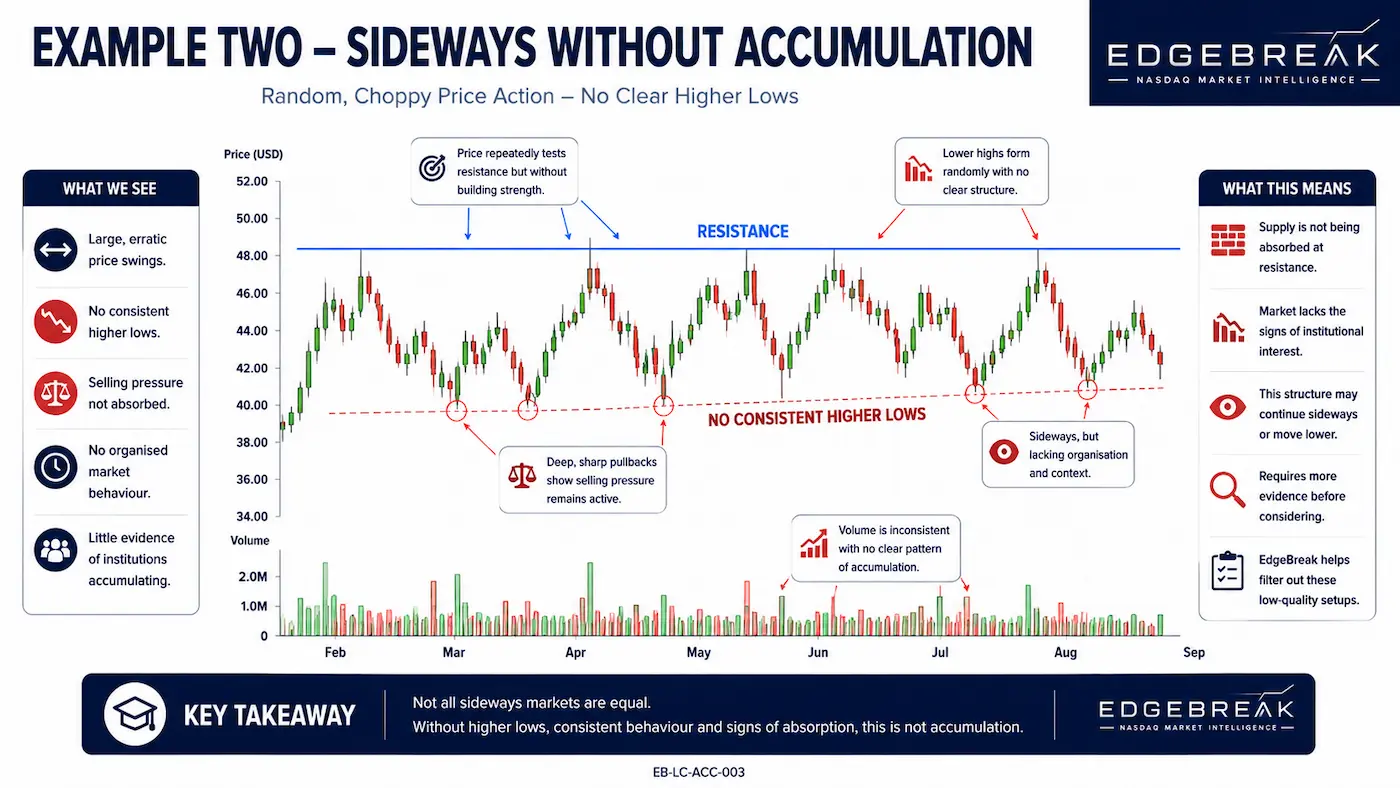
Sideways market showing inconsistent price movement, large swings and no clear pattern of higher lows or accumulation.
This illustration compares a sideways market that lacks the characteristics commonly associated with accumulation. Although price remains within a broad trading range, the market structure is less organised, with larger price swings, inconsistent volume and no clear progression of higher lows. These characteristics suggest that selling pressure may not be gradually absorbed in the same way as a structured accumulation phase. Within the EdgeBreak research process, comparing charts like this with stronger accumulation examples helps develop the ability to distinguish between random consolidation and organised market behaviour before researching potential breakout opportunities.

Resistance Plays an Important Role

Accumulation often develops beneath a clearly defined resistance level.

Each unsuccessful attempt to break higher provides another opportunity to observe how buyers respond.

If higher lows continue developing after each rejection, market structure may gradually strengthen over time.
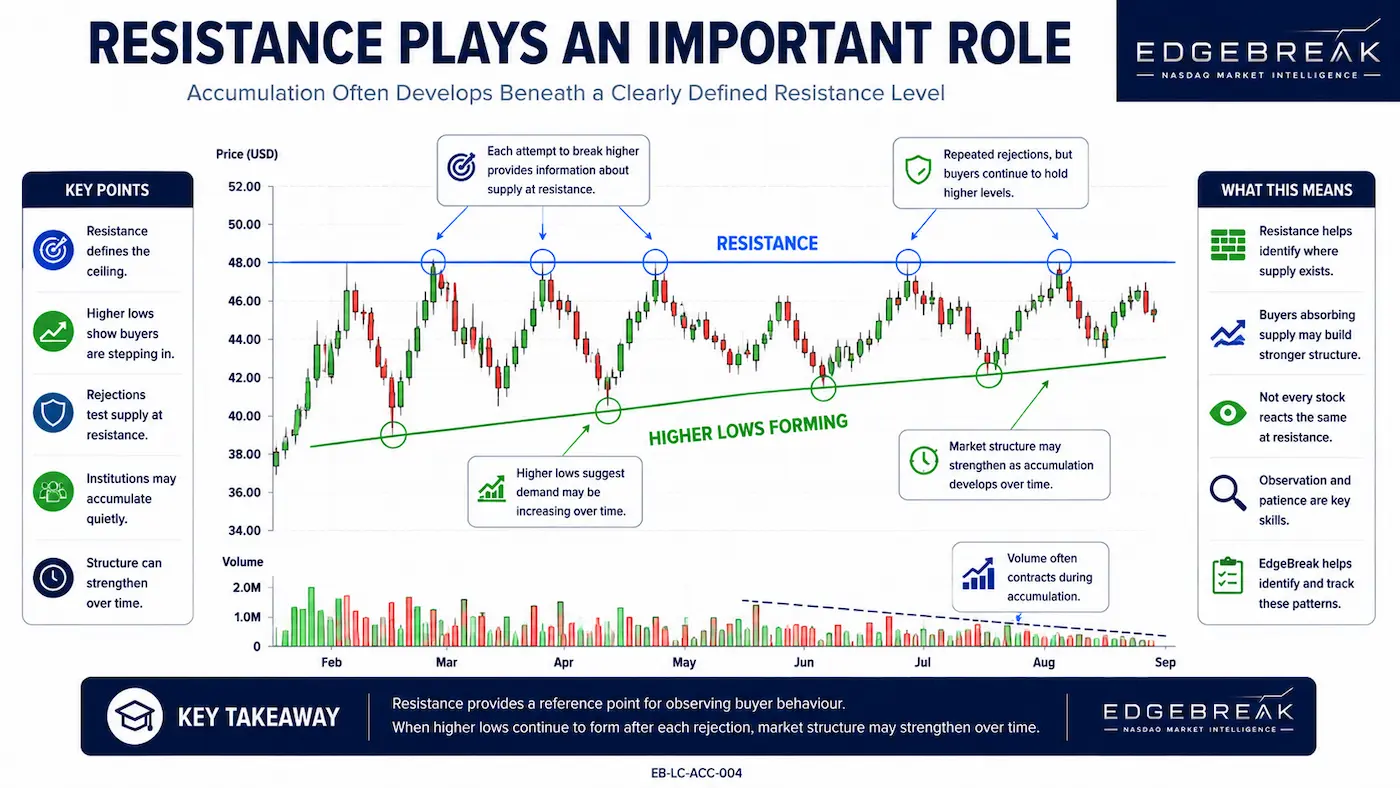
Accumulation developing beneath a clearly defined resistance level with progressively higher lows strengthening market structure over time.
This illustration demonstrates how accumulation often develops beneath a well-defined resistance level as buyers repeatedly respond to each rejection. Rather than breaking higher immediately, price may remain below resistance while forming progressively higher lows, suggesting that demand is gradually increasing over time. Each test of resistance provides another opportunity to observe how the market reacts and whether buying pressure continues to build. Within the EdgeBreak research process, studying the relationship between resistance and higher lows helps investors evaluate market structure and identify characteristics that may support further research into potential breakout opportunities, while recognising that no pattern guarantees future price movement.

Watch the Volume

Volume behaviour often provides additional context during accumulation.

Many organised accumulation structures experience relatively quiet trading activity during consolidation before participation begins increasing as interest returns.

Volume should never be analysed on its own, but when combined with price structure it helps build a more complete research picture.
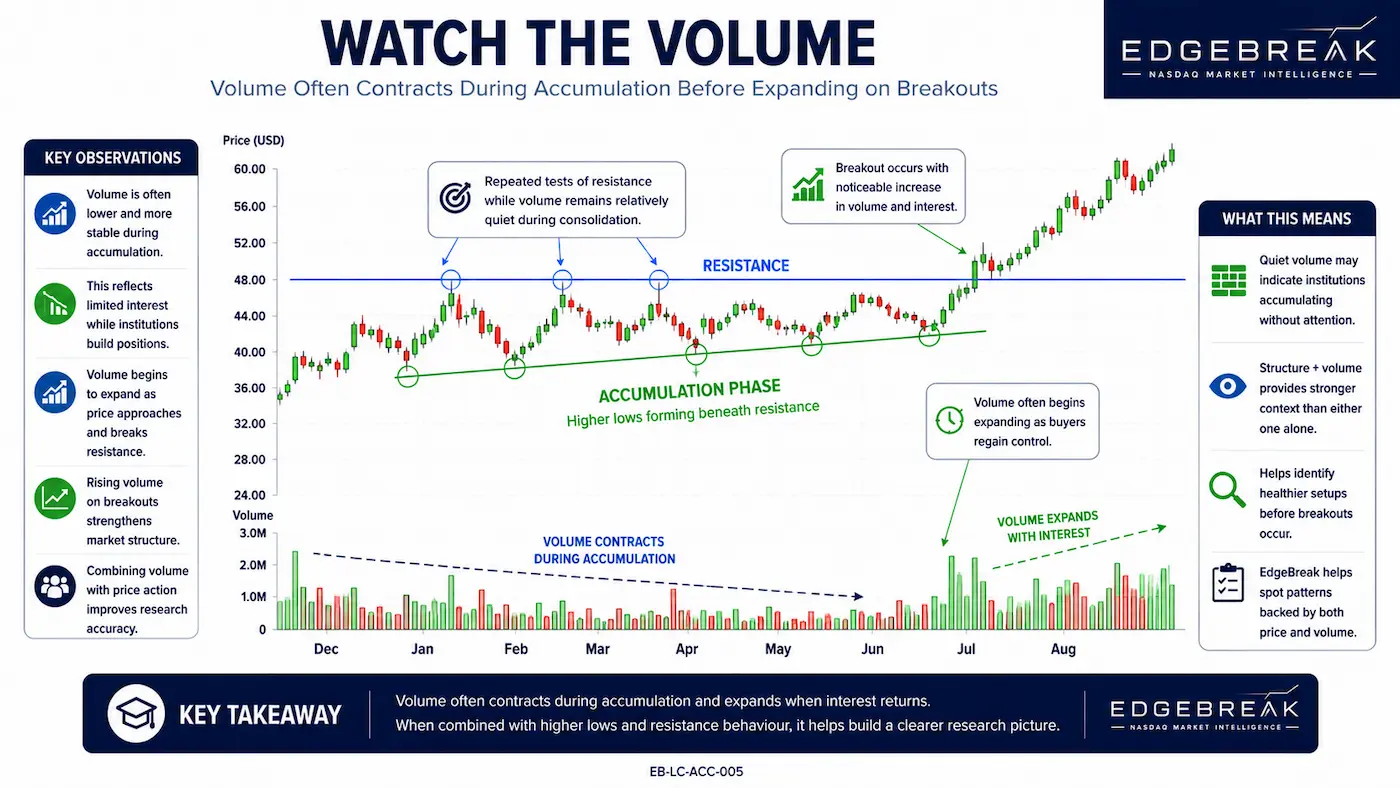
Accumulation chart showing volume gradually contracting during consolidation before increasing as buying interest returns near resistance.
This illustration demonstrates how volume can provide additional context when researching accumulation. During many organised accumulation phases, trading activity often becomes quieter while price continues developing higher lows beneath resistance. As buying interest gradually returns, volume may begin increasing, particularly as price approaches a potential breakout level. Volume should always be considered alongside price action and market structure rather than in isolation. Within the EdgeBreak research process, combining volume behaviour with resistance and higher lows helps build a more complete understanding of how a stock may be developing over time, while recognising that no single characteristic predicts future performance.

How EdgeBreak Helps

EdgeBreak combines several accumulation-related characteristics into one research workflow.

Members can:

  • Search the NASDAQ Scanner.
  • Apply the Smart Money Filter.
  • Review higher lows.
  • Analyse resistance touches.
  • Study volume behaviour.
  • Save promising research candidates to My Workspace.

This structured process makes it easier to identify organised market behaviour without manually searching thousands of charts.

Accumulation Requires Patience

One of the biggest challenges for newer investors is recognising that accumulation often develops slowly.

Some stocks remain within consolidation ranges for months before eventually moving above resistance.

Rather than becoming impatient, continue monitoring how the structure evolves over time.

Consistent observation is often more valuable than constantly searching for new opportunities.
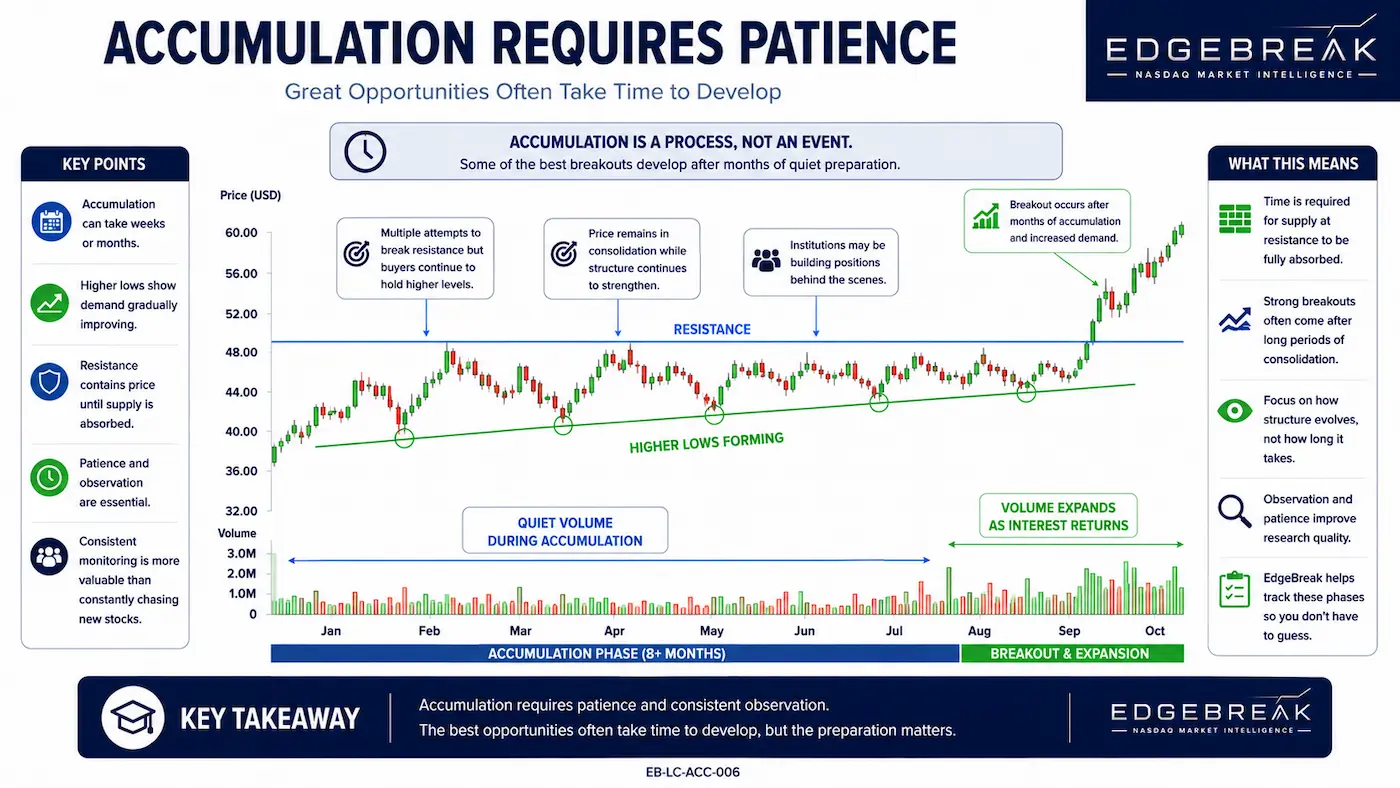
Timeline showing a prolonged accumulation phase beneath resistance before a breakout develops after months of improving market structure.
This illustration demonstrates how accumulation often develops gradually over an extended period rather than forming within a few trading sessions. Price may remain below resistance for weeks or months while higher lows, quieter volume and improving market structure slowly emerge. As time progresses, repeated testing of resistance can provide additional insight into whether buying pressure continues to build. Within the EdgeBreak research process, consistent observation helps investors understand how market structure evolves over time, reinforcing that patience and disciplined research are often more valuable than constantly searching for new opportunities or expecting immediate breakouts.

Questions to Ask

When reviewing a potential accumulation structure, ask yourself:

  • Is resistance clearly defined?
  • Are higher lows developing?
  • Has selling pressure reduced?
  • Is volume supporting the structure?
  • Would this stock appear in the Smart Money Filter?
  • Does it deserve a place in My Workspace?

These questions help create a repeatable research process that can be applied consistently across different market conditions.

Lesson Summary

Accumulation often develops quietly through organised market structure, repeated resistance tests, higher lows and improving buying pressure. By combining these characteristics with the EdgeBreak scanners and Smart Money Filter, members can identify research candidates earlier and monitor their development over time.

Key Takeaways

  • Not all sideways markets represent accumulation.
  • Look for organised market structure.
  • Higher lows often strengthen accumulation.
  • Volume provides additional context.
  • Patience is an important part of the research process.

Practical Exercise

Use the NASDAQ Scanner together with the Smart Money Filter to identify three stocks currently displaying accumulation characteristics.

  • Review the market structure.
  • Mark resistance.
  • Identify higher lows.
  • Review recent volume.
  • Save the strongest research candidate to My Workspace.

Research Reminder

Accumulation is a market characteristic—not a guarantee of future price movement. EdgeBreak uses structured market analysis to help members identify stocks displaying organised behaviour for further research. Always complete your own independent analysis before making financial decisions.

Continue Learning

Continue Your Journey

Lesson 5.4 – Comparing Gold, Silver & Bronze Breakouts

Compare real Gold, Silver and Bronze breakout examples to understand how market structure, accumulation, resistance and volume influence breakout quality and help prioritise research opportunities.

Module 5 • Lesson 22 of 30