Using the Breakout Scanner
The Breakout Scanner is designed to identify NASDAQ stocks that have already broken above a defined resistance level according to the EdgeBreak breakout model. Unlike the NASDAQ Scanner, which searches for developing research candidates, the Breakout Scanner focuses on stocks that have already demonstrated breakout characteristics and deserve further investigation.
What You'll Learn
- How the Breakout Scanner works.
- Understanding Gold, Silver and Bronze breakouts.
- Using breakout metrics effectively.
- Researching breakout quality.
- Building a post-breakout watchlist.
What Is the Breakout Scanner?
The Breakout Scanner searches the market for stocks that have recently moved above an established resistance level based on the EdgeBreak breakout methodology.
Every stock displayed has already satisfied the platform's breakout criteria. Rather than searching for potential breakouts, the scanner helps members research stocks that have already demonstrated breakout behaviour.
The scanner is designed to save research time by organising breakout opportunities into one location.
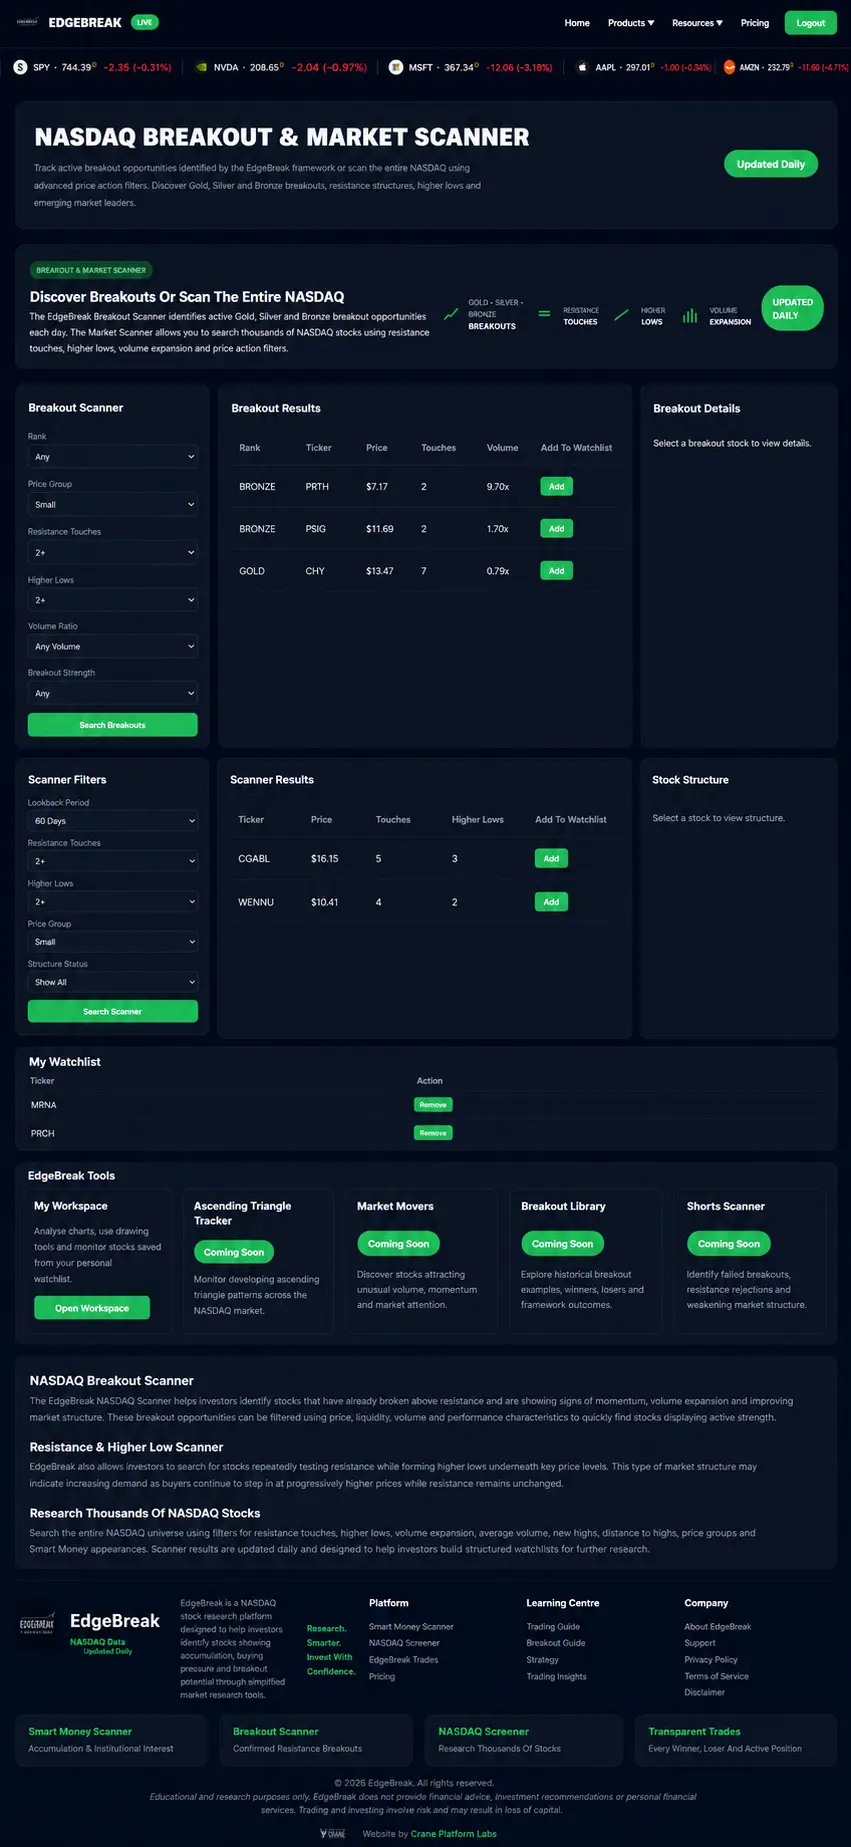
Figure: The EdgeBreak Breakout Scanner identifies stocks that have already broken above established resistance and meet the selected research filters. Investors can refine results using breakout characteristics such as resistance touches, higher lows and volume expansion before opening individual TradingView charts to study market structure in greater detail. The scanner is designed to organise and prioritise research opportunities rather than provide financial advice or trading signals.
Understanding Gold, Silver & Bronze
EdgeBreak groups breakout opportunities into three research categories based on the overall strength of their breakout characteristics.
- Gold – Strong overall breakout structure with multiple supporting characteristics.
- Silver – Good market structure with several positive characteristics.
- Bronze – Valid breakout structure that may deserve continued monitoring.
These categories help organise research and prioritise chart reviews. They are not predictions of future market performance.
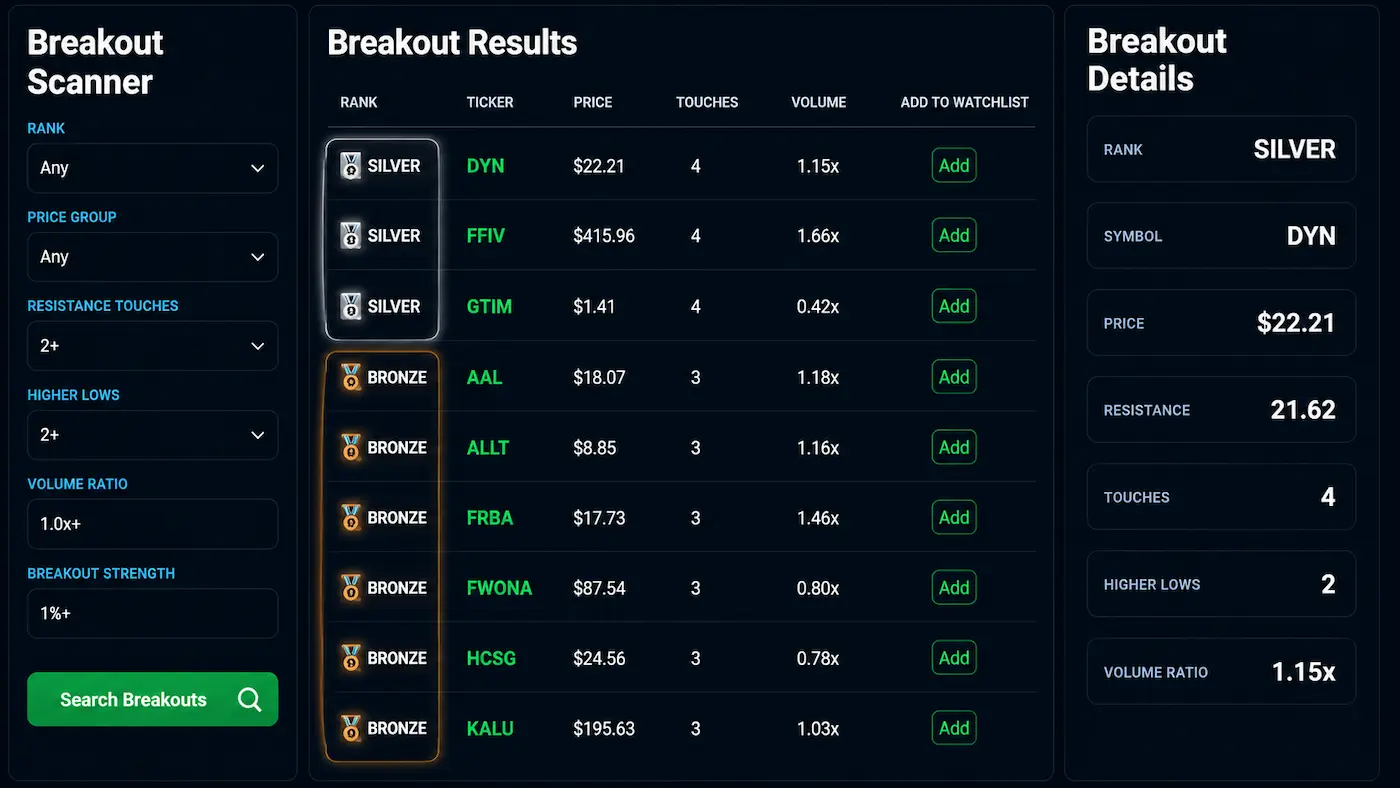
Figure: The Rank filter allows investors to focus on Gold, Silver or Bronze breakout opportunities. These rankings help organise research by grouping breakout candidates according to the EdgeBreak breakout model, making it easier to prioritise which charts to review first before conducting detailed market structure analysis.
Understanding the Scanner Metrics
Each breakout includes several important research metrics that provide additional context.
- Current Price
- Resistance Touches
- Higher Lows
- Volume Ratio
- Distance Above Resistance
These measurements help members compare breakout structures and decide which charts deserve closer examination.
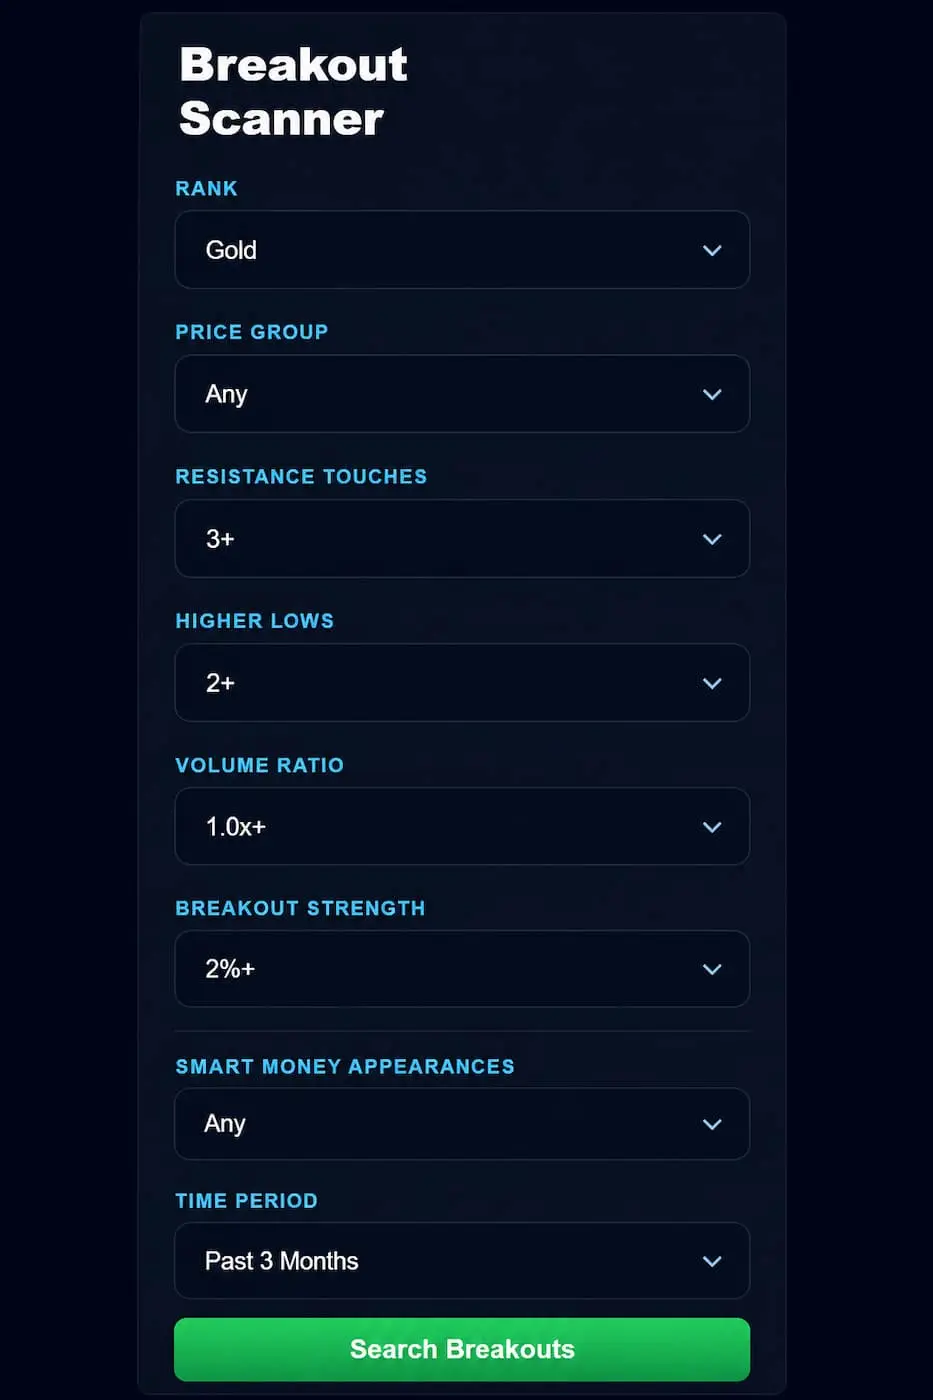
Figure: The EdgeBreak Breakout Scanner allows investors to refine breakout research using a combination of filters including Rank, Price Group, Resistance Touches, Higher Lows, Volume Ratio and Breakout Strength. Applying these filters helps reduce thousands of NASDAQ-listed stocks into a smaller group of organised breakout candidates that can then be investigated further using TradingView charts and broader market structure analysis.
Opening the Chart
Clicking any stock immediately loads its TradingView chart.
Before adding a stock to your watchlist, take time to review:
- The overall market structure.
- The breakout itself.
- Volume behaviour.
- Higher lows.
- Long-term weekly trend.
- Nearby resistance levels.
Remember that the scanner identifies research opportunities—the chart provides the full story.
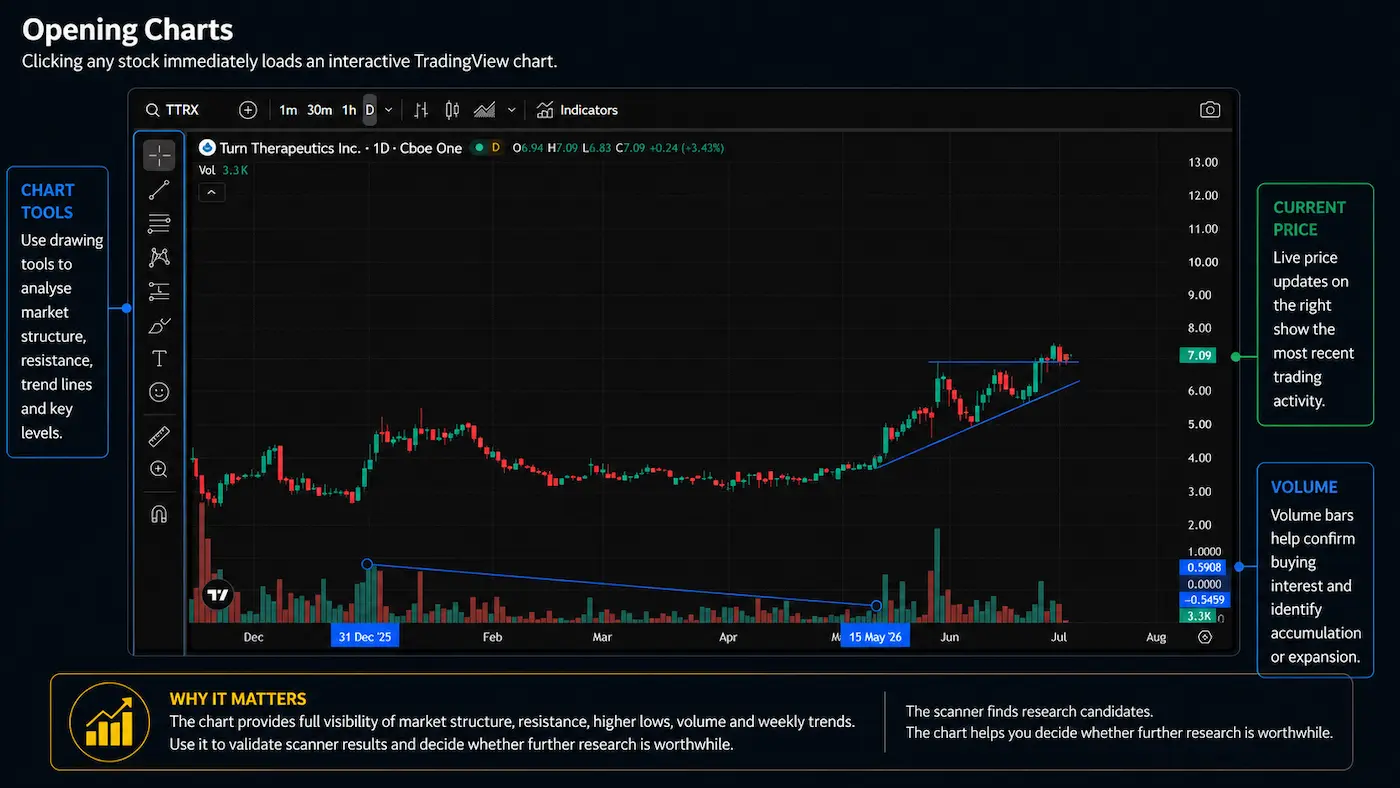
Figure. Opening charts from the EdgeBreak scanner launches an interactive TradingView chart, allowing investors to examine market structure, resistance, higher lows, volume behaviour and overall trend before deciding whether a stock deserves further research.
Reviewing the Breakout
Not every breakout develops in exactly the same way.
Some stocks continue building momentum after breaking resistance, while others consolidate or return to test the breakout level.
Rather than focusing on short-term price movement, continue monitoring how the overall market structure evolves.
The goal is to understand how quality breakout structures behave over time.
Saving Breakouts to My Workspace
If a breakout deserves further research, save it to My Workspace.
Building a structured watchlist allows you to monitor developing market behaviour over days, weeks and months rather than making decisions based on one day's activity.
Continue reviewing saved stocks as new market data becomes available.
Researching, Not Predicting
One of the most important principles of EdgeBreak is understanding that a breakout does not guarantee future performance.
Markets remain uncertain, and every breakout continues to evolve after appearing in the scanner.
Use the scanner to organise your research—not to predict future outcomes.
A Typical Breakout Workflow
A structured research process may include:
- Review today's breakout list.
- Prioritise Gold and Silver structures.
- Open each TradingView chart.
- Review weekly and daily market structure.
- Check volume and higher lows.
- Save quality research candidates to My Workspace.
- Continue monitoring them over time.
Consistently following the same workflow helps build experience recognising organised breakout structures.
Lesson Summary
The Breakout Scanner helps members identify stocks that have already broken above resistance according to the EdgeBreak breakout model. By combining breakout classifications, chart analysis and ongoing monitoring through My Workspace, members can build a structured process for researching active breakout opportunities.
Key Takeaways
- The Breakout Scanner identifies completed breakout structures.
- Gold, Silver and Bronze help organise research.
- Always review the chart before saving a stock.
- Monitor breakout development over time.
- Use the scanner as a research tool rather than a prediction tool.
Practical Exercise
Open today's Breakout Scanner results.
- Review three Gold breakouts.
- Review three Silver breakouts.
- Compare their market structure.
- Review their weekly charts.
- Save your two favourite research candidates to My Workspace.
Research Reminder
The Breakout Scanner highlights stocks that have met the EdgeBreak breakout criteria for research purposes. Scanner results do not represent financial advice, investment recommendations or guarantees of future market performance. Always complete your own independent research before making financial decisions.
Continue Your Journey
Lesson 4.3 – Mastering the Smart Money Filter
Learn how the Smart Money Filter helps identify stocks displaying accumulation characteristics and organised market behaviour. Discover how to use these insights alongside the NASDAQ Scanner and Breakout Scanner to strengthen your research process.