Mastering the NASDAQ Scanner
The NASDAQ Scanner is the heart of the EdgeBreak platform. Rather than manually searching thousands of charts every day, the scanner helps organise the market by identifying stocks displaying characteristics commonly associated with developing breakout structures. This lesson explains every feature of the scanner and demonstrates how it fits into your daily research routine.
What You'll Learn
- How the NASDAQ Scanner works.
- What each filter does.
- How to interpret scanner results.
- Building a research watchlist.
- Common mistakes to avoid.
Why the Scanner Exists
Researching every NASDAQ-listed stock manually would require reviewing thousands of individual charts.
The NASDAQ Scanner reduces this workload by searching the market for stocks displaying characteristics commonly researched before breakout opportunities develop.
Instead of replacing your own analysis, the scanner helps narrow your research to a smaller number of organised market structures deserving further investigation.
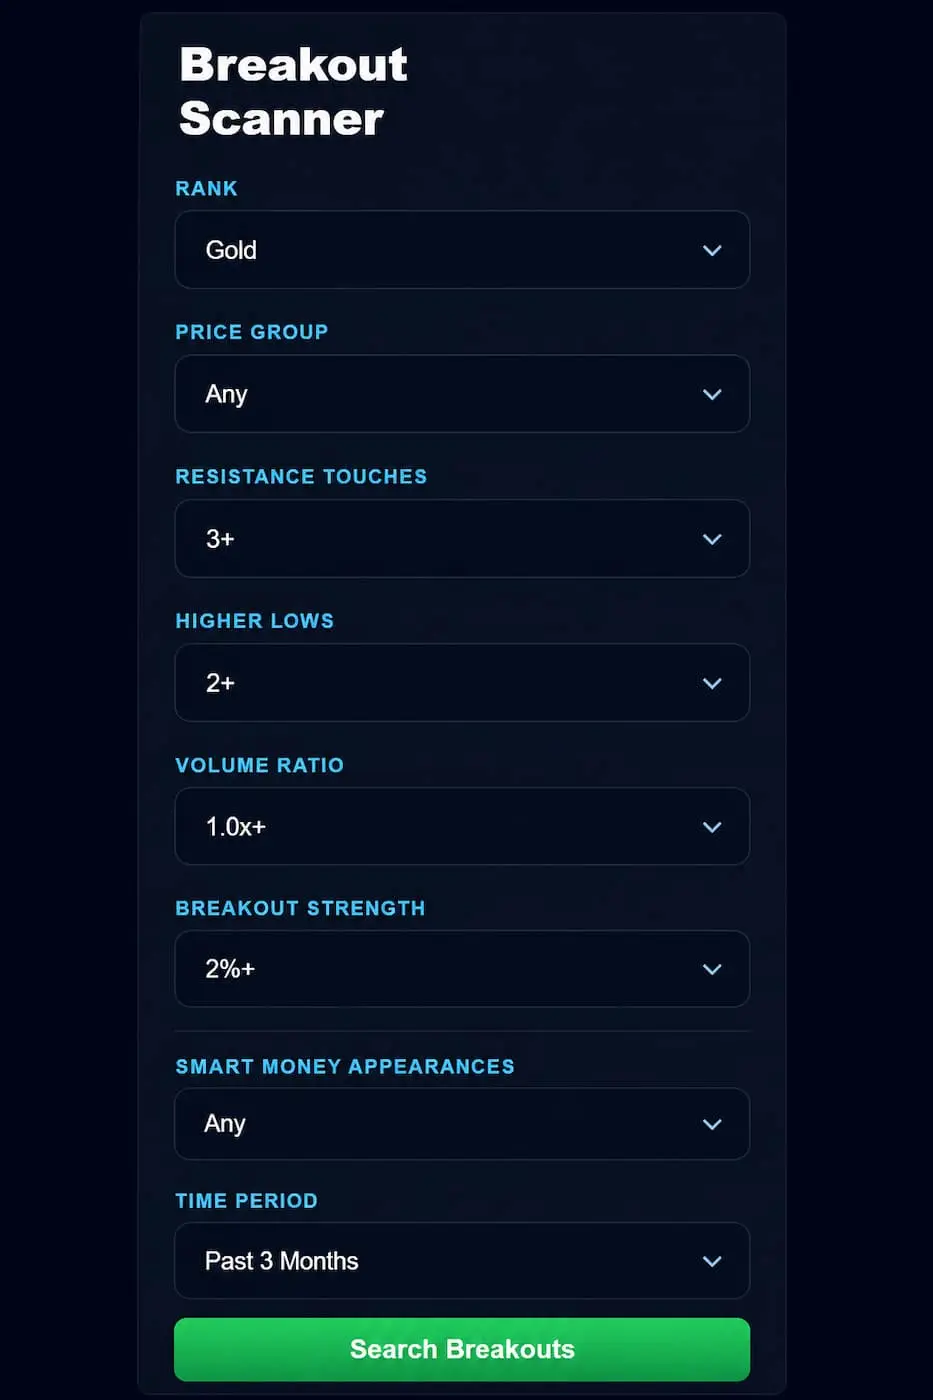
Understanding the Scanner Filters
Every filter allows you to narrow your research based on specific market characteristics.
Rather than searching the entire market, filters help identify companies matching the research criteria you wish to study.
Available filters include:
- Price Group
- Resistance Touches
- Higher Lows
- Distance to High
- Volume Ratio
- New High
- Appearances
- Lookback Period
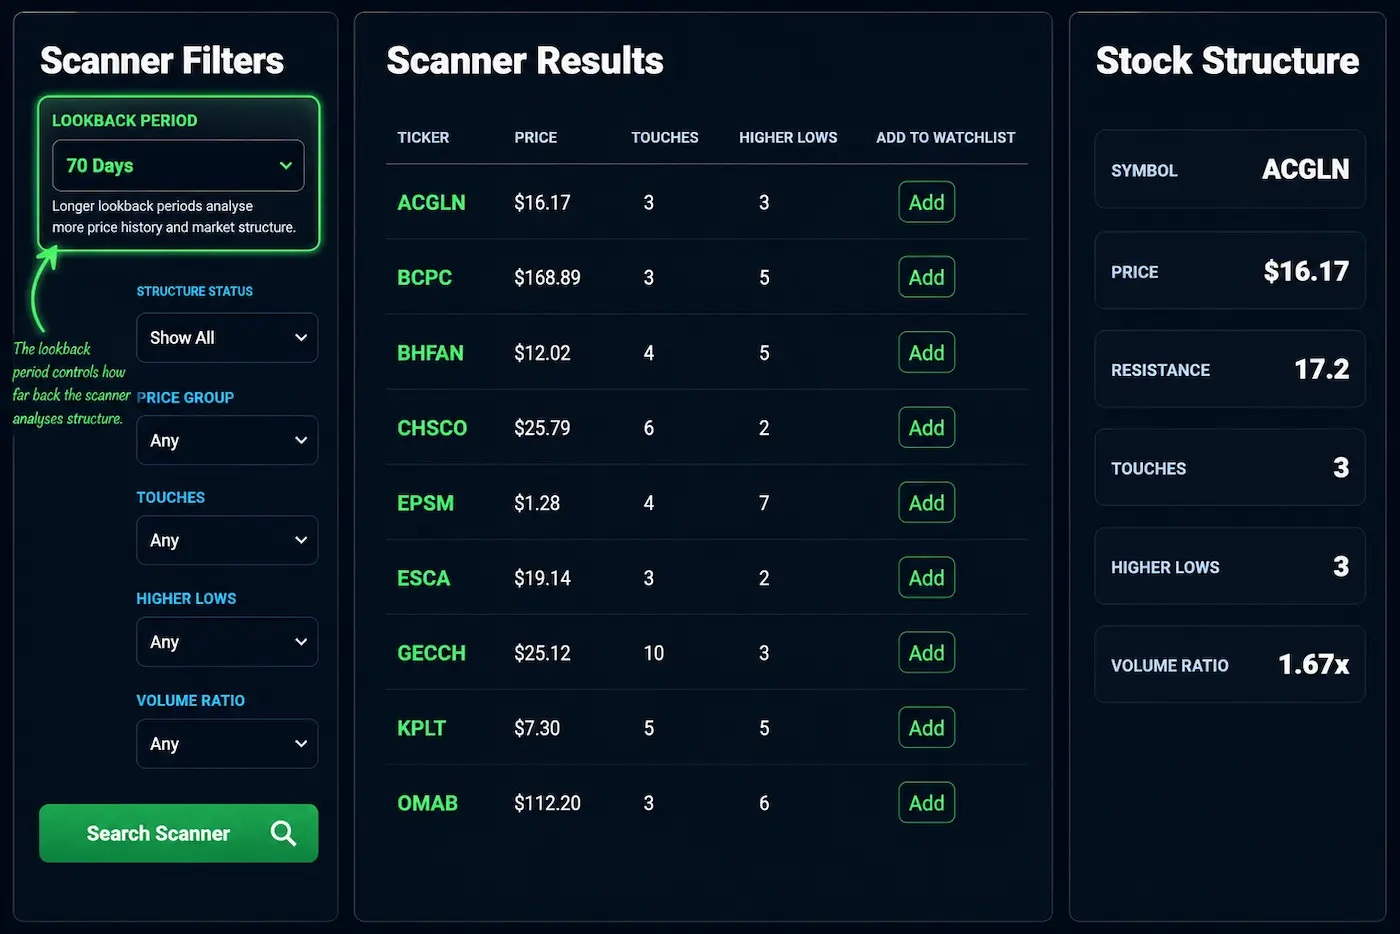
Choosing a Lookback Period
The Lookback filter controls how much historical price data is used when identifying resistance levels.
Shorter lookback periods may identify more recent market structures, while longer periods often highlight larger consolidation patterns.
There is no universally "best" setting. Different lookback periods simply provide different perspectives on market behaviour.
Experiment with multiple timeframes to better understand how resistance develops.
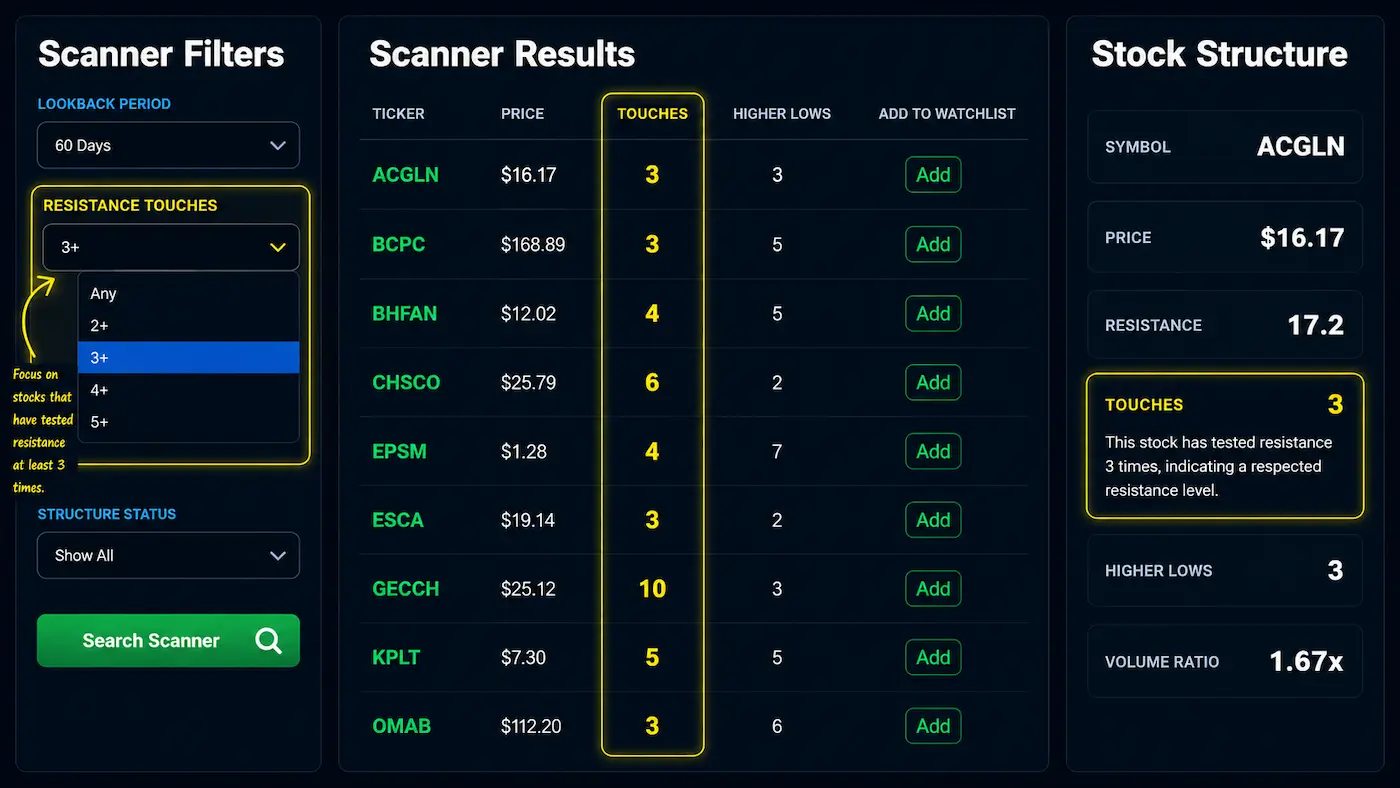
Understanding Resistance Touches
One of the primary characteristics used throughout EdgeBreak is repeated testing of resistance.
Multiple touches may indicate that buyers continue returning to the same price level despite previous selling pressure.
Higher numbers of touches do not guarantee stronger breakouts, but they often identify stocks deserving additional research.
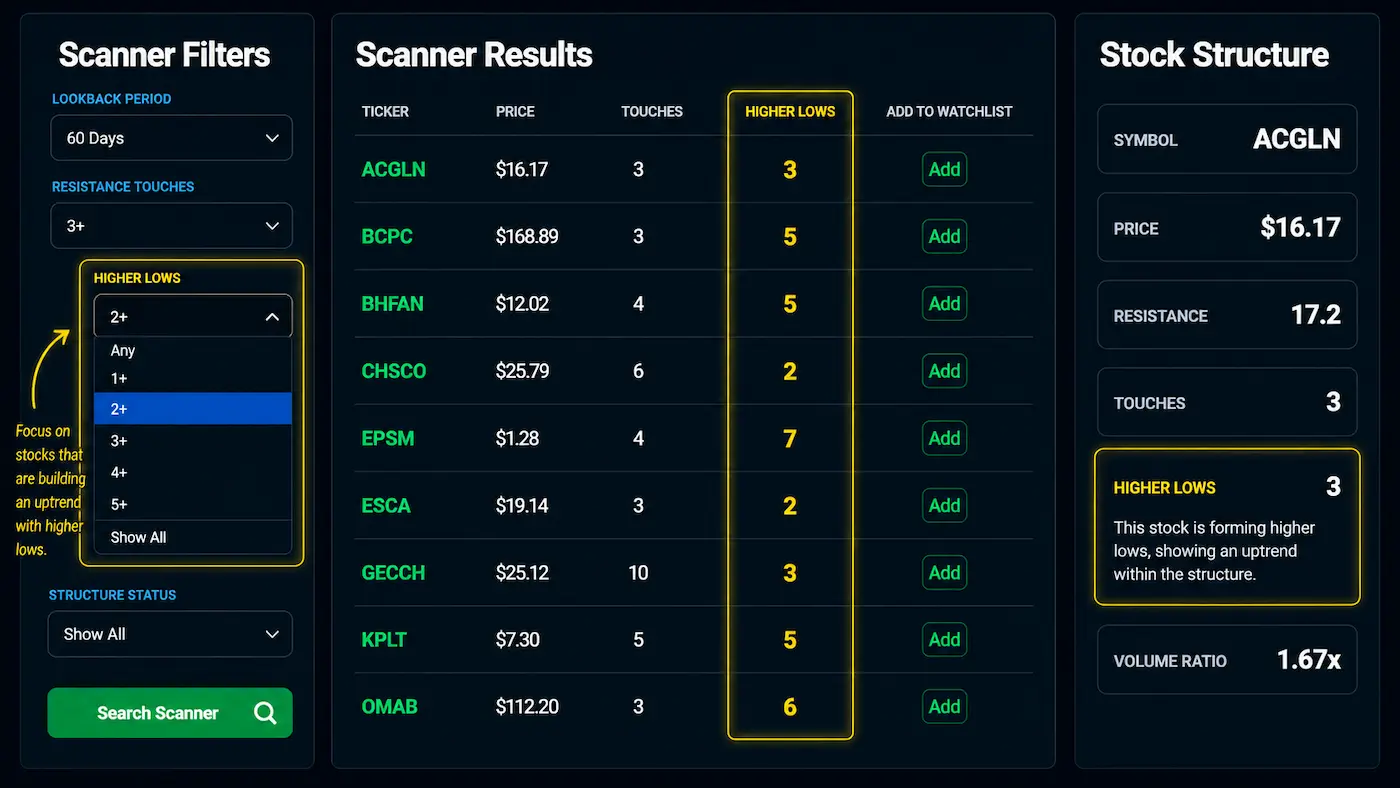
Higher Lows
Higher lows represent improving market structure beneath resistance.
Stocks displaying higher lows often demonstrate increasing buying pressure as buyers continue supporting higher prices after each pullback.
This characteristic is one of the key building blocks of the EdgeBreak research methodology.
Volume Ratio
Volume Ratio compares recent trading activity with historical averages.
Increased participation may provide additional context when researching developing breakout structures.
Volume should always be considered alongside market structure rather than interpreted independently.
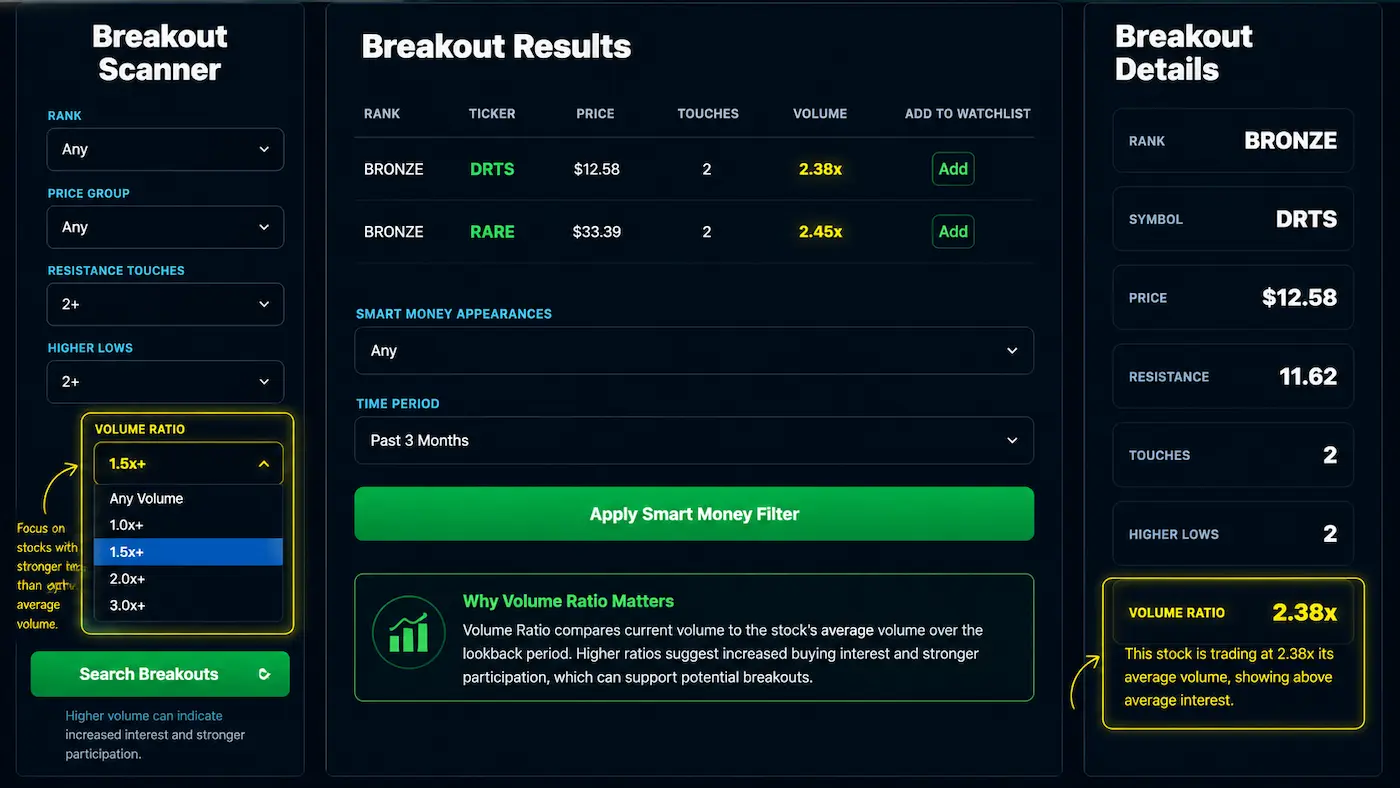
Figure: The Volume Ratio filter helps identify stocks experiencing higher-than-normal trading activity. Increased volume often indicates stronger market participation and can be an important characteristic to research alongside resistance levels, higher lows and overall market structure.
Opening Charts
Clicking any stock immediately loads an interactive TradingView chart.
This allows you to study:
- Market structure
- Resistance
- Higher lows
- Volume
- Weekly trends
- Accumulation characteristics
The scanner finds research candidates.
The chart helps you decide whether further research is worthwhile.
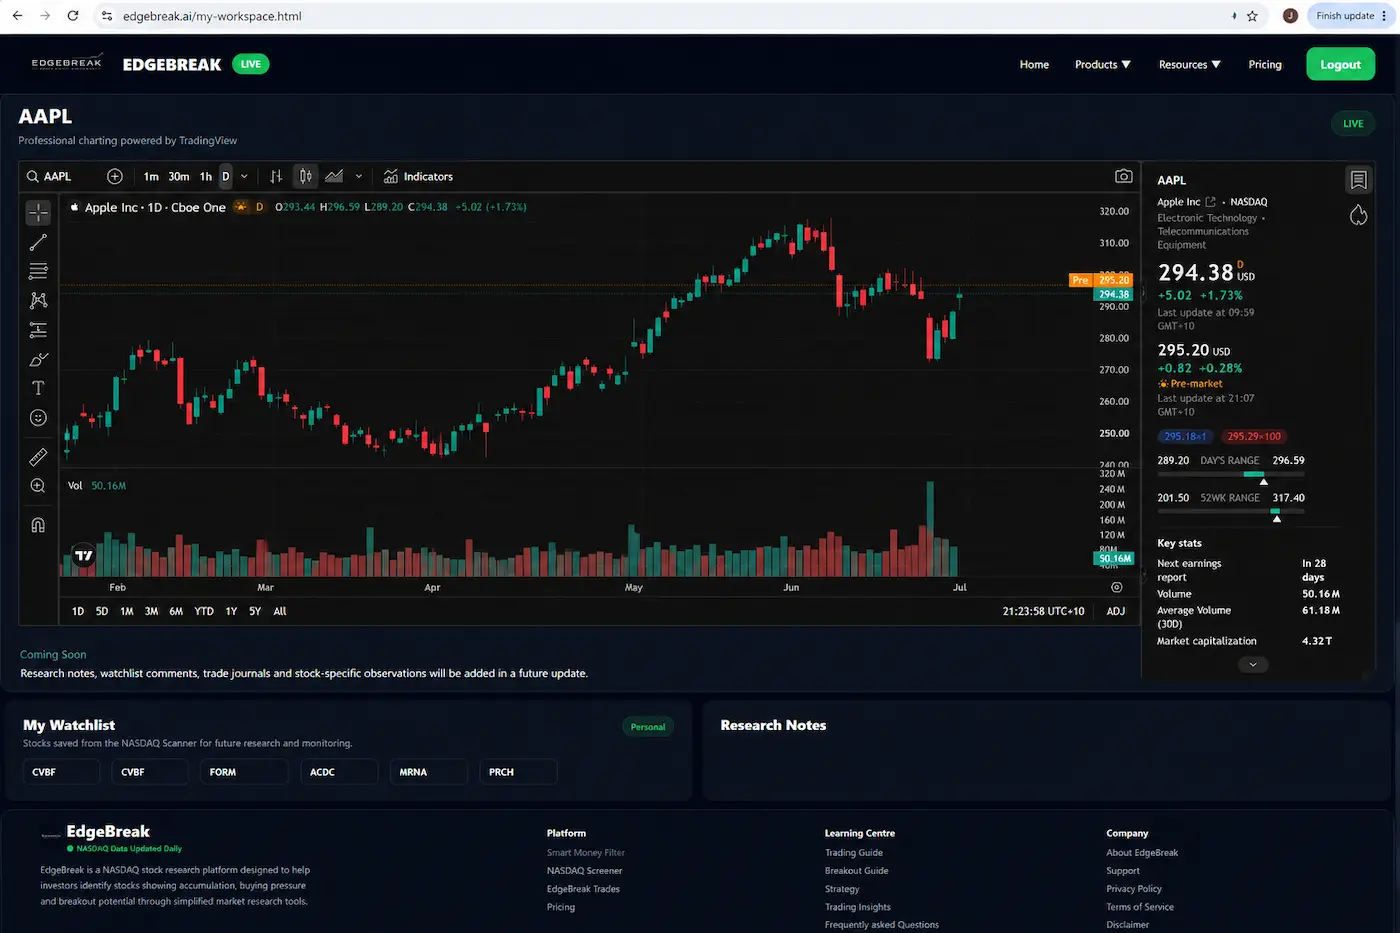
Figure: Selecting a stock from the NASDAQ Scanner opens an interactive TradingView chart, allowing investors to examine market structure, resistance levels, higher lows, volume behaviour, weekly trends and accumulation characteristics before deciding whether the opportunity deserves further research.
Adding Stocks to My Workspace
If a stock deserves continued monitoring, add it to My Workspace.
This allows you to build an organised research watchlist rather than repeatedly searching for the same stocks.
Over time, your watchlist becomes a personalised collection of developing market opportunities.
A Typical Research Workflow
A simple daily workflow might look like this:
- Choose your preferred Lookback period.
- Apply any research filters.
- Review scanner results.
- Open interesting charts.
- Study the market structure.
- Save quality research candidates to My Workspace.
This repeatable process allows you to organise research consistently while avoiding information overload.
Lesson Summary
The NASDAQ Scanner is designed to simplify market research by identifying stocks displaying organised breakout characteristics. By combining scanner filters with chart analysis and My Workspace, members can build a structured and repeatable research process that supports independent market analysis.
Key Takeaways
- The scanner identifies research candidates—not investment recommendations.
- Filters help organise the market into manageable research groups.
- Always review charts before adding stocks to your watchlist.
- Use multiple filters together for more focused research.
- Build consistency by following the same workflow each day.
Practical Exercise
Spend 20 minutes exploring the NASDAQ Scanner.
- Test different Lookback periods.
- Apply several filter combinations.
- Open ten different charts.
- Compare their market structures.
- Save your three strongest research candidates to My Workspace.
Research Reminder
The NASDAQ Scanner is designed to organise market research by identifying stocks displaying selected technical characteristics. Scanner results should always be reviewed independently and do not represent financial advice or investment recommendations.
Continue Your Journey
Lesson 4.2 – Using the Breakout Scanner
Learn how the EdgeBreak Breakout Scanner identifies active breakout opportunities, understand the Gold, Silver and Bronze classifications, and discover how to incorporate the scanner into your daily market research routine.