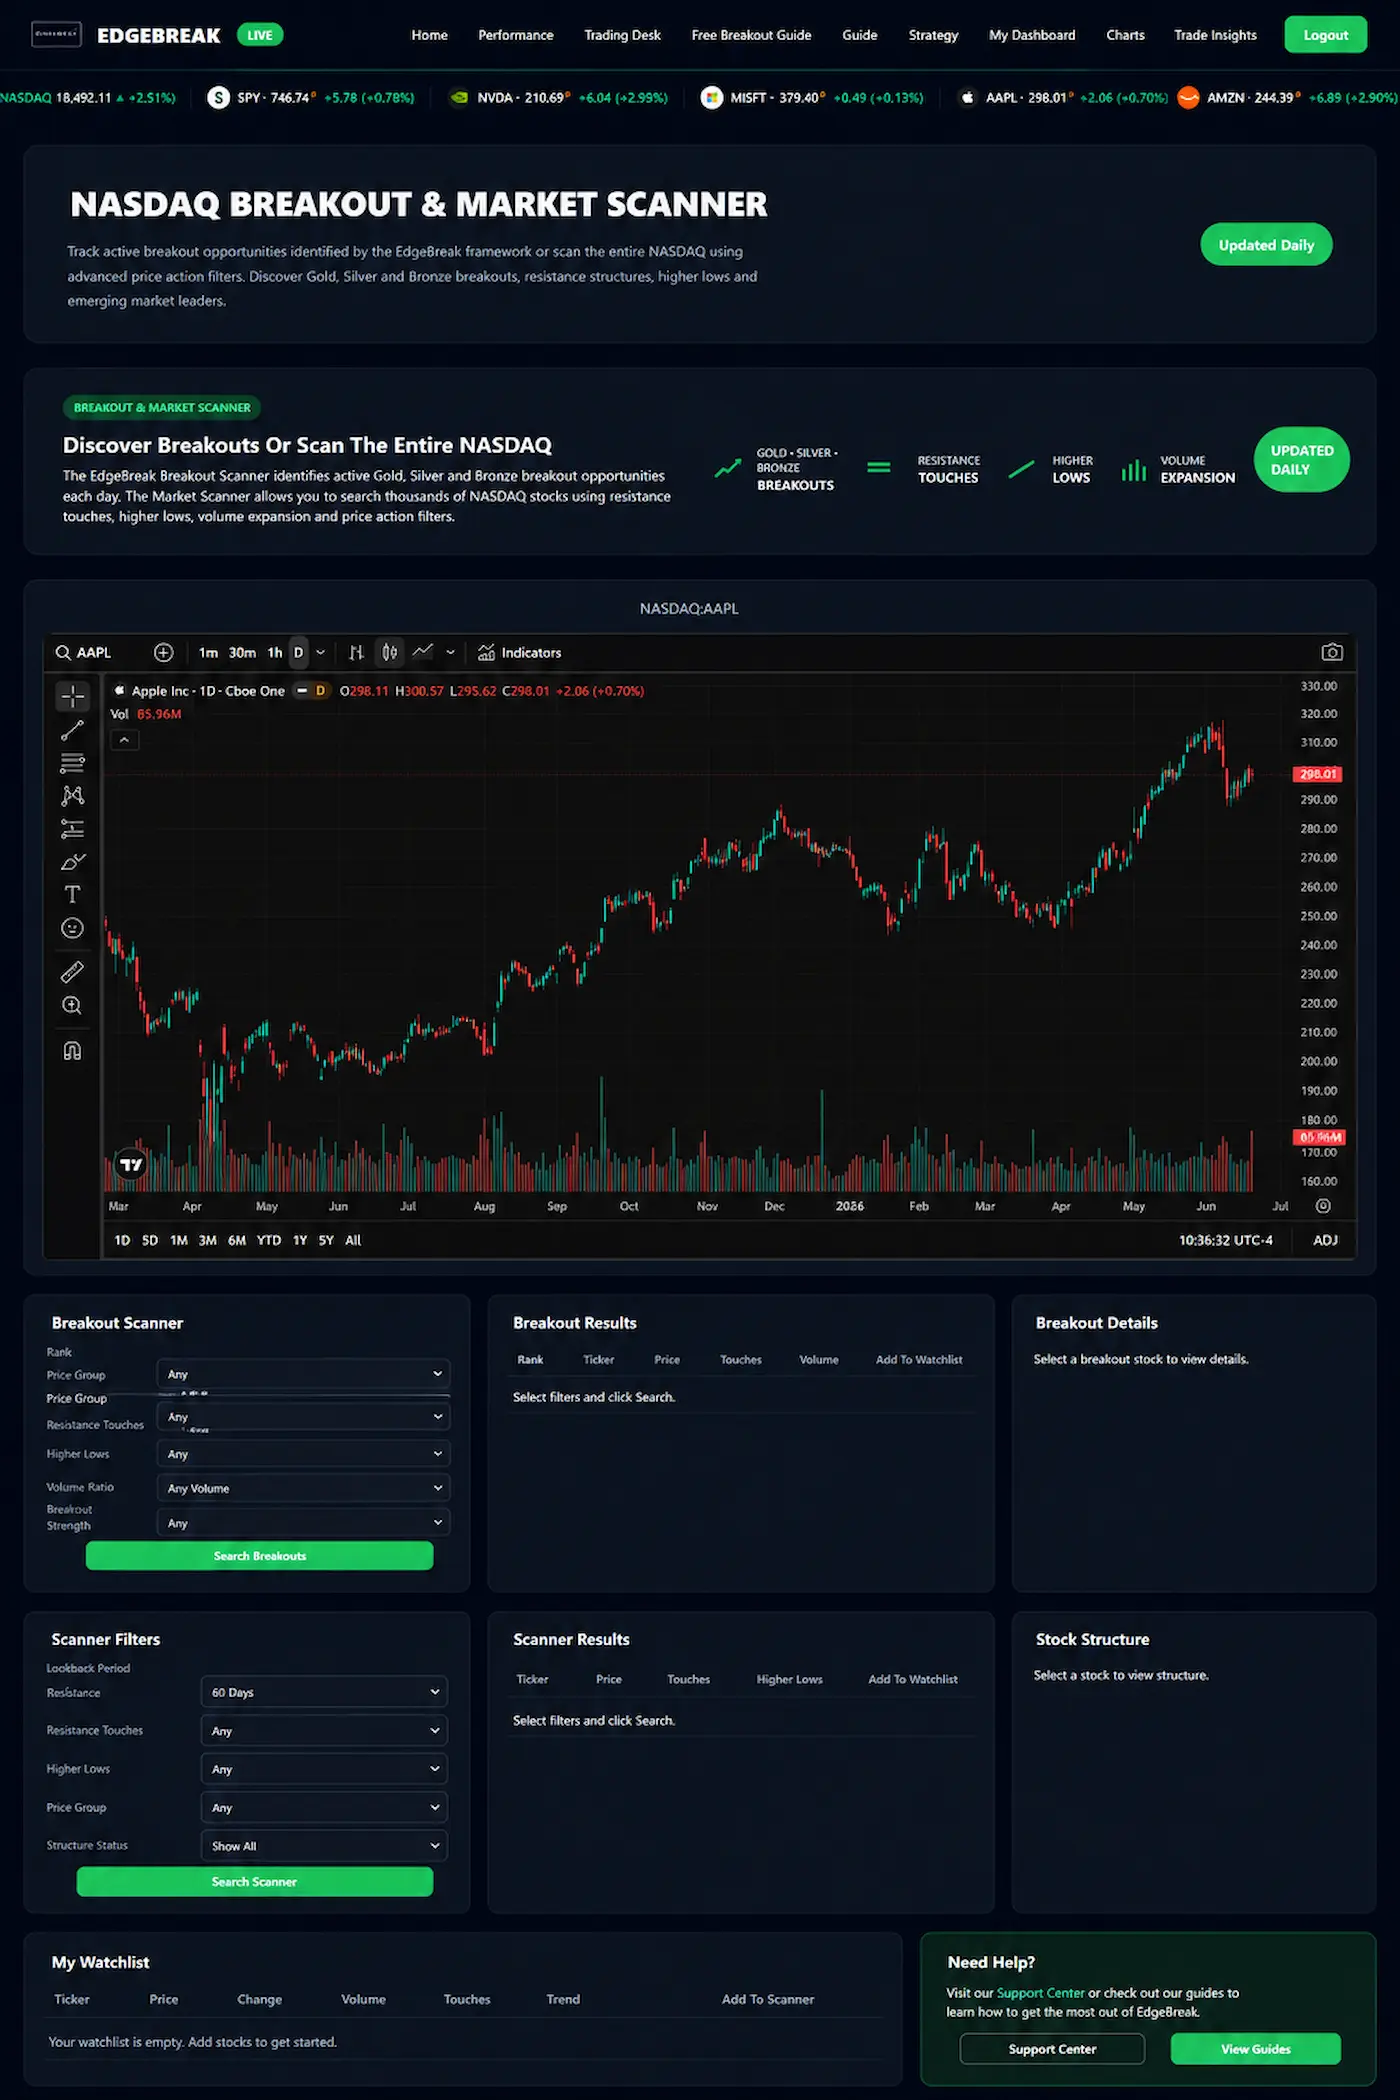
What Is a Breakout Stock Scanner?
A breakout stock scanner is a technical research tool that searches thousands of stocks for price action that may be approaching a breakout. Instead of relying on news headlines or social media, breakout scanners analyse chart behaviour, helping traders identify stocks developing similar technical characteristics before significant price movement occurs.
How Breakout Stocks Develop
Most successful breakouts do not happen randomly. They often spend weeks or months building a base beneath resistance while buyers gradually absorb selling pressure. During this process, higher lows may develop, volatility often decreases and price begins tightening beneath an important resistance level. When demand eventually exceeds supply, price may break above resistance and begin a new trend.
What Should a Breakout Scanner Look For?
Every breakout stock scanner uses different rules, but many technical traders focus on several common characteristics when researching developing breakout opportunities.
- Multiple tests of resistance.
- Higher lows developing beneath resistance.
- Orderly price consolidation.
- Improving market structure.
- Healthy volume behaviour.
- Strong closes near resistance.
Why Manual Scanning Is Difficult
The NASDAQ contains more than 3,000 listed companies. Reviewing every chart every day is both time consuming and inconsistent. A breakout stock scanner applies the same research criteria across the entire market, allowing investors to narrow thousands of stocks into a manageable watchlist of potential opportunities.
Breakout Scanners Are Research Tools
A breakout scanner should not be viewed as a signal service or financial advice. Instead, it helps investors discover stocks that deserve further research. Technical characteristics can highlight promising opportunities, but every stock should still be analysed individually before making any investment decision.
Combining Multiple Research Factors
Many experienced investors combine breakout patterns with additional technical evidence. Market structure, accumulation characteristics, volume analysis, industry strength and institutional buying can all provide valuable context. The strongest research opportunities often occur when several independent technical characteristics align together.
How EdgeBreak Helps
EdgeBreak is a NASDAQ Market Intelligence Platform built around transparent, rules-based technical research. The EdgeBreak NASDAQ Stock Scanner analyses approximately 3,000 NASDAQ-listed stocks after every trading session, identifying repeated resistance tests, higher lows and developing breakout structures. Investors can combine these results with the Smart Money Filter, educational resources and My Workspace to create a more consistent research process.
Who Uses Breakout Stock Scanners?
Breakout stock scanners are commonly used by swing traders, momentum traders and long-term investors who prefer to focus on technically strong companies. Rather than searching the entire market manually, investors can spend more time researching quality setups and less time trying to find them.
Final Thoughts
A breakout stock scanner helps simplify one of the most time-consuming parts of technical analysis—finding potential breakout opportunities. By combining market structure, resistance analysis, higher lows and volume behaviour, investors can build a more structured approach to researching NASDAQ stocks. EdgeBreak is designed to support this research process through transparent market analysis and educational content and should not be considered financial advice.