Technical structure comes first
EdgeBreak begins with observable market structure. Breakouts, pre-breakouts, reversals, higher lows, support, resistance and organised bases can all help identify whether a stock is technically worth investigating.
The platform is deliberately selective. A stock should not be elevated simply because one indicator looks interesting. The surrounding structure and timing still matter.
Different scanners capture different stages
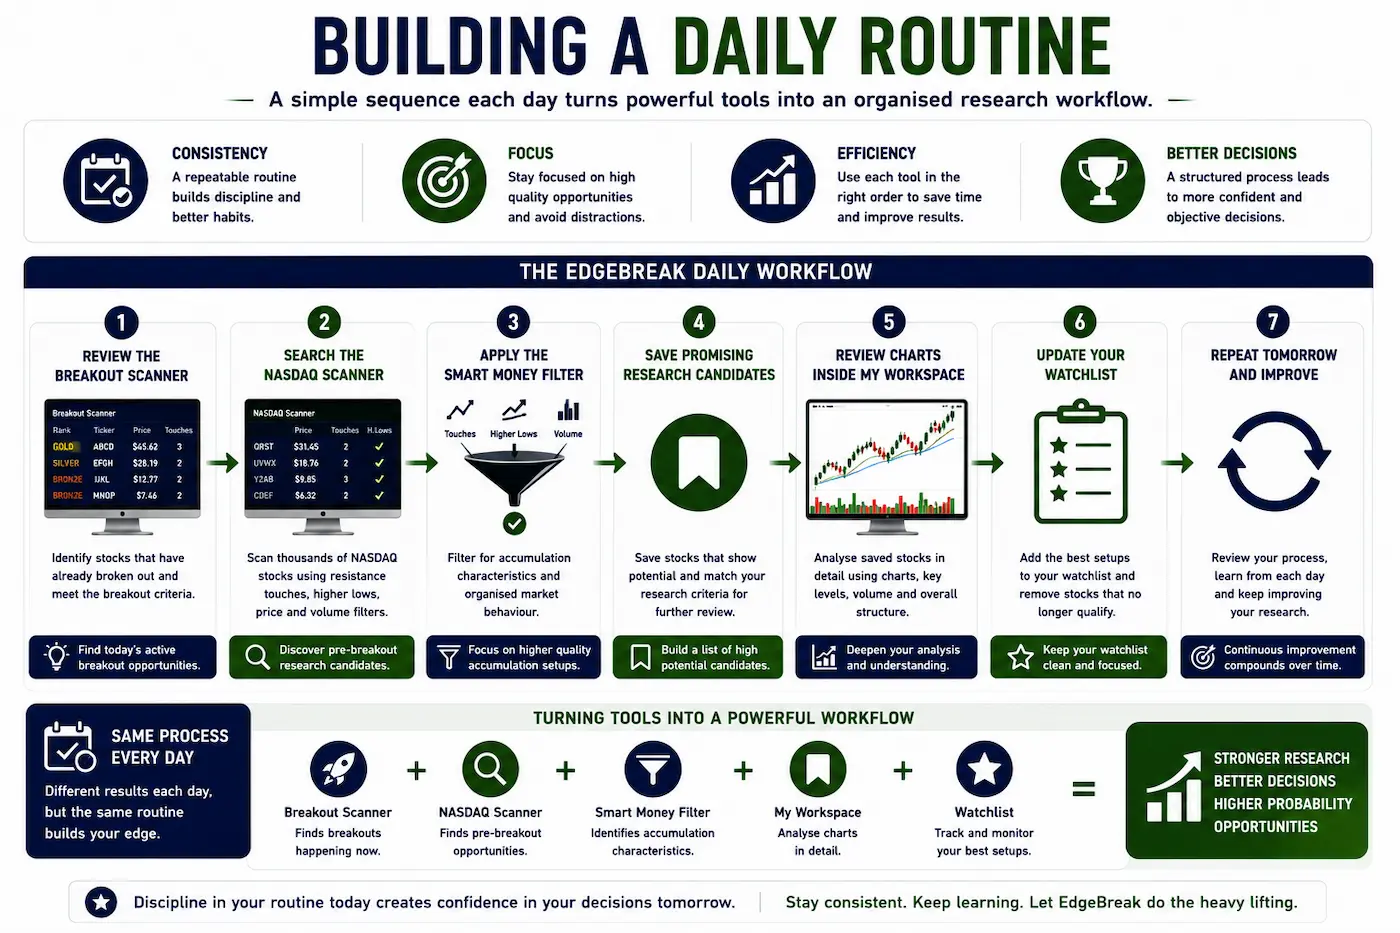
The Breakout Scanner looks for stocks moving through established resistance. The Pre-Breakout Scanner focuses on stocks approaching resistance while constructive structure develops underneath. Launch Pad looks earlier again, identifying organised bases that may still be developing.
These scanners are different windows into the same research process: find structure first, then decide whether it deserves more attention.
Market activity is evidence, not proof
EdgeBreak also examines unusual off-exchange and multi-venue market activity. This can be useful because it helps identify behaviour that stands out from a stock's recent history.
But the data has limits. Off-exchange activity does not reveal buy or sell direction and does not prove that institutions are accumulating shares. EdgeBreak treats it as additional context rather than a definitive signal.
Pressure matters when the structure supports it
The daily process also looks for evidence that technical and market-activity conditions may be building together. This does not mean pressure must resolve upward. It means several research layers are becoming relevant at the same time.
A stock with unusual activity but weak structure should not automatically rise through the rankings. Technical quality remains the foundation.
Six stocks is the beginning, not the answer
Surfacing six stocks does not mean six recommendations have been produced. It means the market has been reduced to a shortlist where deeper research is more practical.
From there, investors can investigate company information, earnings, financial direction, recent developments, filings, dilution risk, balance-sheet questions and the chart itself.
AI is used to investigate, not decide
EdgeBreak uses AI to help organise company research and explain visible chart structure. AI can make information easier to navigate, but it can still be incomplete, outdated or wrong.
The system therefore keeps AI in the research role. It does not ask AI to issue a buy, sell or hold call, and important information should still be independently verified.