Trading Insights

Breakout
Stock Picks.

Learn how stock scanning, resistance, higher lows, consolidation and volume can help surface NASDAQ breakout candidates worth investigating further.

Breakout Research August 2026 9 min read
Breakout Stock Picks

What are breakout stock picks?

Breakout stock picks are stocks selected for further research because their technical structure appears to be approaching, testing or moving through an important resistance area.

The phrase can sound more certain than it really is. A stock appearing on a breakout shortlist is not automatically a good investment and it does not mean a breakout will succeed. The value is in using consistent criteria to reduce a large market into a smaller group of stocks that deserve closer investigation.

Why use a stock scanner?

Reviewing more than 3,200 NASDAQ-listed stocks manually is not realistic for most investors. A stock scanner can apply the same technical rules across the market and identify companies whose current structure matches the research criteria.

This changes the job from searching thousands of charts to investigating a much smaller list of candidates.

The key idea

Do not search for a winner.
Search for a structure worth researching.

A scanner cannot know which stock will become the next major breakout. What it can do is consistently surface technical structures that meet defined criteria so the investor can spend more time on deeper research.

Breakout research

What a stronger candidate may show.

No single characteristic makes a breakout candidate strong. The structure becomes more useful when several constructive behaviours appear together.

01
Clear resistance Price has repeatedly reacted around a recognisable resistance area.
02
Higher lows Pullbacks begin finding support at progressively higher levels beneath resistance.
03
Tight consolidation Price becomes more organised rather than increasingly volatile inside the base.
04
Volume context Volume is considered alongside price structure rather than used as a standalone signal.
05
Limited extension The stock remains close enough to its base that the original structure is still relevant.
Different stages

Building the base
versus testing the level.

Base forming

Earlier-stage candidates are still developing the technical foundation that may later support a breakout attempt.

✓
Support and resistance are becoming established.
✓
Price remains inside an organised trading range.
✓
Higher lows or improving structure may begin to appear.
✓
The stock may still need time before resistance is challenged.

Near resistance

Later-stage candidates are closer to the level that separates the existing base from a possible breakout attempt.

—
Resistance is being tested more directly.
—
Price may be tightening beneath the level.
—
Volume and broader market context become more relevant.
—
The structure can still fail or reverse despite appearing constructive.

Pre-breakout research

Pre-breakout candidates are stocks approaching resistance while the underlying structure remains constructive. Higher lows, repeated resistance interaction and tightening price action can make these stocks worth investigating before a breakout attempt occurs.

The purpose is not to predict that resistance will break. It is to identify a stock at an earlier stage of the process so the investor can research the company and monitor how the structure develops.

Breakout research

Once price moves through resistance, the research question changes. The important issue is no longer simply whether resistance exists, but whether the move remains technically meaningful and whether the stock has already become too extended from the original base.

Breakout research should still consider the quality of the prior structure, volume behaviour, broader market conditions and the company information behind the move.

Launch Pad research

The Launch Pad Scanner is designed for stocks that are still building organised bases within established trading ranges. These structures can include repeated resistance tests, stable or improving support and enough time for the base to become technically meaningful.

This creates a different type of research list: not stocks already moving aggressively, but companies whose technical foundation may deserve continued monitoring.

Avoid chasing the move

One of the biggest problems with breakout stock picks is that a stock may look attractive only after a large move has already happened.

Once price becomes too extended above the original resistance area, the technical base that created the research idea becomes less relevant. A disciplined process therefore needs to distinguish between a developing breakout structure and a stock that has already moved too far from it.
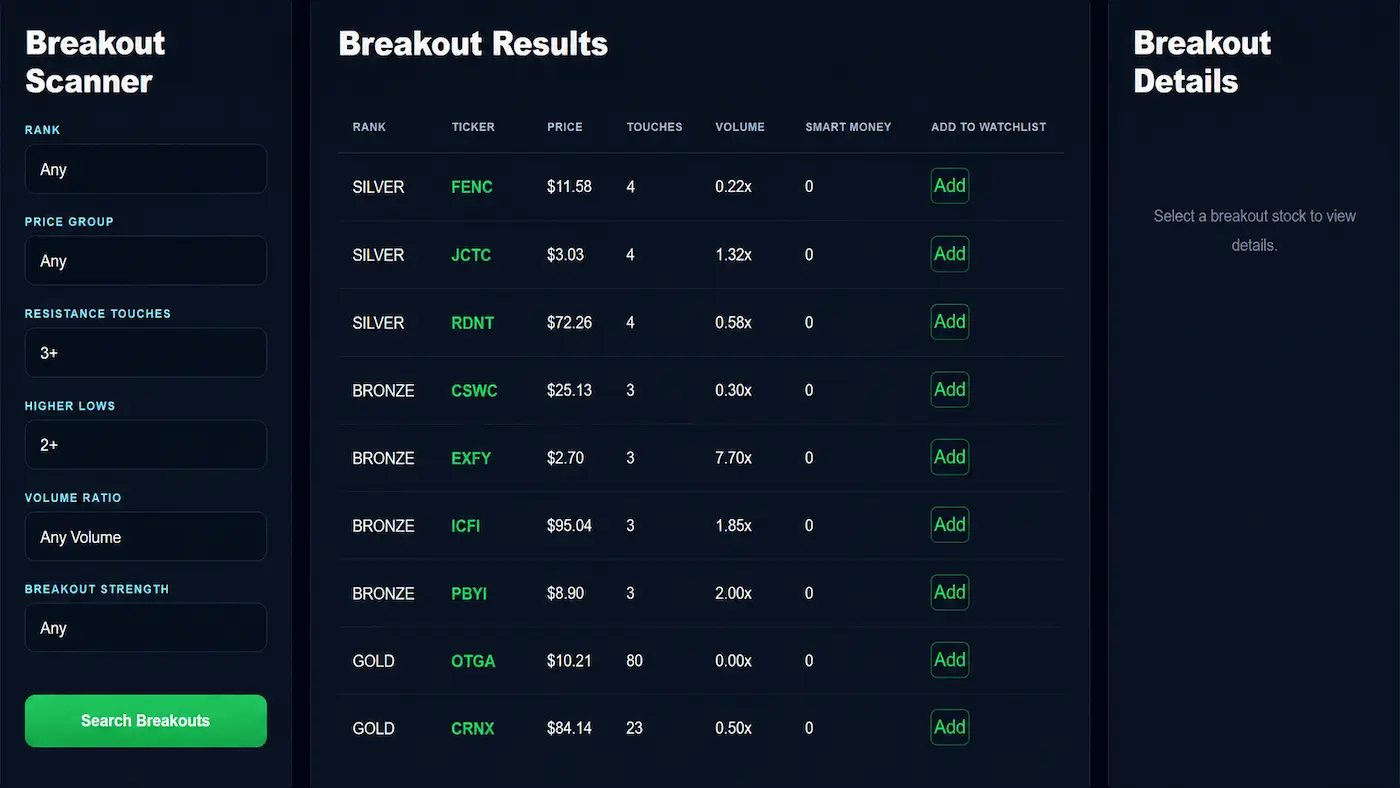
How EdgeBreak approaches this

Scan the market.
Then investigate the shortlist.

EdgeBreak uses rules-based NASDAQ scanning to reduce thousands of stocks into a smaller research set. Technical structure comes first, while market activity, company research and AI chart analysis add further context.

✓
Multiple technical scanners Breakout, Pre-Breakout and Launch Pad research identify stocks at different stages of technical development.
✓
Market activity context Unusual off-exchange and multi-venue behaviour can add evidence without being labelled confirmed institutional buying.
✓
Deeper independent research Company information, filings, news, watchlists and AI chart analysis help users continue investigating each candidate.

Final thoughts

Finding useful breakout stock picks is less about predicting the next winner and more about building a consistent process for discovering technically relevant candidates.

Clear resistance, higher lows, tighter consolidation, volume context and limited extension can all help describe the quality of a setup, but none of them guarantee what happens next.

A scanner is most valuable when it reduces the search problem and gives the investor more time to investigate the companies and structures that genuinely deserve attention.

Scan less

Investigate
what matters.

Use EdgeBreak to scan more than 3,200 NASDAQ-listed stocks, surface technical candidates and continue your research with market activity, company information and chart analysis.

Chart Analyzer $25 • Standard $35 • Full Access $50
Research and educational information only • Not financial advice