01
SearchChoose the setup.
Search NASDAQ and NYSE stocks for Breakouts, Pre-Breakouts, technical bases, stocks near resistance and other supported setups.
Find breakout, pre-breakout and technical base setups across supported NASDAQ and NYSE stocks. Review charts and Stock Hub research, or use AI Chart Analyzer and Find Similar Charts to investigate your own setup.
Scanning, charts and research in one platform. Compare EdgeBreak plans.
NEW: Pattern Recognition — compare 1-month (21 sessions) and 2-month (42 sessions) stock-chart shapes, included with EdgeBreak Chart Analyzer and Swing Trader at no extra charge. Explore Pattern Recognition →
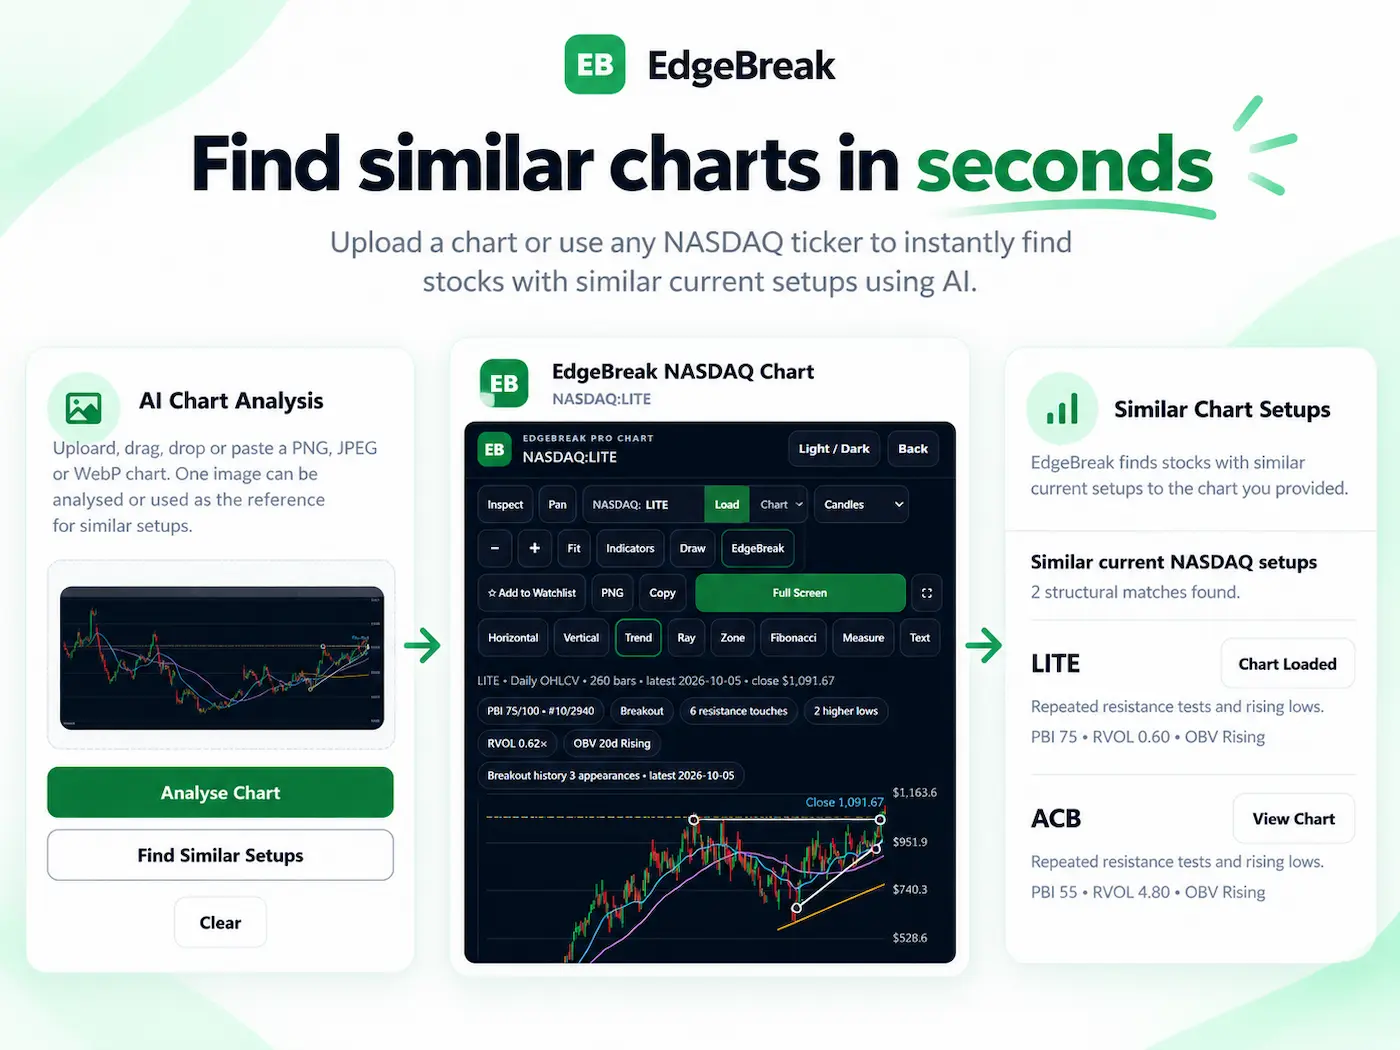
Choose Analyse Chart for an AI-assisted description of visible support, resistance and price structure. Or choose Find Similar Charts to look for comparable formations in EdgeBreak's supported US stock datasets. Neither tool predicts the next move.
Continue with Chart Analyzer for US$9/month (eligible first-time customers: 3-day trial). Stock Hub included; 900 AI Credits per billing cycle.
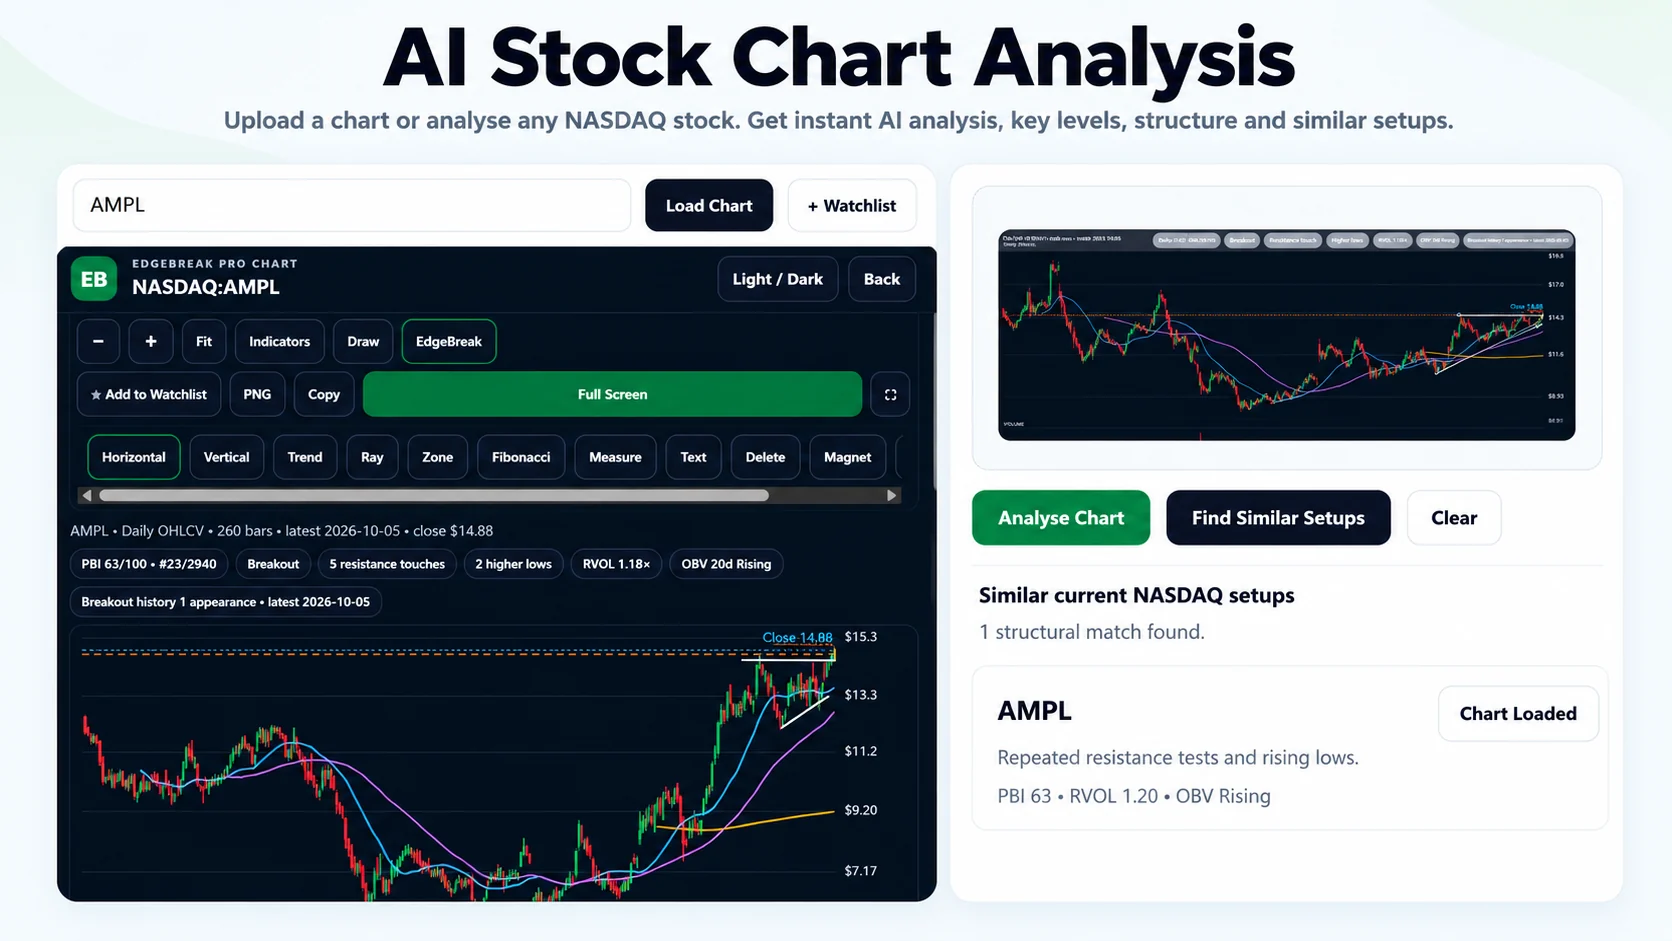
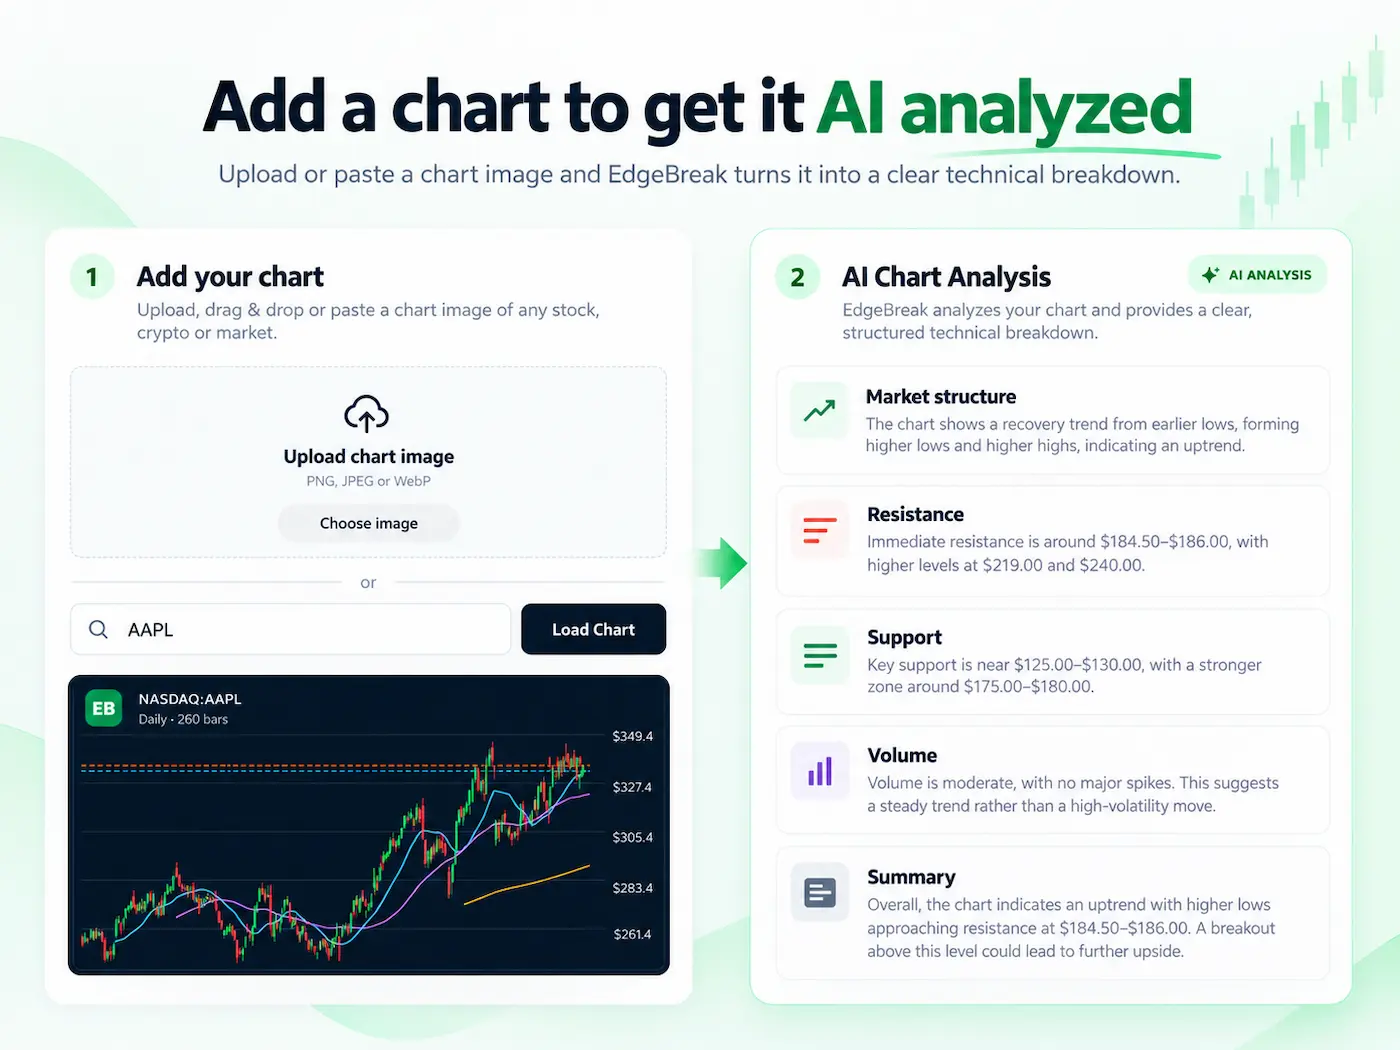
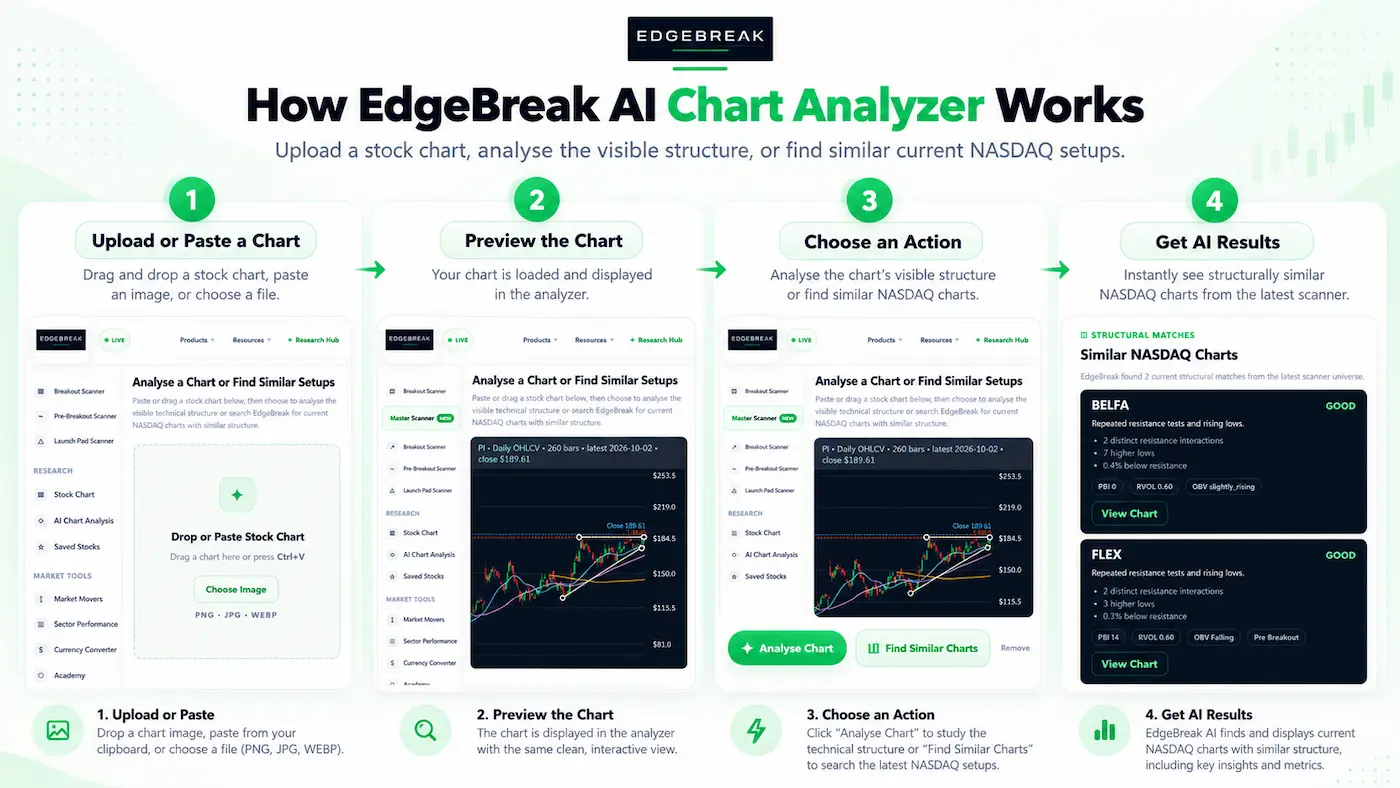
Try the free chart tools first. If a setup interests you, inspect the current chart, research the ticker in Stock Hub, save what matters and set price alerts where available.
EdgeBreak offers published daily shortlists and a US Stock Market Scanner with technical filters. Higher-tier plans add the full Master Scanner and saved searches so traders can search for setups across supported NASDAQ and NYSE stocks.
Search NASDAQ and NYSE stocks for Breakouts, Pre-Breakouts, technical bases, stocks near resistance and other supported setups.
Refine results using available fields such as PBI, higher lows, resistance, support, OBV, relative volume, moving-average relationships and structure.
Create searches around the setups you actually want to find and save them so you can return without rebuilding the same filters.
Open the EdgeBreak chart, or upload another chart to AI Chart Analyzer and search available EdgeBreak charts for similar technical structures.
Continue into AI Stock Research for company information, financial highlights, recent news, filings and additional research context where available.
Use the EdgeBreak AI chat bar to describe a scanner search in normal language or ask questions about technical analysis, market structure and trading research.
Explore automated breakout scans, technical filters, Stock Hub, charts and AI-assisted research. AI Chart Analyzer and Find Similar Charts are additional tools for analysing a chart you already have.
Upload, paste or drag in a stock chart. EdgeBreak AI can organise the visible technical structure or use it as the reference for a search across available EdgeBreak charts with similar structure.
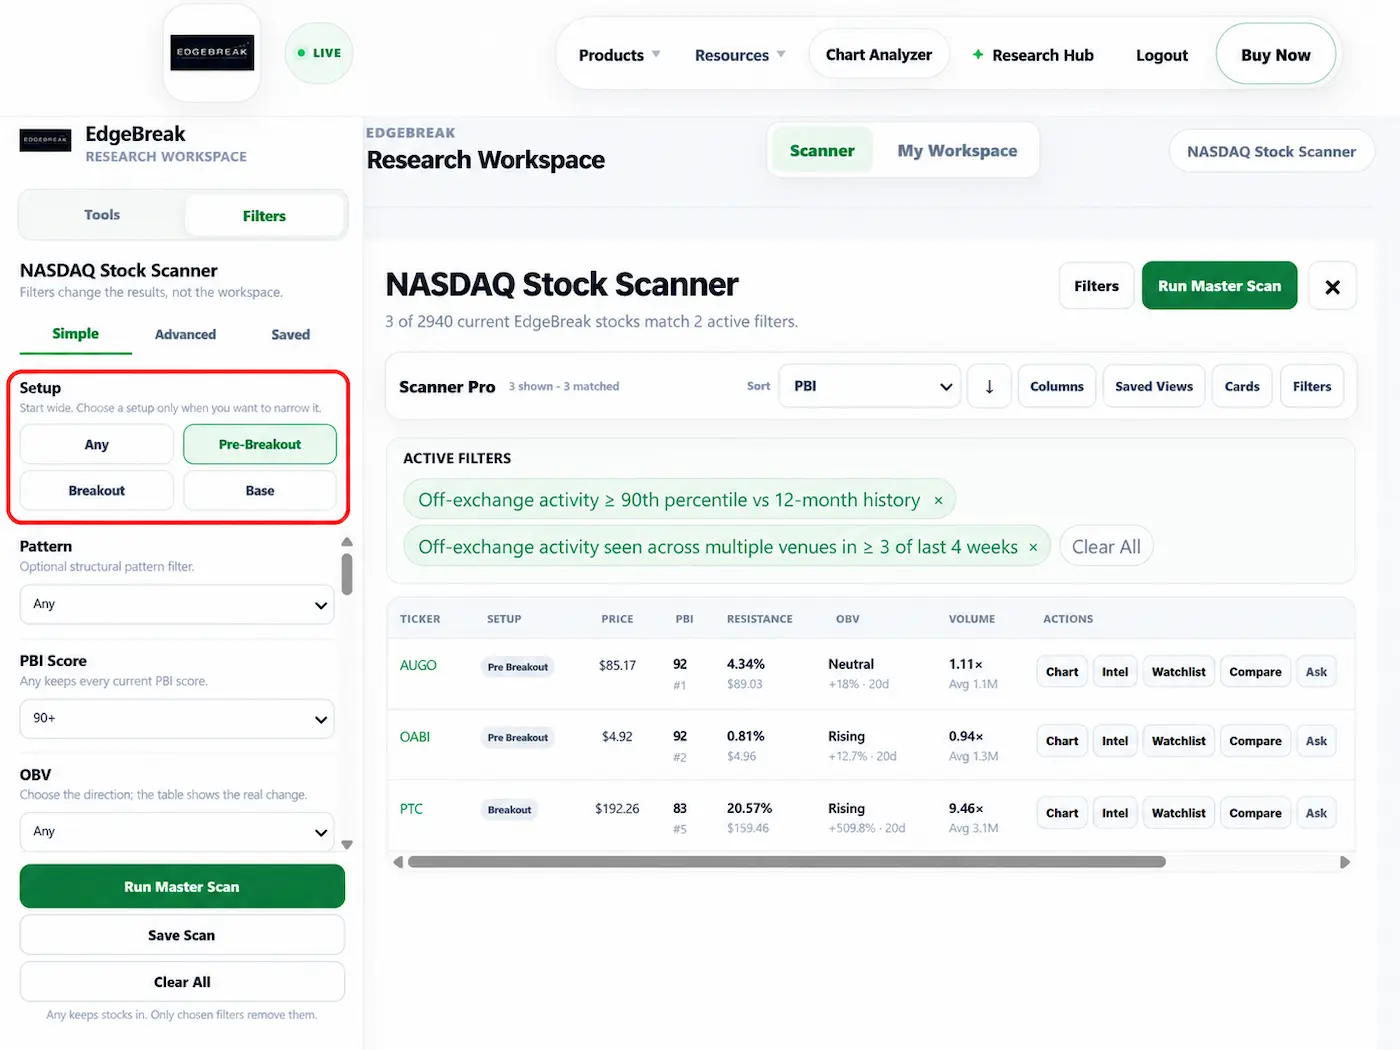
Use one Master Scanner to search NASDAQ and NYSE stocks. Filter by PBI, higher lows, resistance, support, OBV, RVOL, moving averages and other available technical fields, then create and save your own searches.
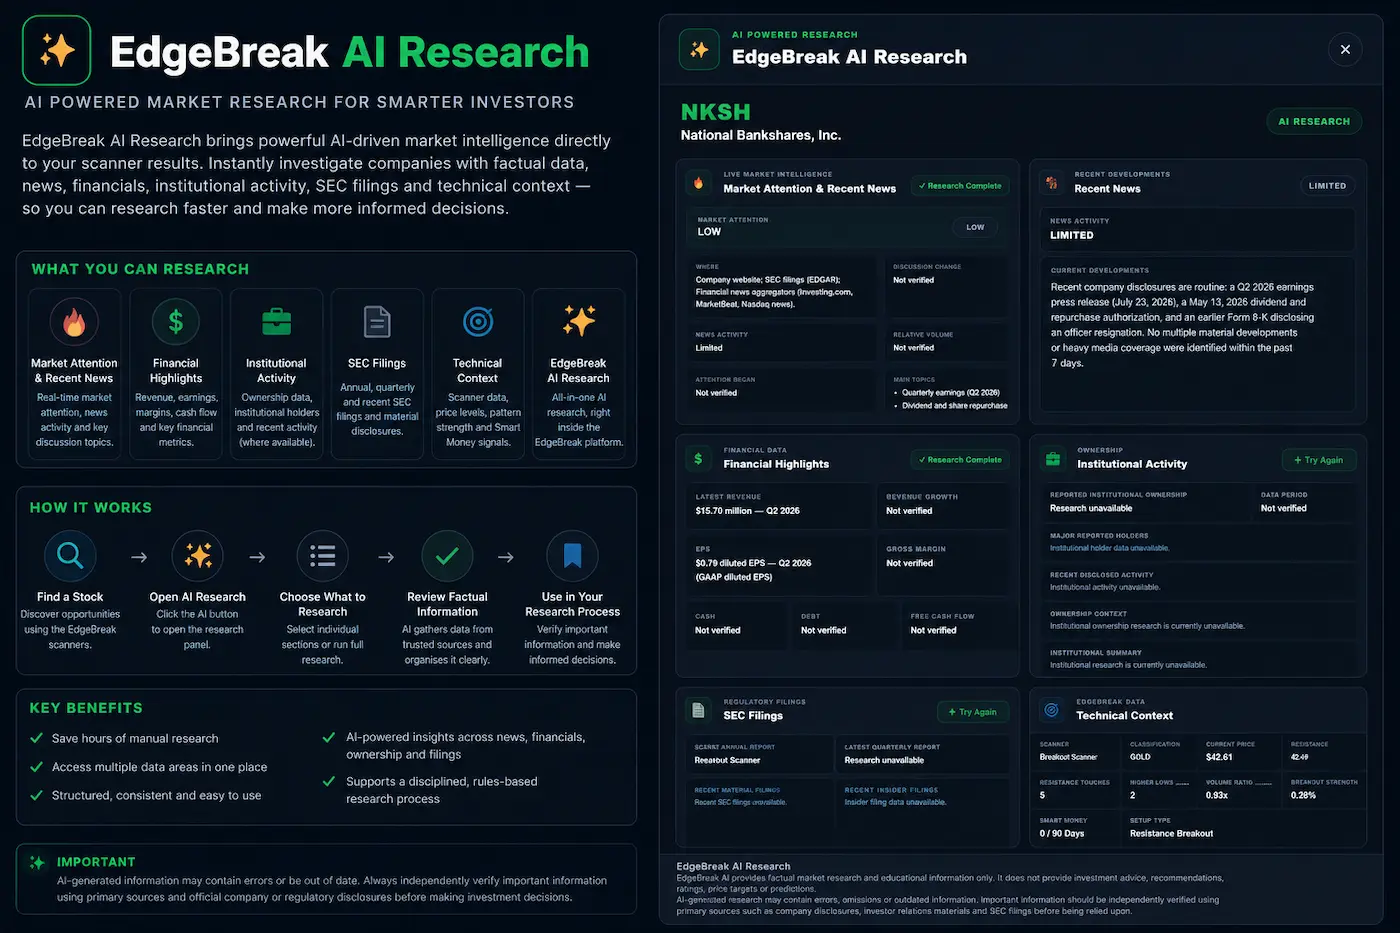
Continue into company research with available company information, financial highlights, recent news, SEC filings and other research context without losing the stock you are investigating.
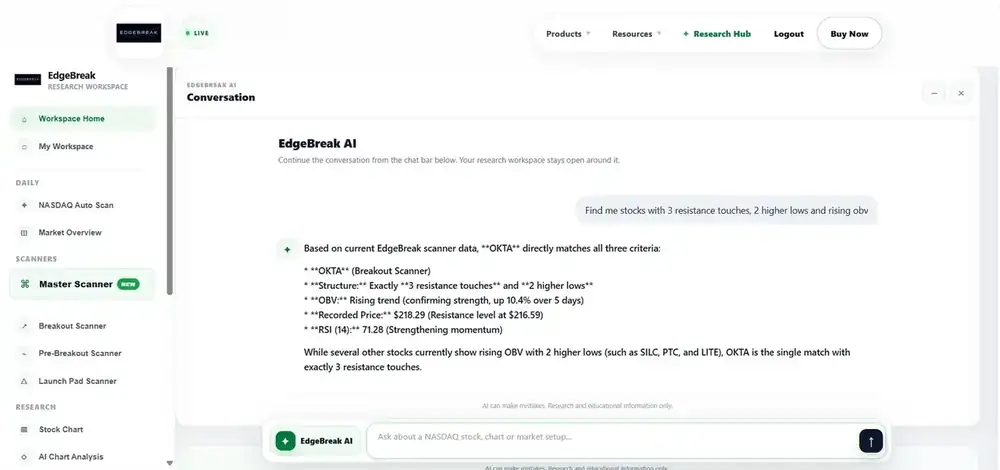
Use the AI chat bar in normal language: describe the setup you want EdgeBreak to find, refine the current results conversationally, or ask general questions about technical analysis, market structure, indicators and trading research.
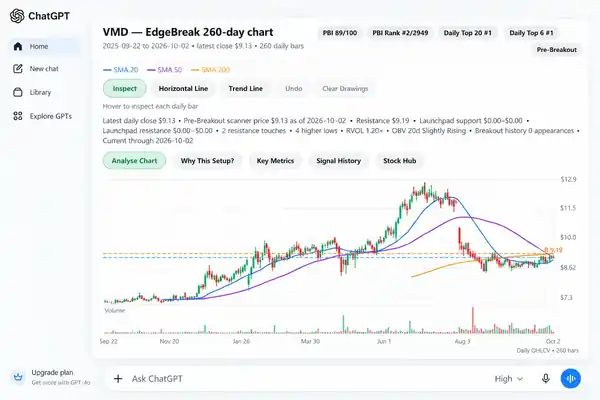
The EdgeBreak ChatGPT integration lets eligible Pro members search scanner results, refine setups, inspect charts and continue stock research inside ChatGPT. Availability and tools depend on supported integration capabilities.
The scanner is no longer a choice between separate destinations. Search published NASDAQ and NYSE results for technical conditions that matter to your research, with live prices during regular US trading hours.
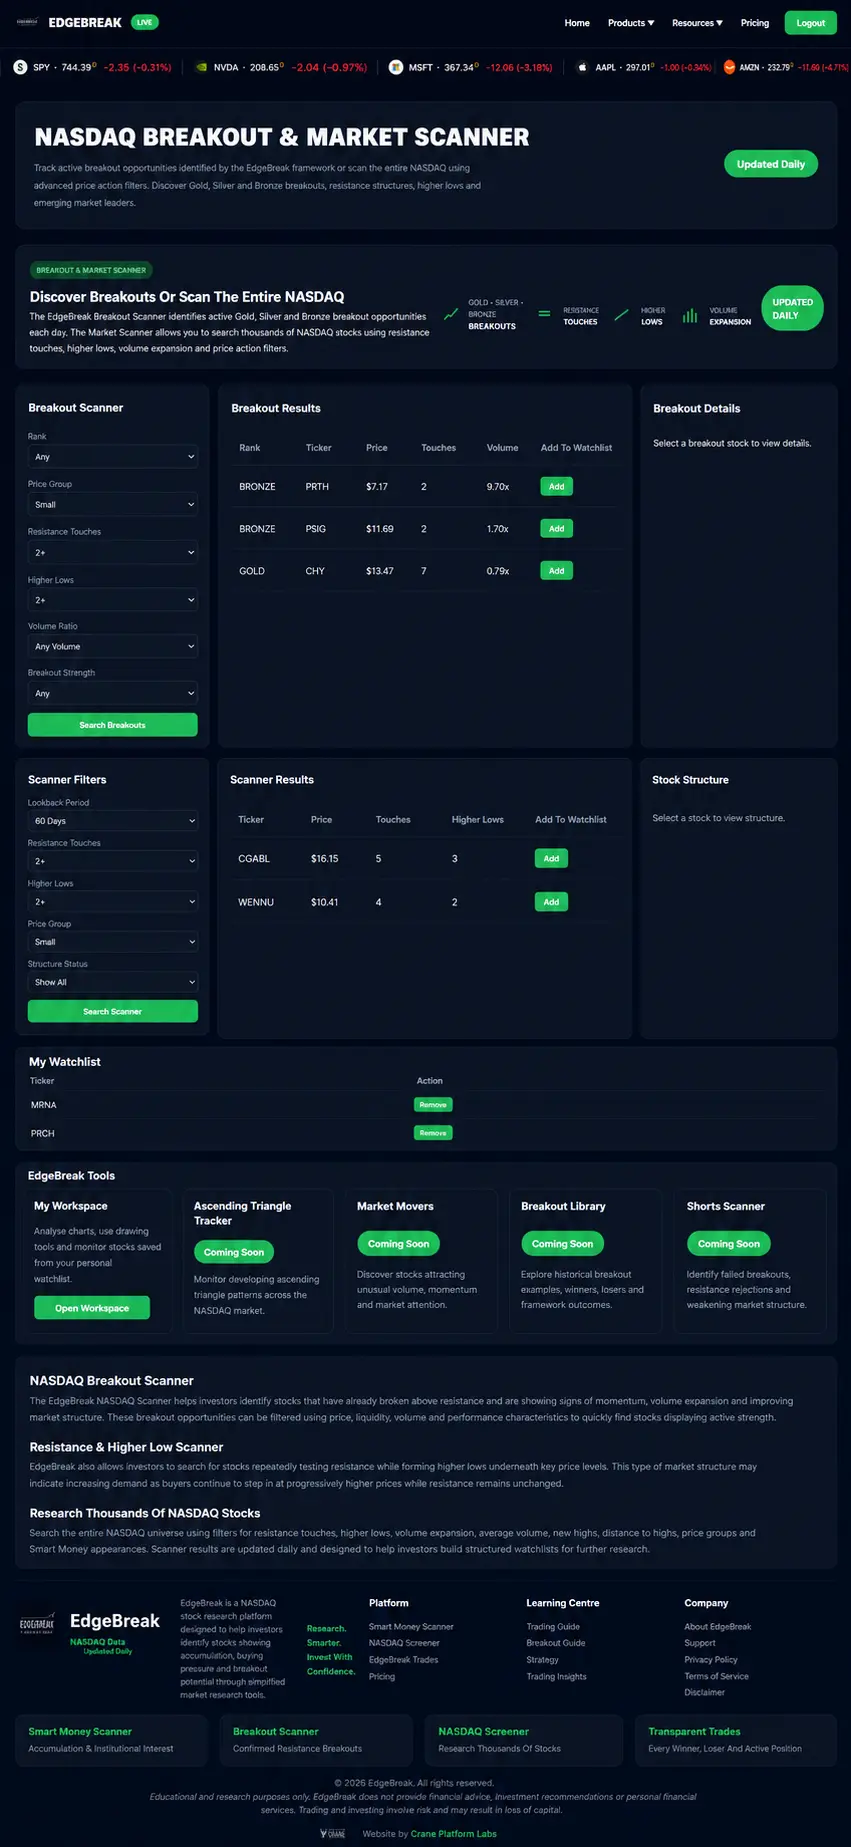
Start with a ready-made shortlist. EdgeBreak scans NASDAQ and NYSE stocks after US trading sessions, so you can open the latest published results and spend your time investigating the charts.
Review Auto Scans for Breakout, Pre-Breakout and Base setups, or explore EdgeBreak Signature Scans using our research-configured criteria. Open a candidate's chart, analyse its technical structure and continue your research in Stock Hub.
Updates follow completed scans for US trading sessions. Check the publication date; qualifying results vary. Research candidates, not trading recommendations.
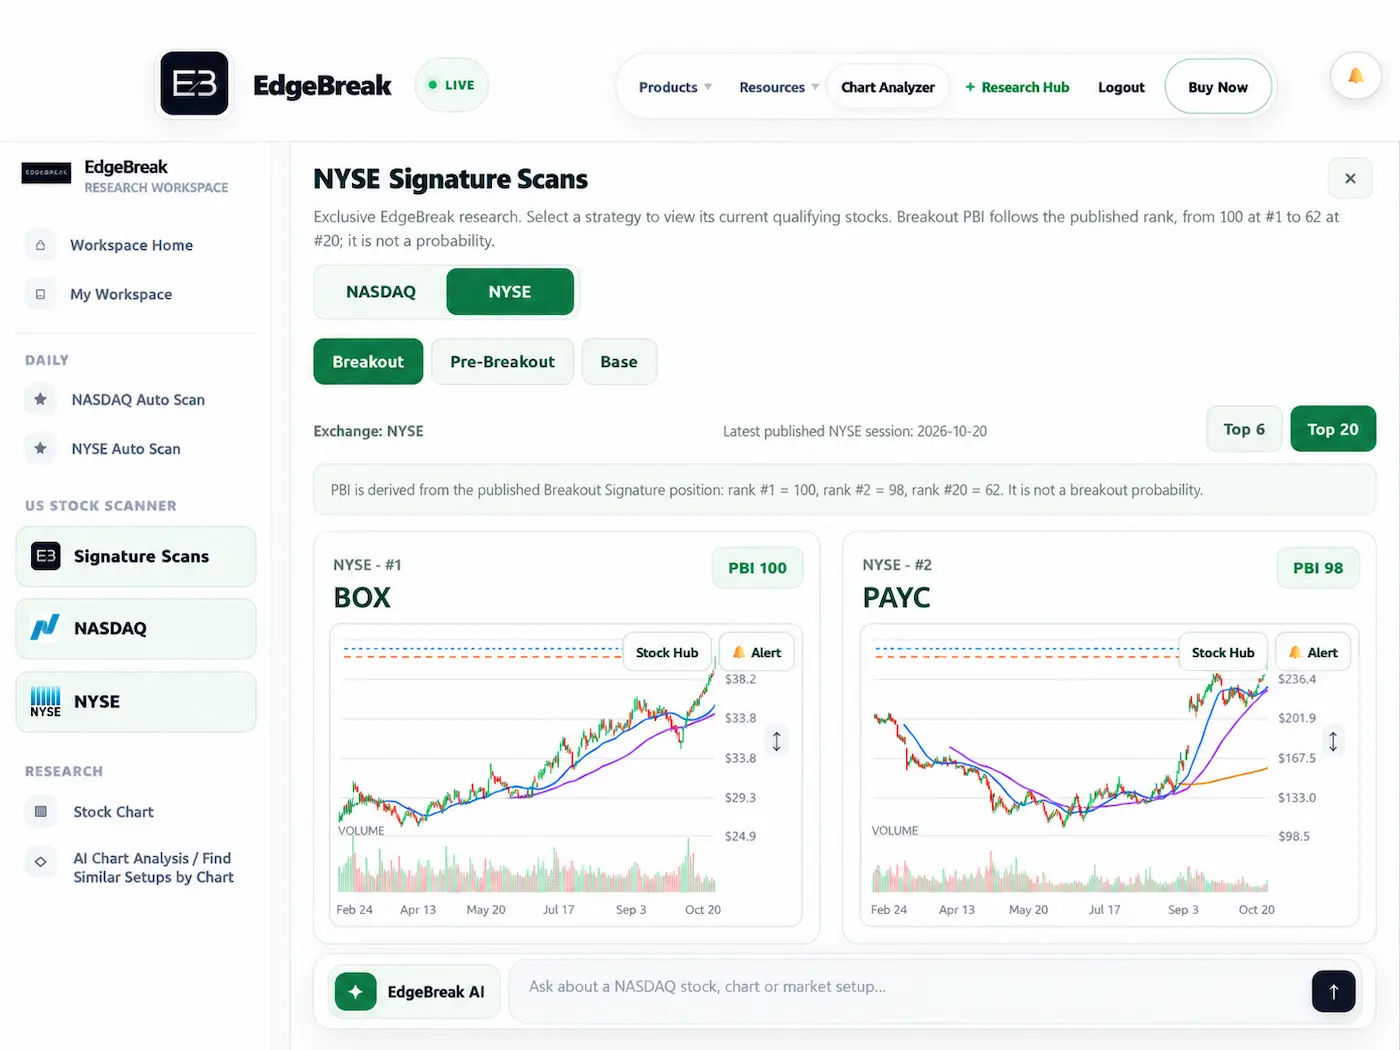
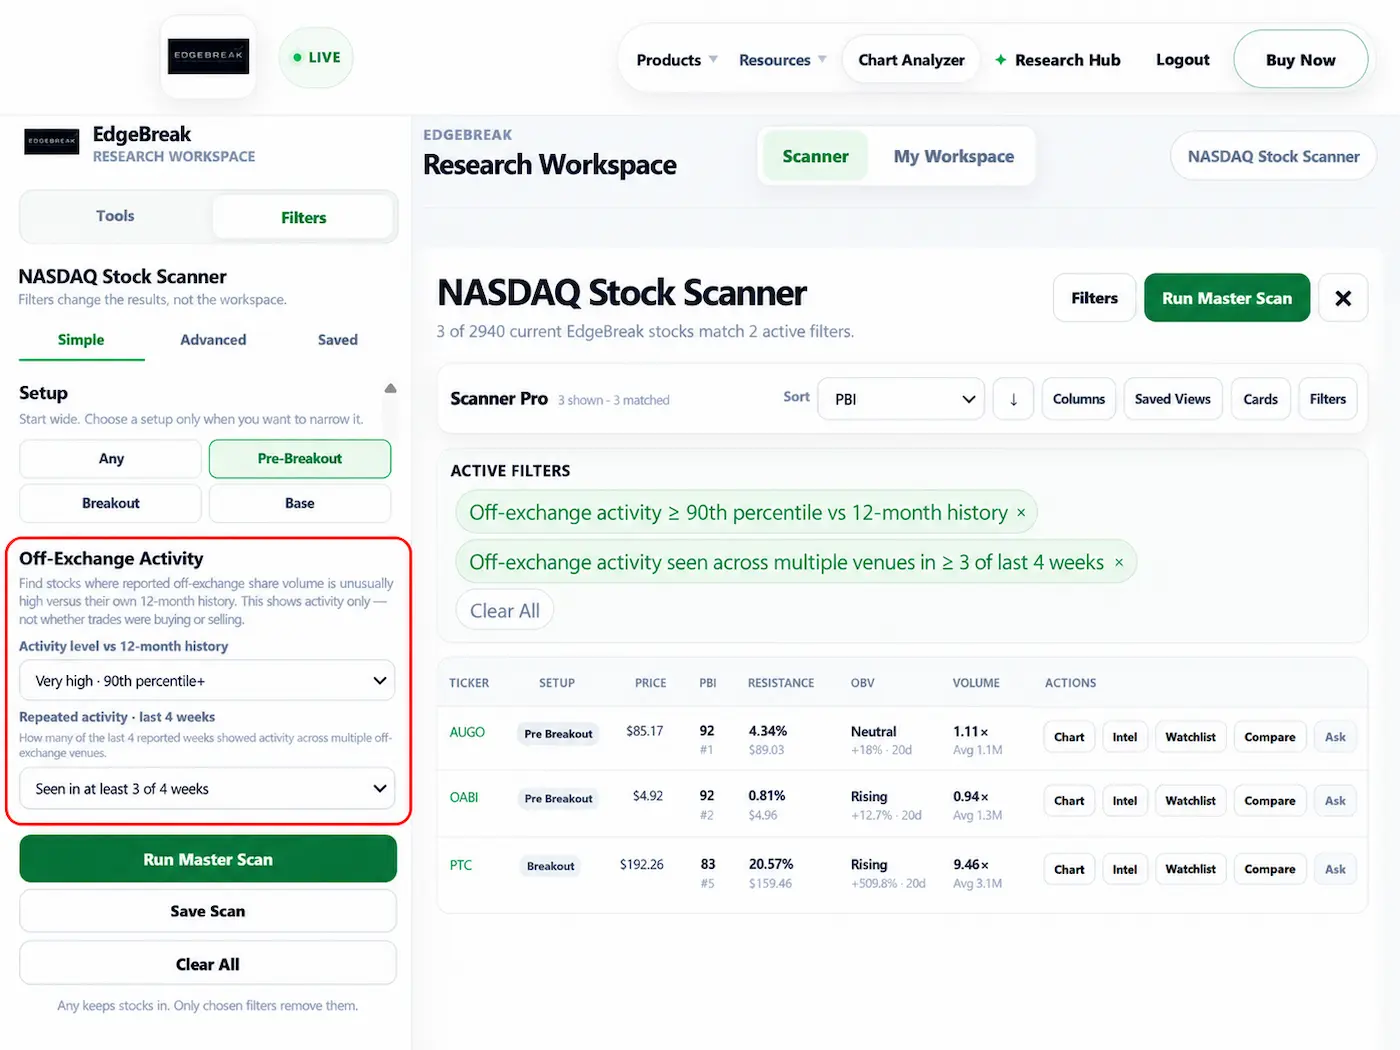
Traders often talk about “dark pool” activity. EdgeBreak gives you a more complete research lens: reported off-exchange trading activity, measured against a stock's own history and organised into signals you can investigate.
Look for unusual participation footprints — even when a chart alone doesn't tell the full story — and compare them with higher lows, resistance, OBV, RVOL and PBI.
This is analysis of reported market activity, not non-public insider information. Off-exchange does not necessarily mean a dark-pool trade; these records do not identify buyers or sellers or prove institutional accumulation.
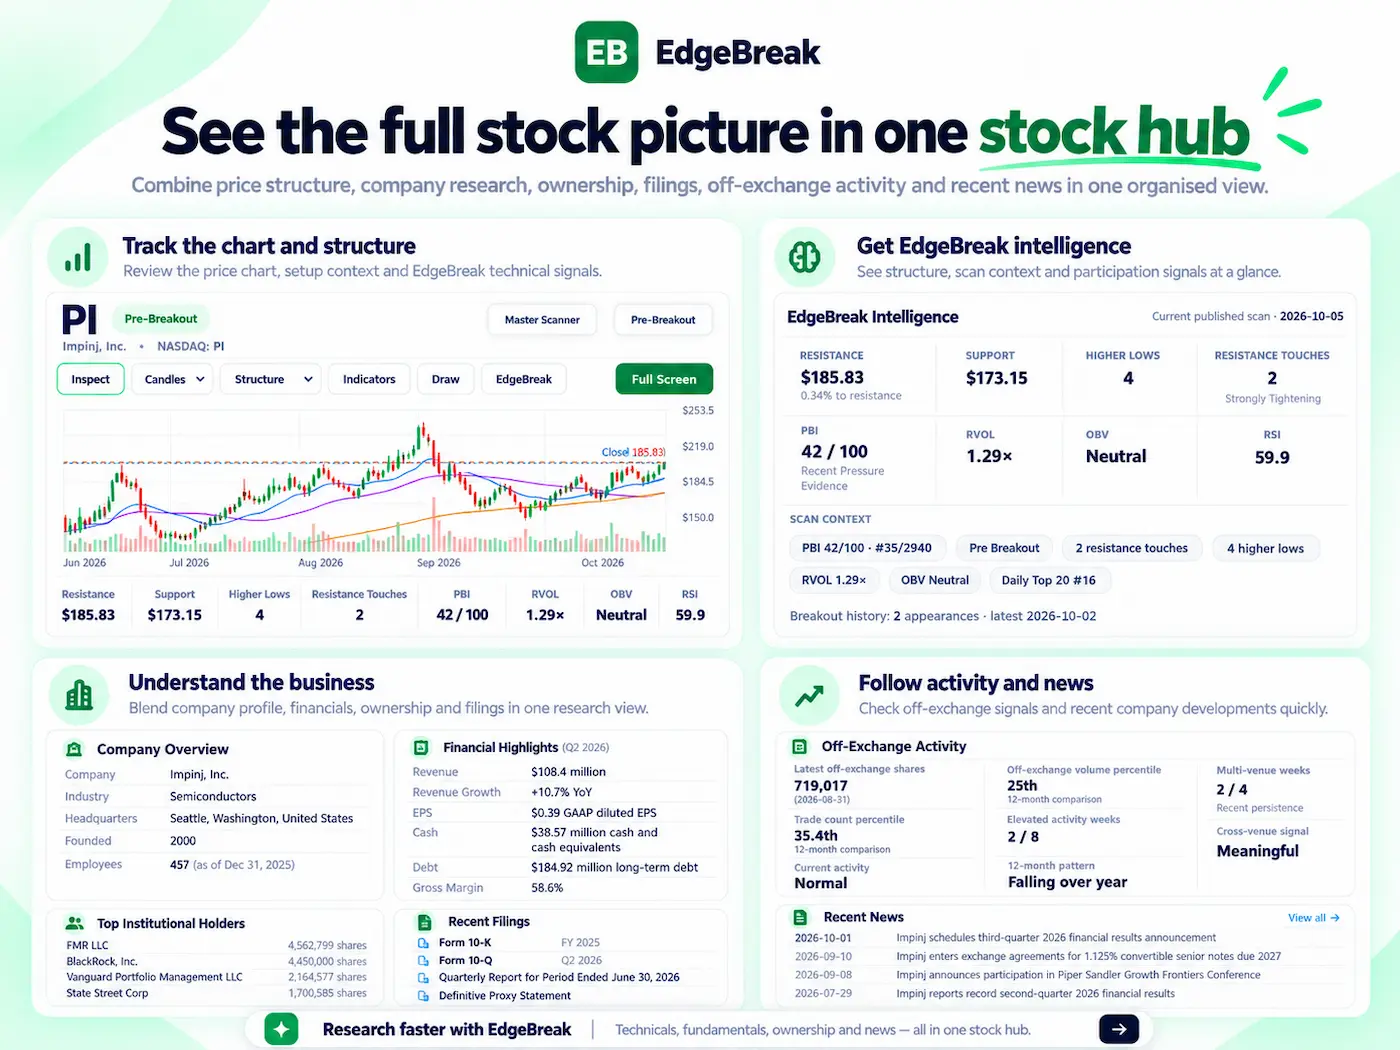
Open a ticker in Stock Hub and move from price structure into scanner intelligence, PBI, OBV, RVOL, signal history, off-exchange participation and deeper company research without jumping between unrelated tools.
Move through chart and price structure → current scanner intelligence → signal history → breakout history → off-exchange activity → company overview → financial highlights → available institutional research → SEC filings → recent news.
EdgeBreak supports both structured controls and normal conversation. Use whichever is faster for the question you are asking.
Describe the setup you want to find in plain language, refine scanner results conversationally, or ask general questions about charts, indicators, technical analysis and trading research.
Continue the same scanner and chart workflow inside ChatGPT. The integration is designed for natural questions, filtering, stock investigation, chart review and watchlist workflows without exposing the underlying tool complexity.
Saved searches, Watchlist, My Workspace, EdgeBreak Today and first-party charts support the main scanner and AI workflow instead of competing with it.
Build the combinations you care about — for example structure, resistance, PBI, participation or volume conditions — and save the search for later use.
Save stocks to your Watchlist, use My Workspace to continue the investigation, and return to EdgeBreak Today to review current published changes and scanner context.
Create price alerts for supported NASDAQ and NYSE stocks using fresh observed prices during regular US trading hours.
Technical-condition alerts use completed daily scans. Review events in EdgeBreak notification history; optional device notifications depend on supported browsers, permission and delivery activation.
Explore Stock Alerts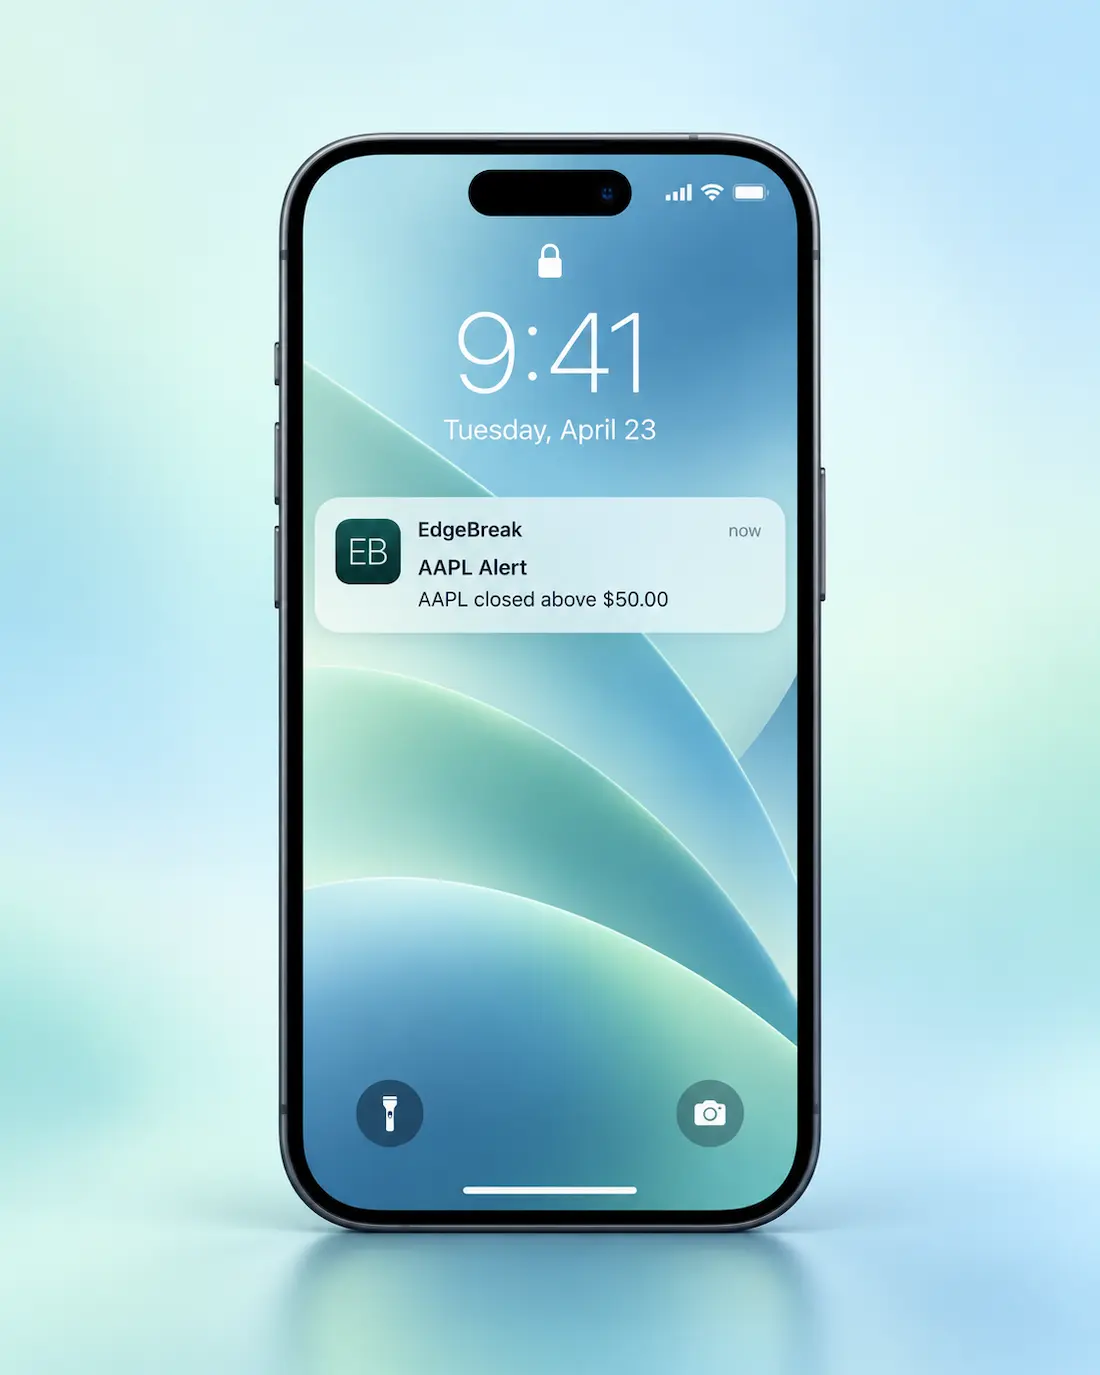
The scanner finds and filters candidates. EdgeBreak charts show the structure. AI Chart Analyzer can inspect or match a chart. Stock Hub adds company context. EdgeBreak AI and ChatGPT let you continue the investigation conversationally.
What EdgeBreak offers, how scanning and chart research work, and which tools are available with each plan.
EdgeBreak is a US stock-scanning, chart-analysis and research platform. Traders can explore NASDAQ and NYSE breakout and pre-breakout scans, use technical charting and Stock Hub, and investigate uploaded charts with AI Chart Analyzer or Find Similar Charts.
EdgeBreak AI Chart Analyzer reviews a stock-chart screenshot you upload and describes visible price structure, such as trend, support and resistance, consolidation and volume context. It helps organise technical evidence for research; it cannot predict future stock prices.
Upload a reference stock chart and choose Find Similar Charts. EdgeBreak searches available NASDAQ and NYSE charts for comparable technical structures. The search looks beyond a matching outline and results should be checked against current price and volume evidence.
Yes. The free chart tool includes one AI chart analysis and one Find Similar Charts search without creating an account or entering a payment card. Further use requires an eligible subscription.
No. You can upload a stock-chart screenshot even if you do not know the ticker. When you want ticker-specific price charts and technical indicator reports, open a supported stock symbol in the chart lookup.
Find Similar Charts searches currently supported NASDAQ and NYSE chart data, not every market or historical chart. Matches can include comparable bases, higher lows, compression and breakout-style structures when suitable candidates exist. A similar setup is not a forecast of a breakout.
Chart Analyzer is US$9/month and includes AI chart analysis, Find Similar Charts, Stock Hub and 900 AI Credits per billing cycle. Eligible first-time subscribers can receive a 3-day trial. Review eligibility and billing terms on the pricing page and at checkout.
Eligible Chart Analyzer subscribers can configure up to two live price-alert rules. Price checks use observed US market prices during regular trading hours; technical alerts rely on completed scans and plan access. Alerts can appear in EdgeBreak notification history. Optional device push requires permission, and end-to-end delivery has not yet been verified. See Stock Alerts.
Yes. The US$15/month Swing Trader plan adds published NASDAQ and NYSE Top 6 shortlists to Chart Analyzer. Master Scanner access, including advanced filters and saved scans, is available in higher-tier plans. These are research tools, not buy or sell recommendations.
EdgeBreak offers a ChatGPT integration for eligible Pro members. Available scanner, chart and research tools depend on the supported integration capabilities. Compare plans for current access and pricing.
No. AI chart analysis and similar-chart matching are educational research tools, not financial advice or instructions to buy, sell or hold a security. AI can make mistakes; confirm the chart data and your own risk assessment before making decisions.
Explore daily US stock scans, chart tools and Stock Hub. Try AI chart analysis and similar-chart search free, then choose the EdgeBreak membership that fits your research needs.