MODULE 6 β€’ LESSON 26

Common Breakout Research Mistakes

Estimated Time: 25 Minutes β€’ Becoming an Independent Market Researcher

Every investor makes mistakes during their research journey. The goal is not to eliminate mistakes entirely, but to recognise them early and continually improve your research process. This lesson explores some of the most common breakout research mistakes and demonstrates how a structured approach using EdgeBreak can help you avoid them.

What You'll Learn

  • Common research mistakes.
  • How emotions affect research.
  • Why consistency matters.
  • Building objective research habits.
  • Improving through experience.

Mistake 1 – Focusing Only on the Breakout

One of the most common mistakes is only looking at the breakout candle itself.

A breakout is simply one stage of a much larger market structure.

Always review the weeks or months leading into the breakout to understand how resistance, higher lows, accumulation and volume developed beforehand.
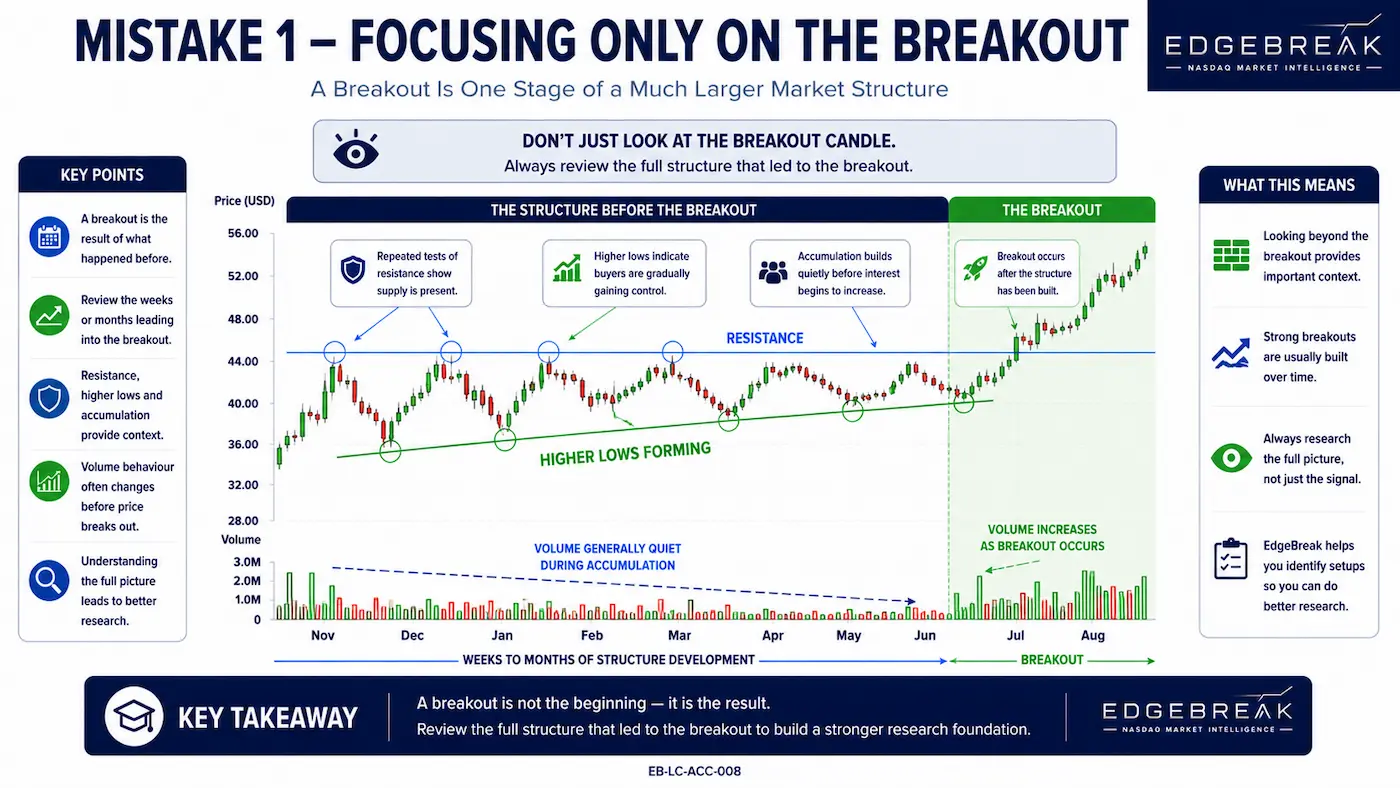
Breakout chart illustrating why investors should study the market structure leading into a breakout rather than focusing only on the breakout candle.
This illustration highlights that a breakout is only one stage of a much broader market structure. Before researching any breakout, it is helpful to examine how the chart developed over the preceding weeks or months, including repeated resistance tests, higher lows, accumulation and changes in volume. Understanding this context provides a more complete picture than focusing solely on the breakout candle itself. Within the EdgeBreak research process, analysing the entire structure encourages a more disciplined approach and helps members evaluate the characteristics that developed before a potential breakout, rather than relying on a single day of price movement.

Mistake 2 – Ignoring the Bigger Picture

It is easy to become focused on a single day's price movement while overlooking the broader trend.

Always compare the daily chart with the weekly chart to better understand the stock's overall market structure.

A breakout occurring within a healthy long-term trend often presents a different research picture than one developing against the broader trend.
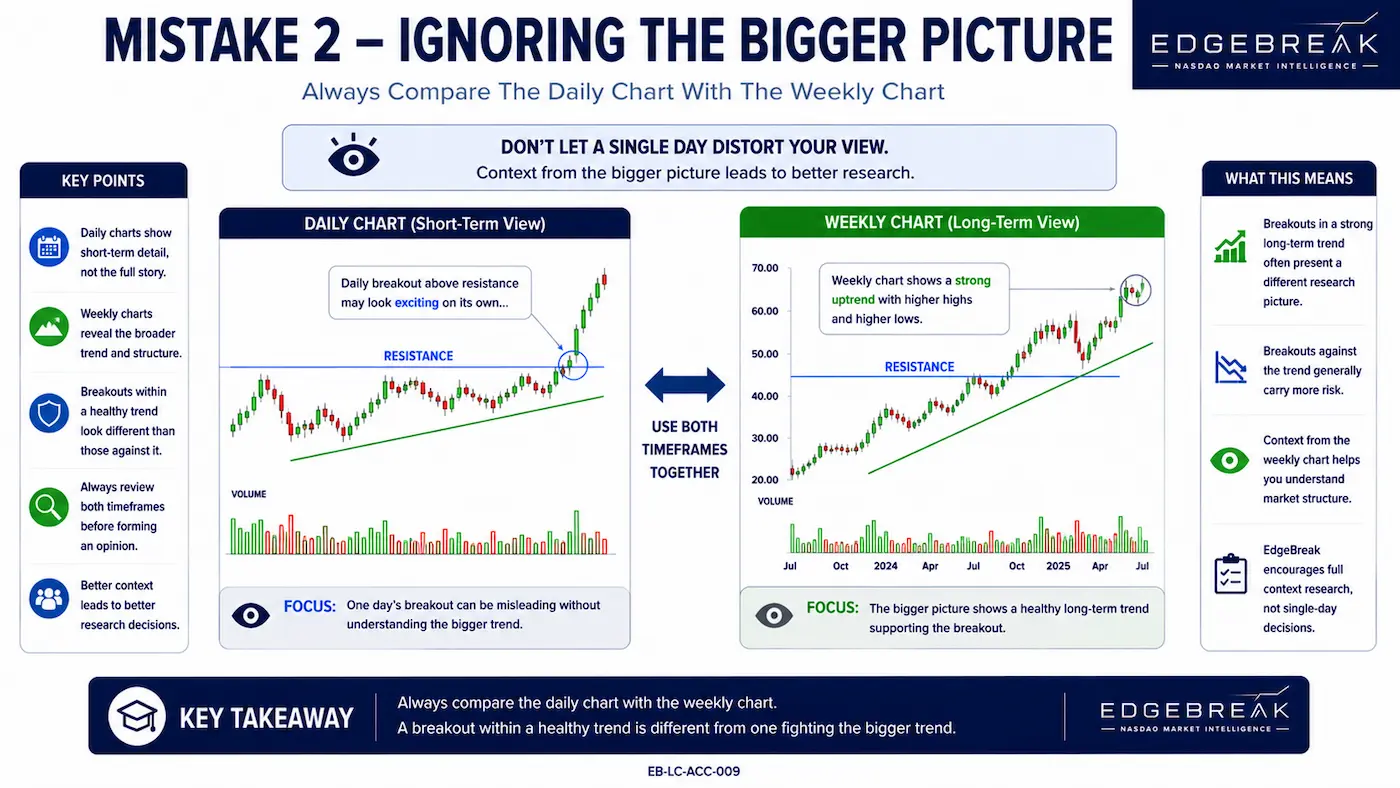
Comparison of daily and weekly stock charts showing how the broader trend provides important context for researching breakout opportunities.
This illustration compares the daily and weekly charts to demonstrate why analysing multiple timeframes provides valuable context during breakout research. While the daily chart highlights recent price action, the weekly chart reveals the broader market structure and longer-term trend that may not be obvious over shorter periods. Studying both timeframes together helps build a more complete understanding of how a breakout fits within the overall trend. Within the EdgeBreak research process, comparing daily and weekly charts encourages more balanced analysis and supports a structured approach to evaluating breakout characteristics without relying on a single timeframe.

Mistake 3 – Researching Only One Characteristic

Market research should never rely on a single characteristic.

Resistance touches, higher lows, accumulation and volume all provide valuable information, but they become much more meaningful when analysed together.

EdgeBreak has been designed to combine these characteristics into one organised research process.
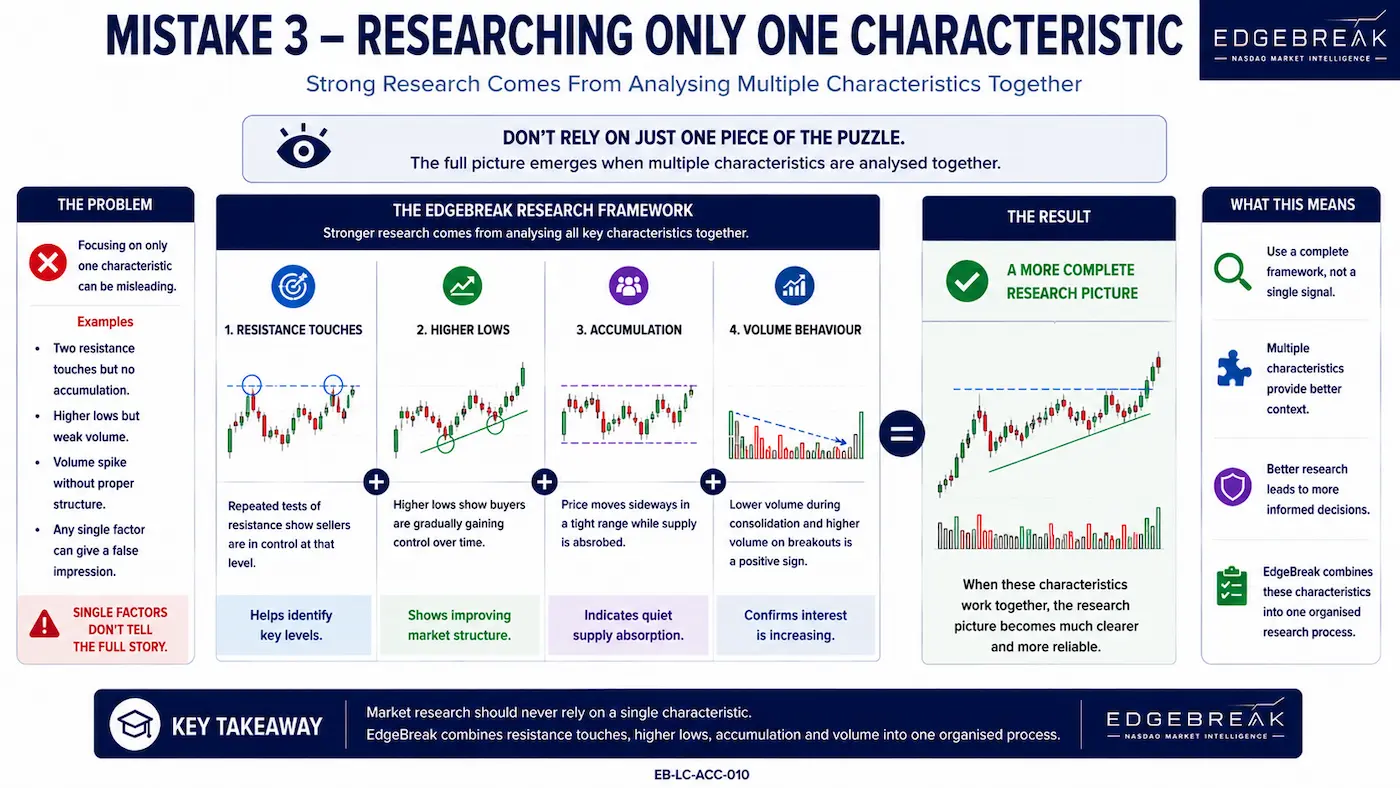
EdgeBreak research framework showing how resistance, higher lows, accumulation and volume combine to build a more complete picture of market structure.
This illustration demonstrates why effective market research should consider multiple characteristics rather than relying on a single signal. Resistance touches, higher lows, accumulation and volume each provide useful information, but they become more meaningful when analysed together within the broader market structure. No individual characteristic confirms that a breakout will occur, however combining these observations can provide a more balanced understanding of how a stock is developing. Within the EdgeBreak research process, these characteristics are organised into a structured workflow that helps members prioritise research while recognising that every investment decision requires independent judgement.

Mistake 4 – Chasing Every Opportunity

New investors often feel they need to trade every breakout they discover.

In reality, a smaller number of well-researched companies is usually far easier to monitor than hundreds of unrelated charts.

Mistake 5 – Ignoring Changing Market Structure

Market structure evolves over time.

A stock that displayed excellent research characteristics several weeks ago may no longer look the same today.

Continue reviewing your watchlist and remove stocks that no longer fit your research criteria.
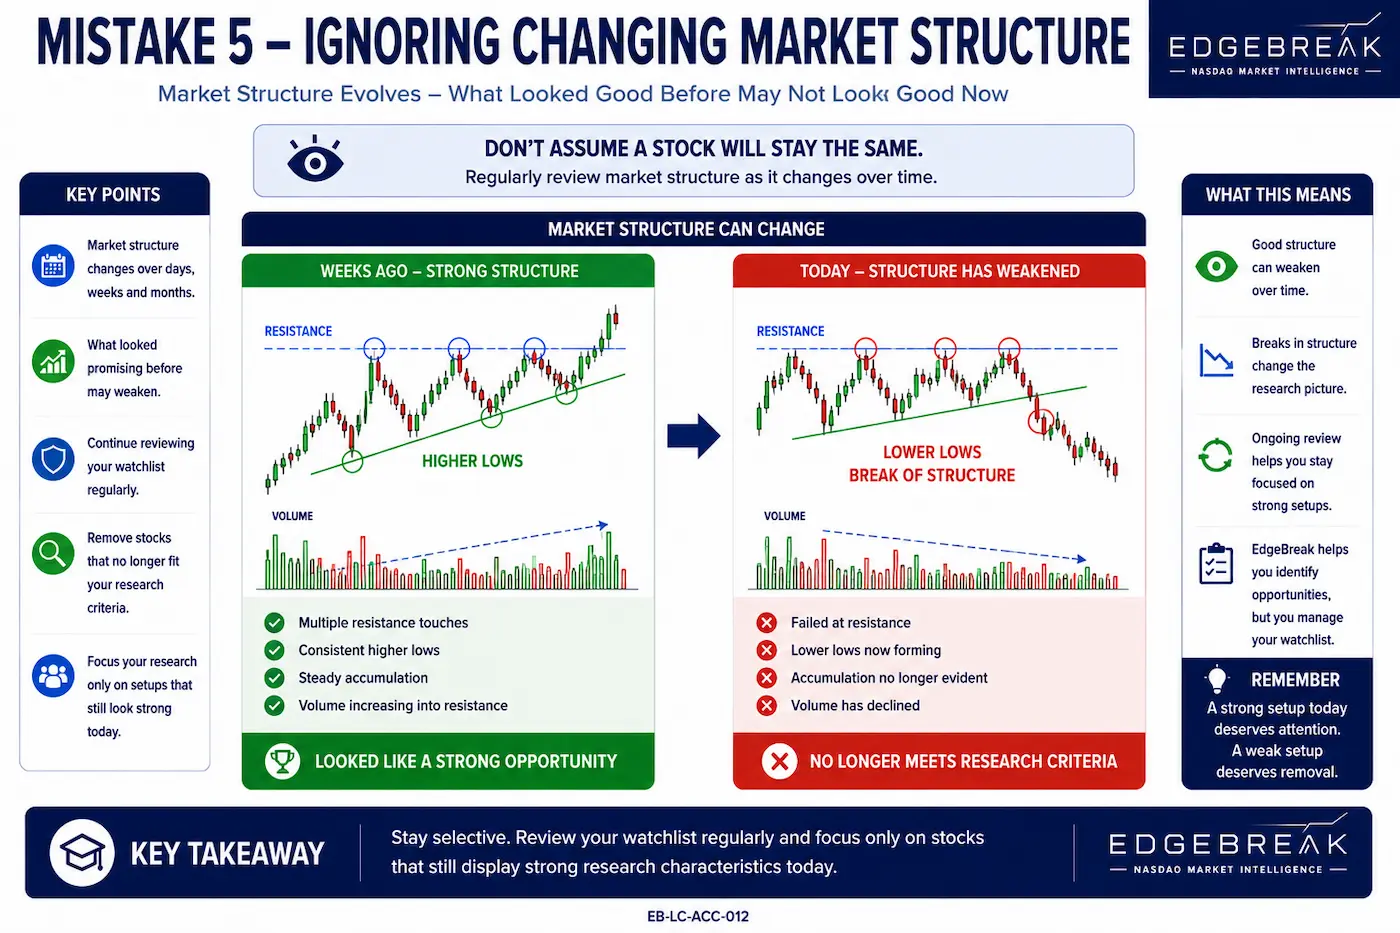
Comparison showing how market structure can change over time, with a stock transitioning from organised accumulation to weakening price action and lower lows.
This illustration demonstrates how market structure can evolve over time and why ongoing research is important. A stock that previously displayed organised accumulation, higher lows and constructive price action may gradually weaken as conditions change. Breaks in market structure, declining buying pressure or the loss of higher lows can alter the overall research picture. Within the EdgeBreak research process, regularly reviewing watchlists helps ensure attention remains focused on stocks that continue to display the characteristics being researched, while removing those whose structure has changed. Market conditions are dynamic, so research should be updated as new information becomes available.

Mistake 6 – Letting Emotions Drive Research

Excitement, fear and impatience can all influence how we interpret charts.

Following the same research checklist every time helps reduce emotional decision-making and encourages objective analysis.

Consistency is one of the greatest strengths of the EdgeBreak methodology.
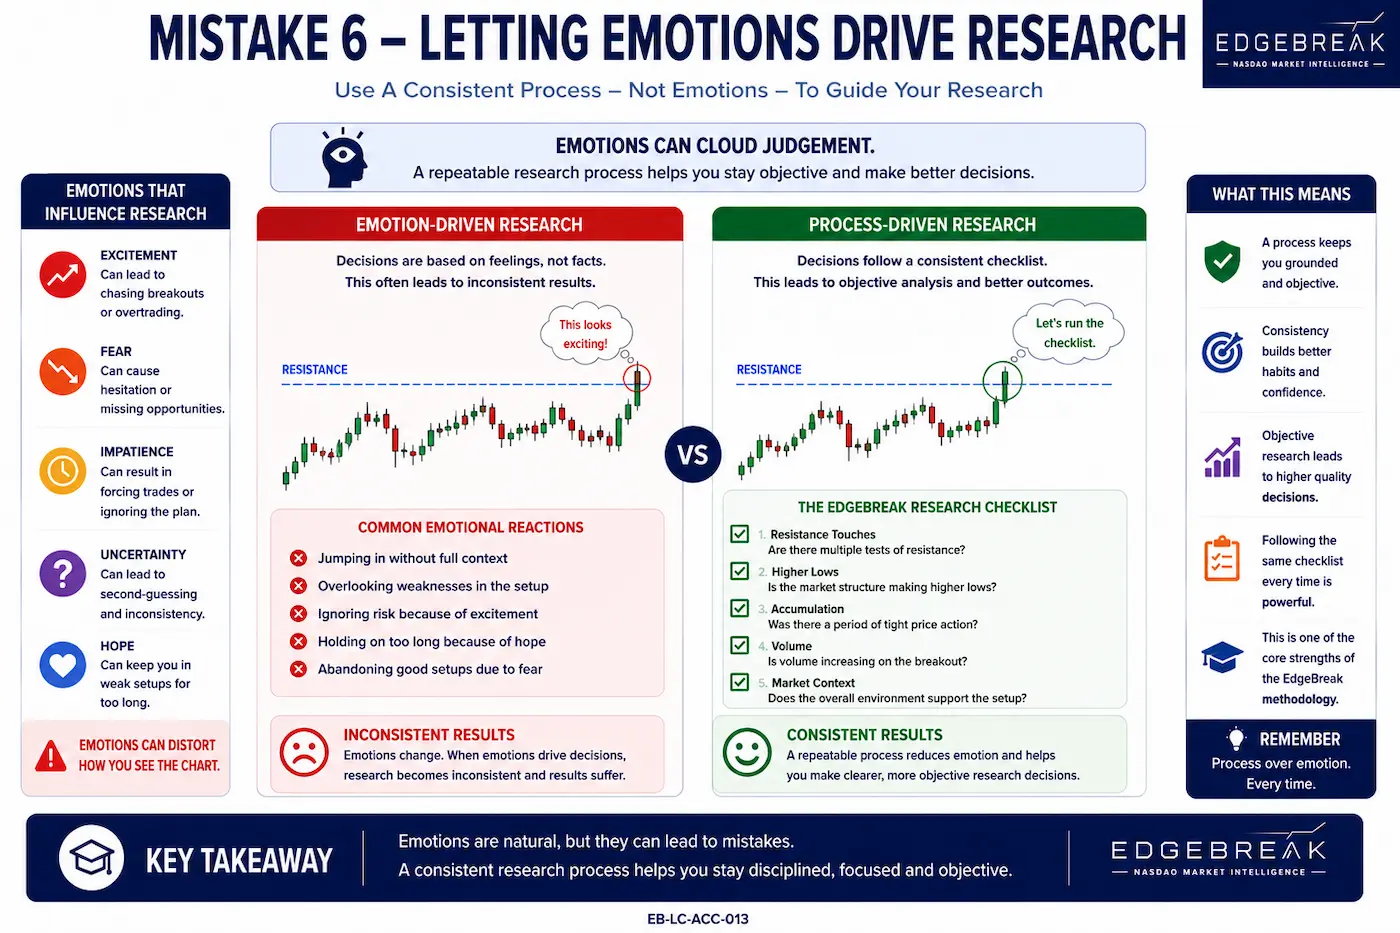
Comparison between emotion-driven and process-driven market research, highlighting the importance of following a consistent research checklist.
This illustration demonstrates how emotions such as excitement, fear and impatience can influence the way charts are interpreted. Rather than relying on emotional reactions to short-term price movements, a structured research process encourages consistent and objective analysis. Using the same checklist for every stock helps ensure that resistance, higher lows, accumulation, volume and overall market structure are reviewed in a consistent manner. Within the EdgeBreak methodology, following a repeatable research process helps reduce emotional bias and supports disciplined decision-making, while recognising that no research framework can eliminate uncertainty or predict future market outcomes.

Mistake 7 – Stopping Your Research Too Early

Research does not end once a stock appears in the Breakout Scanner.

Continue monitoring market structure, volume and price behaviour after the breakout.

Many valuable lessons are learned by observing how stocks develop over the weeks and months that follow.
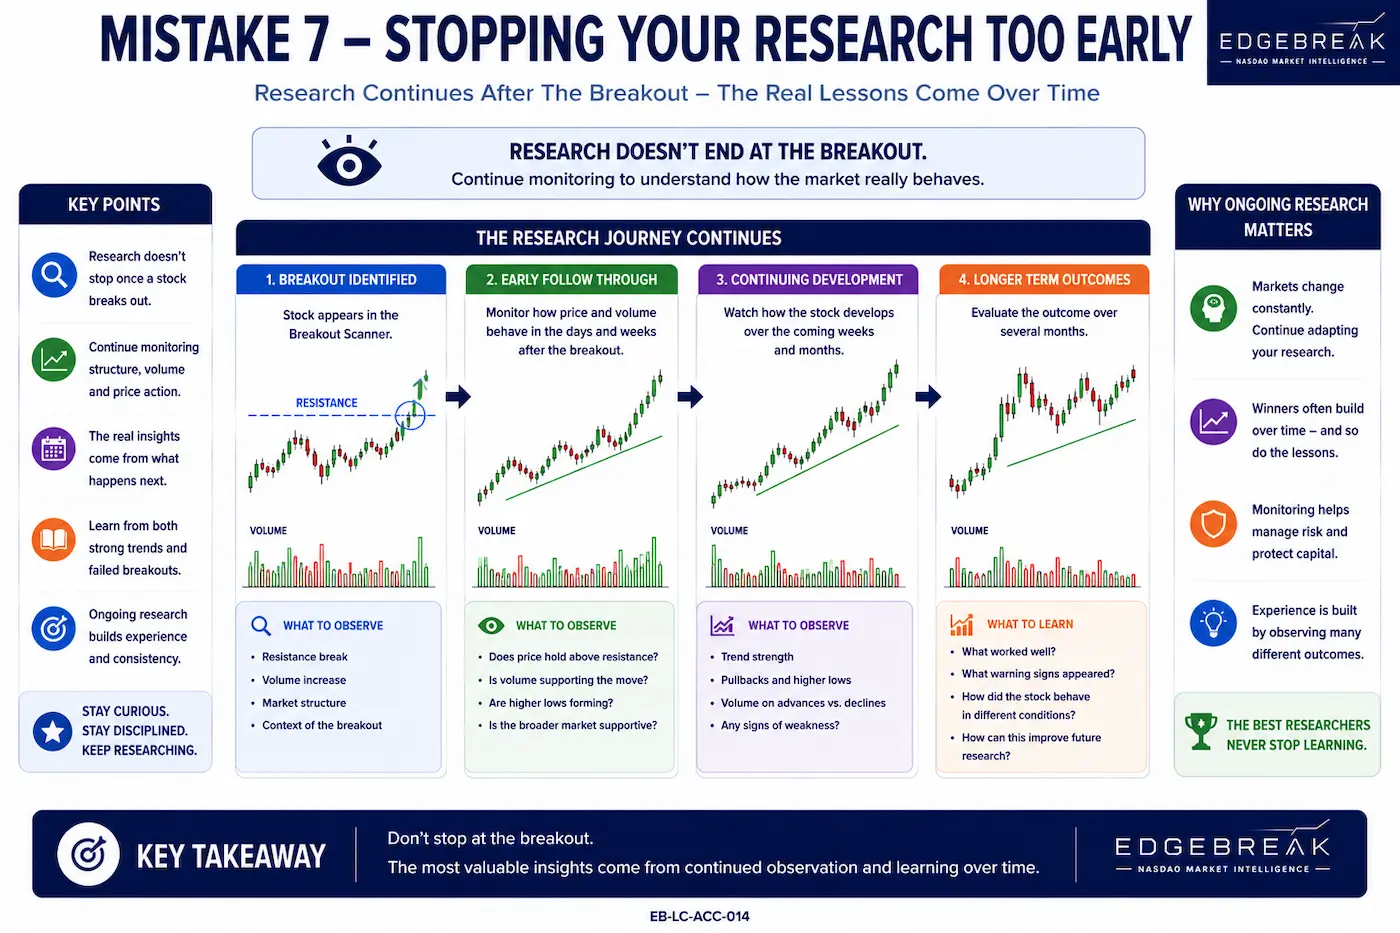
Research workflow showing how breakout analysis continues after a stock appears in the Breakout Scanner through ongoing monitoring of market structure, volume and price behaviour.
This illustration demonstrates that breakout research does not end when a stock first appears in the EdgeBreak Breakout Scanner. Continued observation of market structure, volume behaviour and price action over the following weeks and months provides valuable insight into how a breakout develops. Monitoring both successful and unsuccessful outcomes helps build experience and improves future research. Within the EdgeBreak methodology, ongoing review is an important part of the learning process, encouraging members to refine their understanding of market behaviour while recognising that every breakout can evolve differently over time.

Build Better Habits

Every mistake provides an opportunity to improve.

Rather than trying to eliminate every error, focus on developing consistent research habits.

The more charts you review, the more familiar organised market structure becomes.

Over time, disciplined research naturally replaces guesswork.

Lesson Summary

Improving your market research begins by recognising common mistakes and developing better habits. EdgeBreak encourages members to study complete market structure, review multiple characteristics together and follow a consistent research process rather than reacting to individual market movements.

Key Takeaways

  • Study the entire market structureβ€”not just the breakout.
  • Review multiple characteristics together.
  • Keep your watchlist organised.
  • Continue researching after the breakout.
  • Build discipline through consistency.

Practical Exercise

Review five stocks currently saved in My Workspace.

  • Check whether the market structure has changed.
  • Review resistance and higher lows.
  • Assess whether the original research still applies.
  • Remove any stocks that no longer meet your research criteria.
  • Record one lesson learned from each chart.

Research Reminder

Mistakes are a normal part of learning. EdgeBreak Academy is designed to help members improve their research process through structured market analysis and education. The platform does not provide financial advice or investment recommendations, and all market research should be completed independently.

Continue Learning

Continue Your Journey

Lesson 6.3 – Building Confidence Through Research

Discover how confidence develops through experience, consistency and disciplined market research rather than attempting to predict short-term market movements. Learn why following a structured process is the key to long-term success.

Module 6 β€’ Lesson 27 of 30