Complete Market Research Walkthrough
Throughout the Academy you've learned individual concepts such as market structure, resistance, higher lows, accumulation and breakout analysis. In this lesson we'll bring everything together by following a complete EdgeBreak research session from start to finish. This is the same structured workflow members can use each day when researching the NASDAQ market.
What You'll Learn
- How to perform a complete EdgeBreak research session.
- Using every major platform feature together.
- How to narrow thousands of stocks into a manageable watchlist.
- Building a repeatable daily research routine.
- Organising research for long-term monitoring.
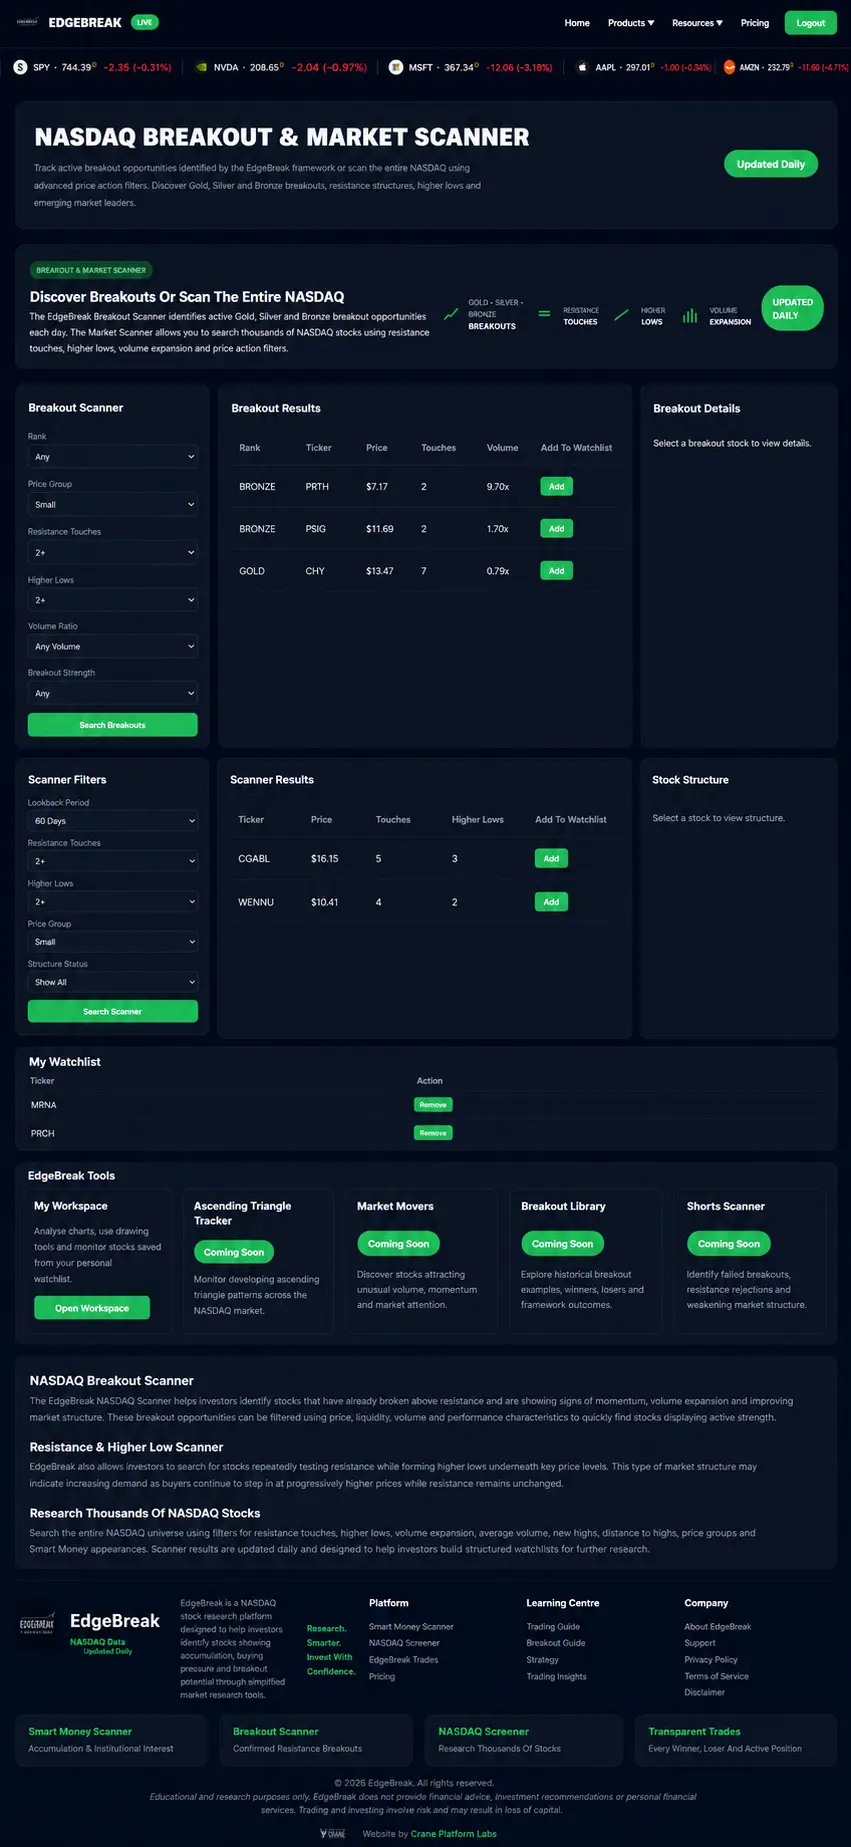
Step 1 – Begin with the NASDAQ Scanner
Every research session begins with the NASDAQ Scanner.
Instead of manually searching thousands of charts, the scanner immediately identifies stocks displaying the characteristics you've chosen to research.
Begin by selecting your preferred Lookback period and adjusting any filters that match your research style.
At this stage, your goal is simply to organise the market—not make decisions.
Step 2 – Narrow the Results
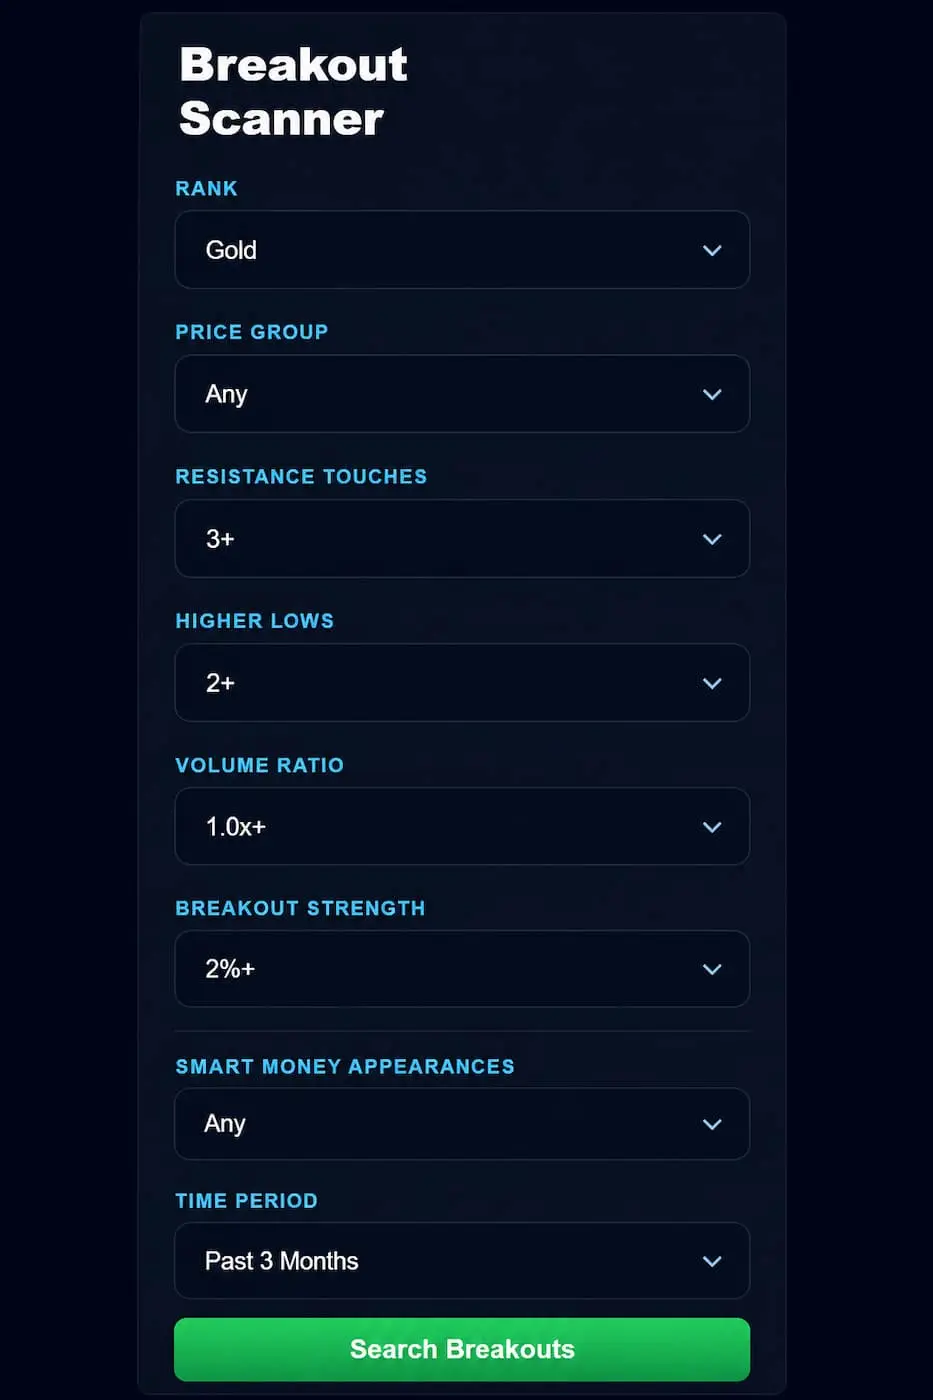
Once the initial results appear, begin reducing the list using the available research filters.
Depending on your research preferences, you might review:
- Price Group
- Resistance Touches
- Higher Lows
- Volume Ratio
- Distance to High
- Appearances
Each filter helps reduce market noise and creates a more focused list of research candidates.
Step 3 – Apply the Smart Money Filter
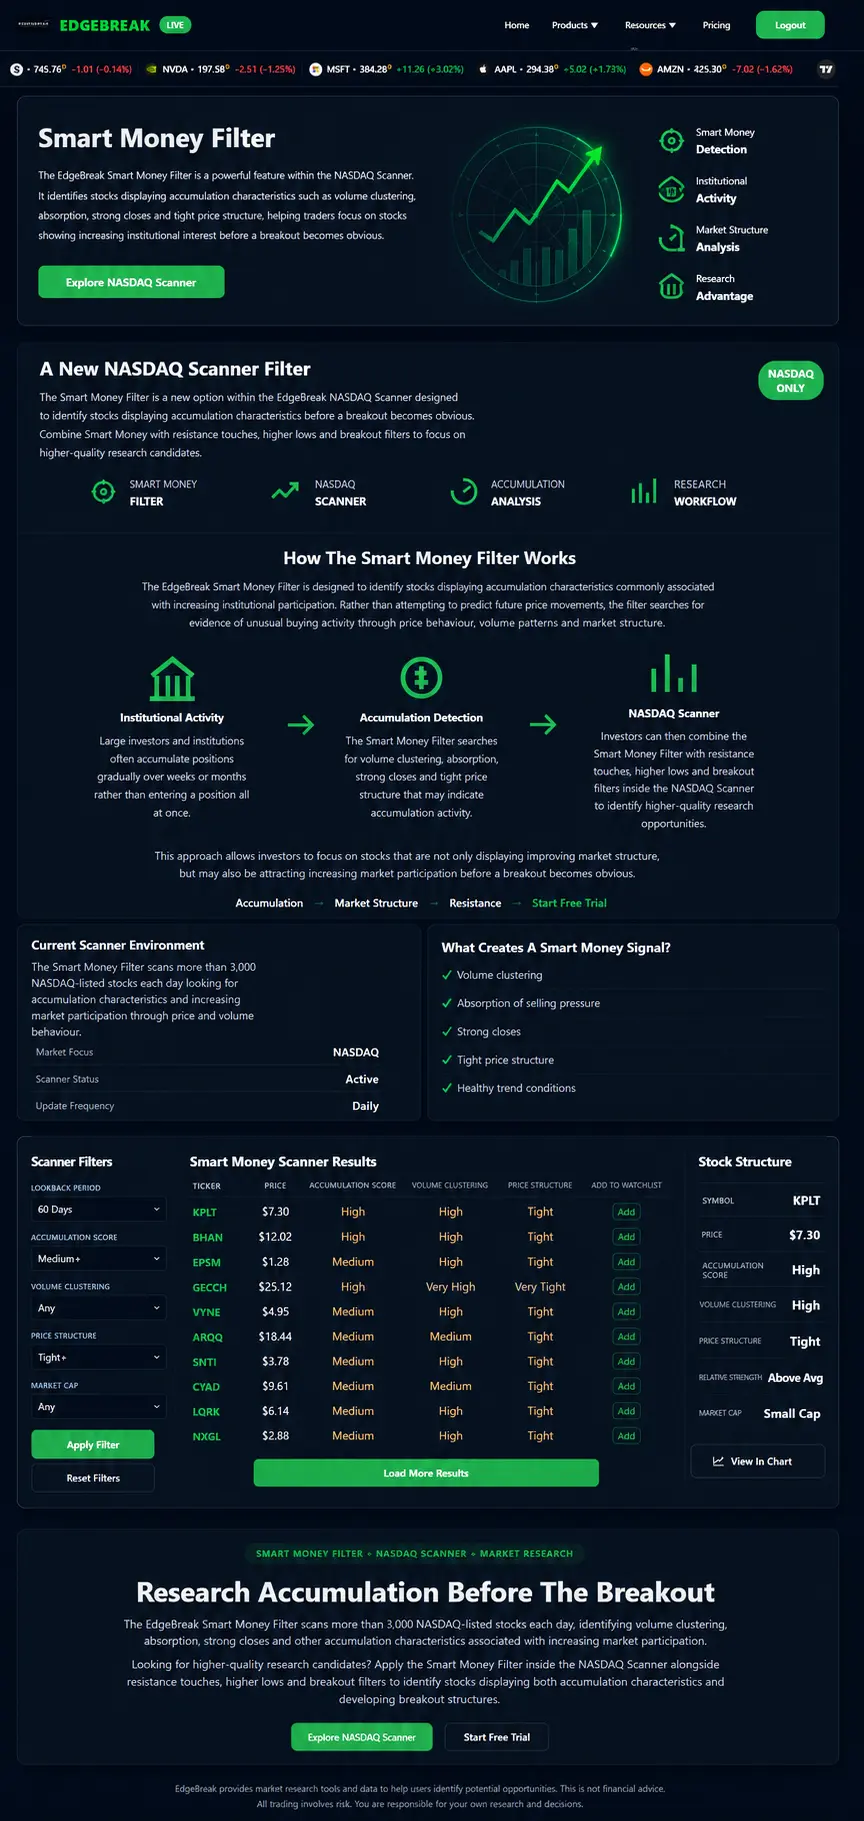
Once you've narrowed the results, apply the Smart Money Filter.
This highlights stocks displaying organised accumulation characteristics that may deserve additional research.
Remember that the Smart Money Filter does not predict future price movement. It simply provides another layer of structured market analysis.
Step 4 – Review Individual Charts
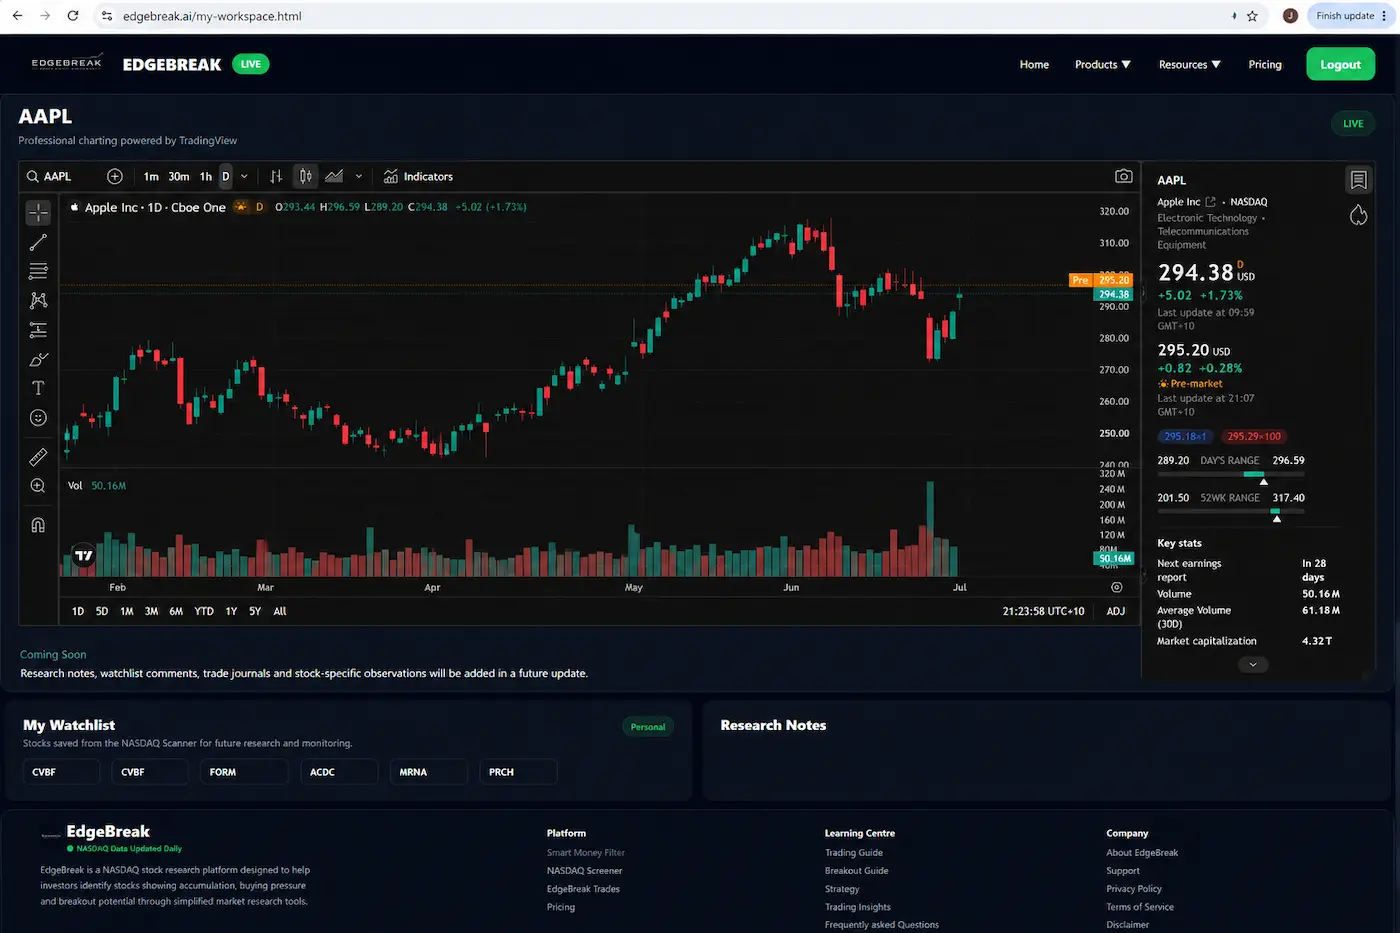
Open each stock using the integrated TradingView chart.
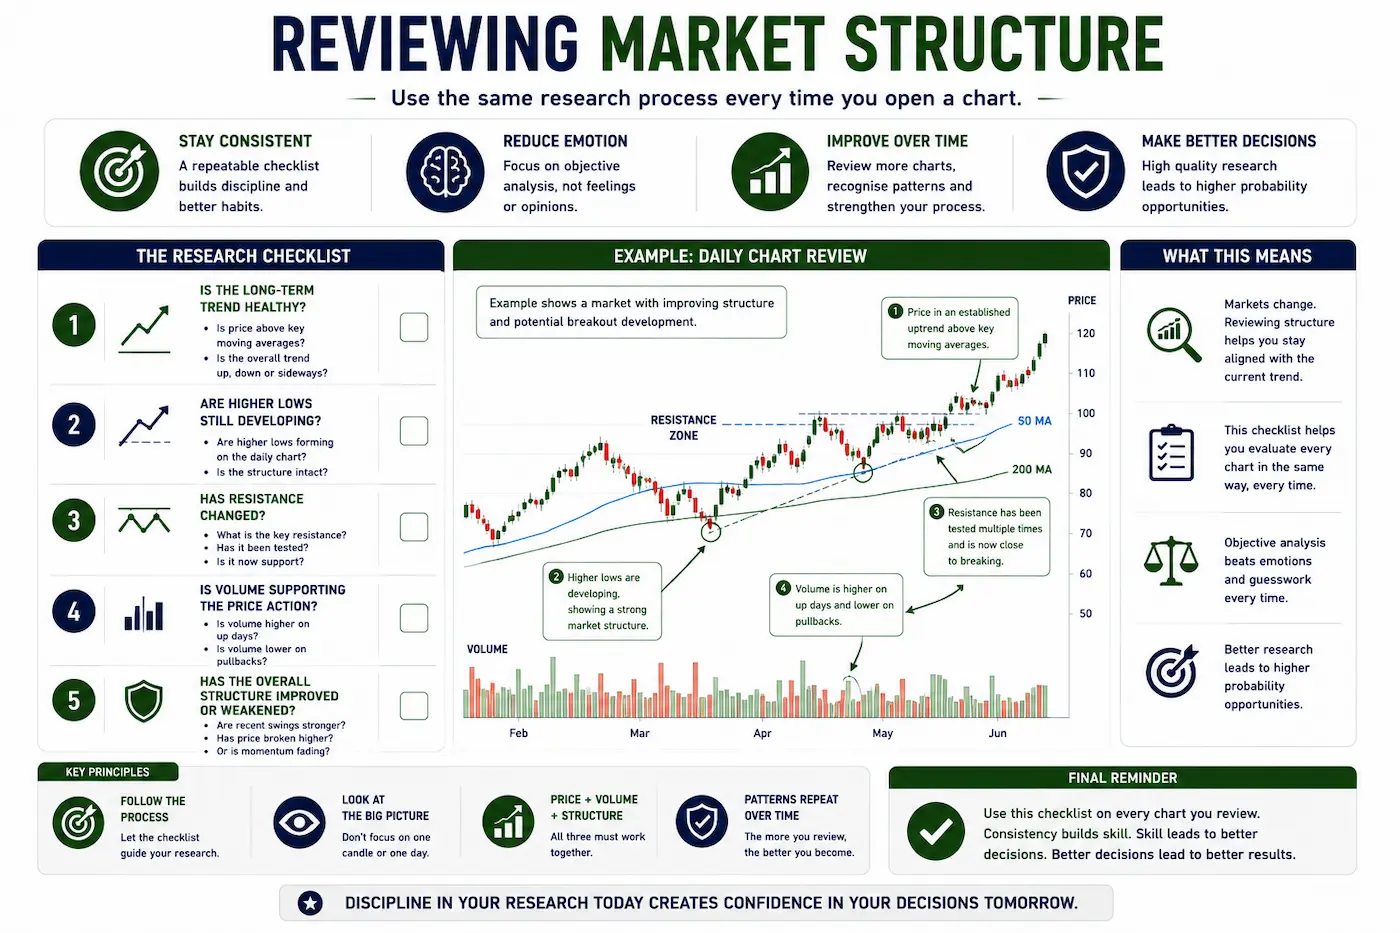
Work through the same checklist every time.
- Overall market structure.
- Higher highs and higher lows.
- Resistance levels.
- Volume behaviour.
- Accumulation characteristics.
- Weekly trend.
Following the same checklist removes guesswork and creates consistency.
Step 5 – Compare with the Breakout Scanner
Next, open the Breakout Scanner.
Compare today's active breakouts with the stocks you've already researched.
Notice how completed breakouts differ from developing market structures still appearing in the NASDAQ Scanner.
This comparison improves pattern recognition and helps members better understand how breakout structures evolve over time.
Step 6 – Build Your Research Watchlist
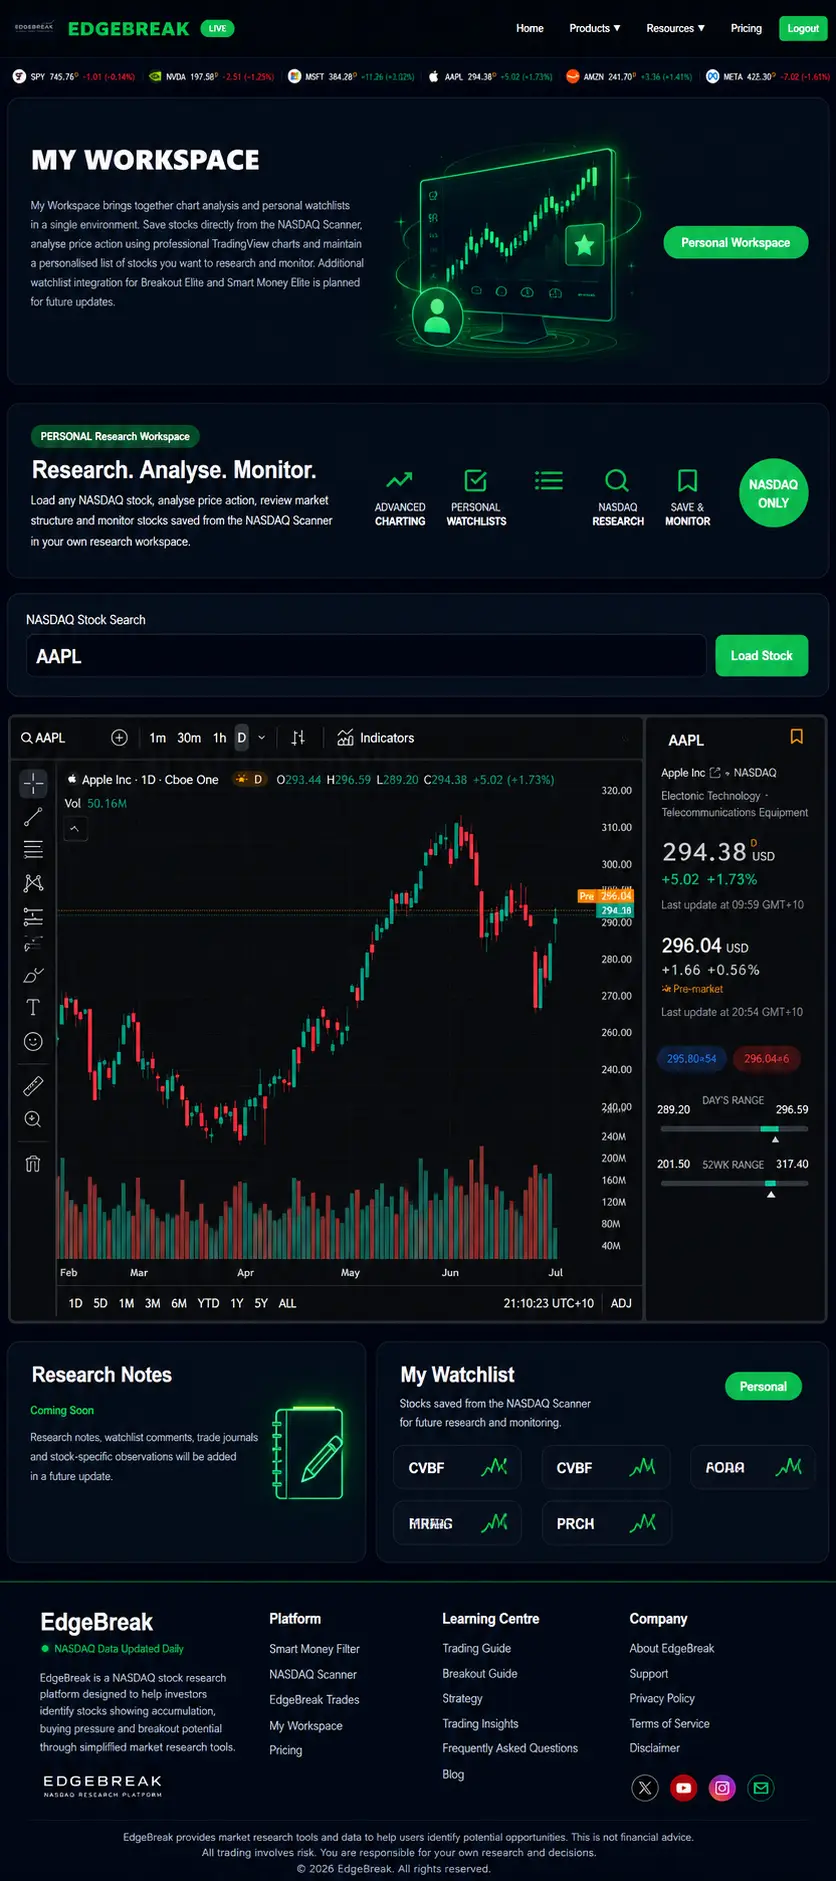
Save only the strongest research candidates to My Workspace.
Avoid saving every stock you review.
A carefully selected watchlist is easier to monitor and often provides greater long-term value than a large collection of unrelated stocks.
Step 7 – Review Your Research
Before finishing your session, review the stocks you've saved.
Ask yourself:
- Why did I save this stock?
- Does the market structure remain organised?
- Are higher lows still developing?
- Would I save it again today?
Reviewing your own research is one of the fastest ways to improve pattern recognition.
Repeat the Same Process
The greatest strength of EdgeBreak is consistency.
Rather than constantly searching for new methods, continue following the same structured workflow each day.
Over time you'll become faster at recognising organised market structure and more confident using the platform.
The Complete EdgeBreak Workflow
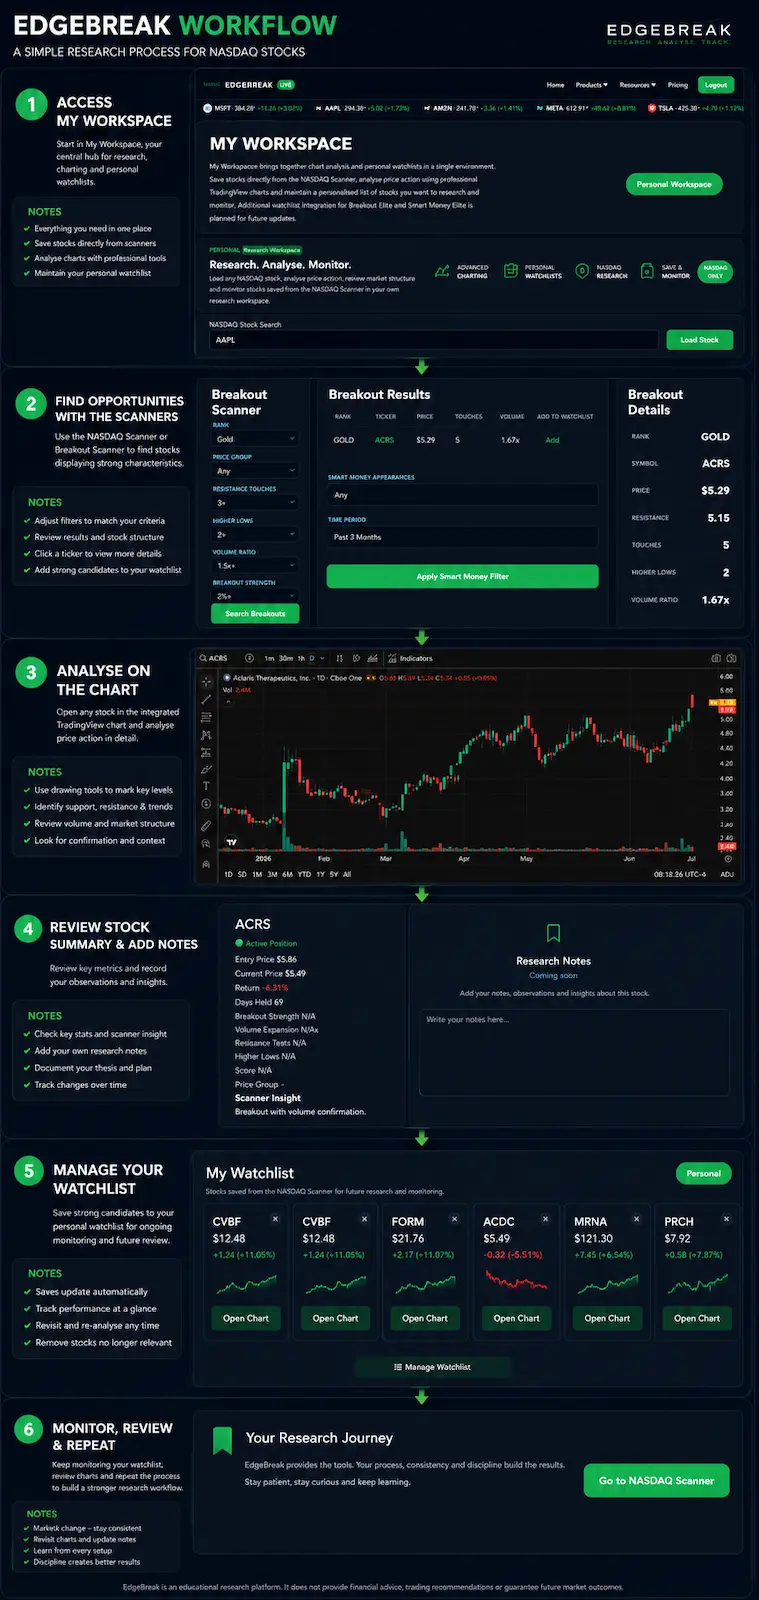
- Open the NASDAQ Scanner.
- Select your preferred Lookback period.
- Apply research filters.
- Enable the Smart Money Filter.
- Review TradingView charts.
- Compare with today's Breakout Scanner.
- Save quality research candidates.
- Review your watchlist regularly.
Following this workflow helps transform EdgeBreak from a collection of individual tools into one complete market research platform.
Lesson Summary
A successful research session combines every major EdgeBreak feature into one structured workflow. By narrowing the market using the NASDAQ Scanner, applying the Smart Money Filter, reviewing charts, comparing active breakouts and organising research inside My Workspace, members can build a disciplined process that supports long-term market research.
Key Takeaways
- Follow the same research process every session.
- Use filters to reduce market noise.
- Always review charts—not just scanner results.
- Maintain an organised watchlist.
- Consistency improves market research over time.
Practical Exercise
Complete a full EdgeBreak research session using today's market data.
- Run the NASDAQ Scanner.
- Apply your preferred filters.
- Use the Smart Money Filter.
- Open five TradingView charts.
- Review today's Breakout Scanner.
- Save your three strongest research candidates to My Workspace.
- Write a short summary explaining why you selected each stock.
Research Reminder
This walkthrough demonstrates one example of a structured market research process using the EdgeBreak platform. It is intended for educational purposes only and should not be interpreted as financial advice or investment recommendations. Always conduct your own independent research before making financial decisions.
Continue Your Journey
Lesson 5.6 – Learning From Historical Breakouts
Discover how studying historical breakout examples strengthens pattern recognition, improves your research skills and helps you identify similar market structures in future opportunities.