Learning from Historical Breakouts
One of the fastest ways to improve your market research is by studying historical breakout examples. Every successful and unsuccessful breakout leaves behind valuable clues about market structure, accumulation, resistance and investor behaviour. This lesson demonstrates how reviewing historical charts can strengthen pattern recognition and improve your understanding of how breakout opportunities develop over time.
What You'll Learn
- Why historical chart studies are valuable.
- How to analyse previous breakout structures.
- Recognising recurring market patterns.
- Applying EdgeBreak tools to historical examples.
- Building long-term pattern recognition.
Markets Leave Clues
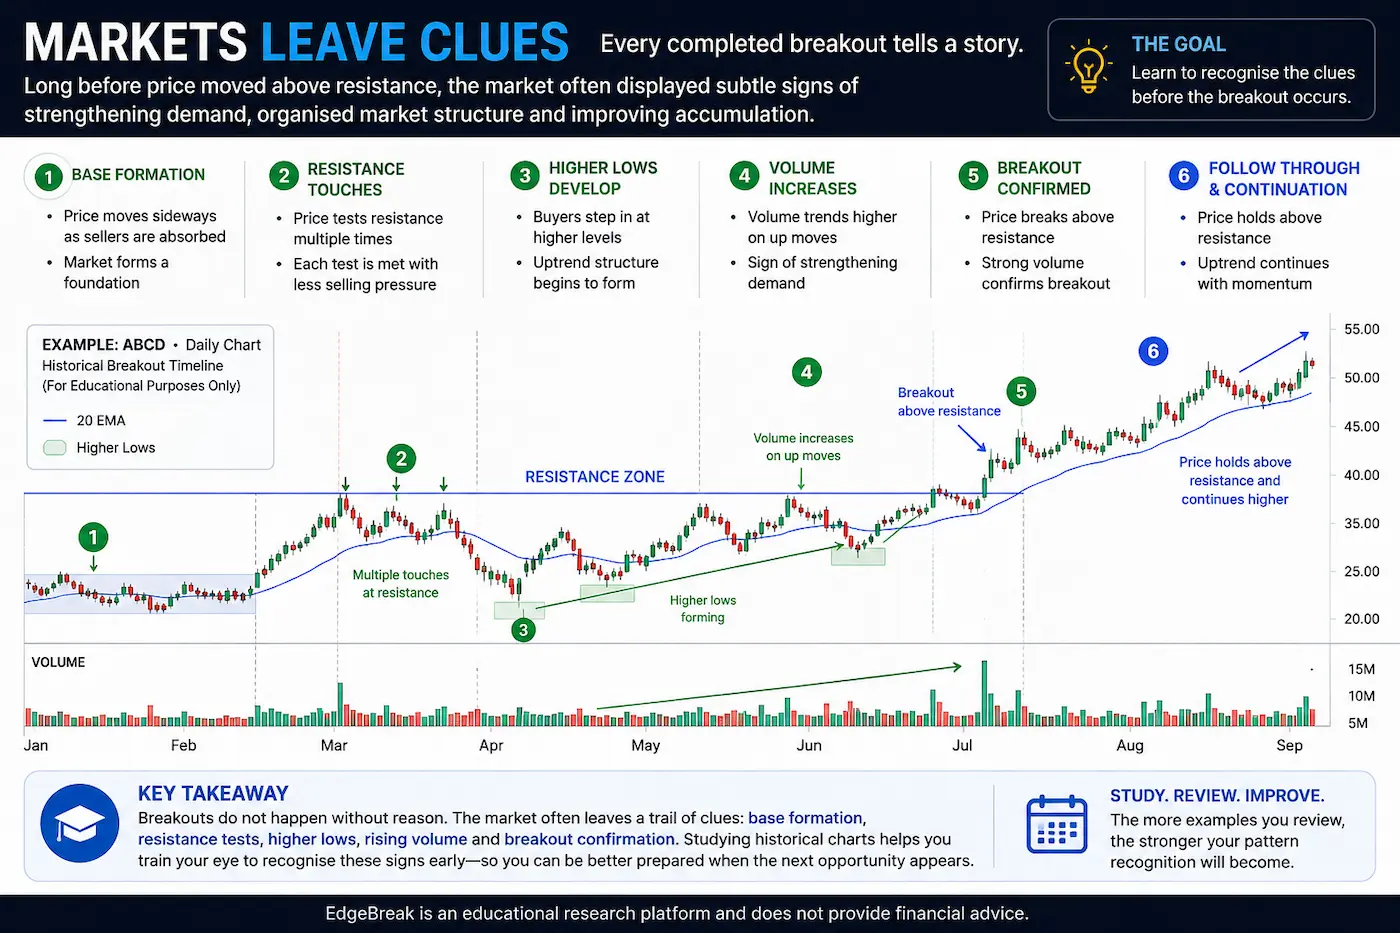
Every completed breakout tells a story.
Long before price moved above resistance, the market often displayed subtle signs of strengthening demand, organised market structure and improving accumulation.
By studying historical charts without the pressure of live markets, members can focus entirely on recognising these recurring characteristics.
Start Before the Breakout
When reviewing historical charts, begin your analysis well before the breakout occurs.
Hide the future price action if possible and examine only the information that would have been available at that point in time.
This encourages objective research and prevents hindsight bias from influencing your observations.
Review the Market Structure
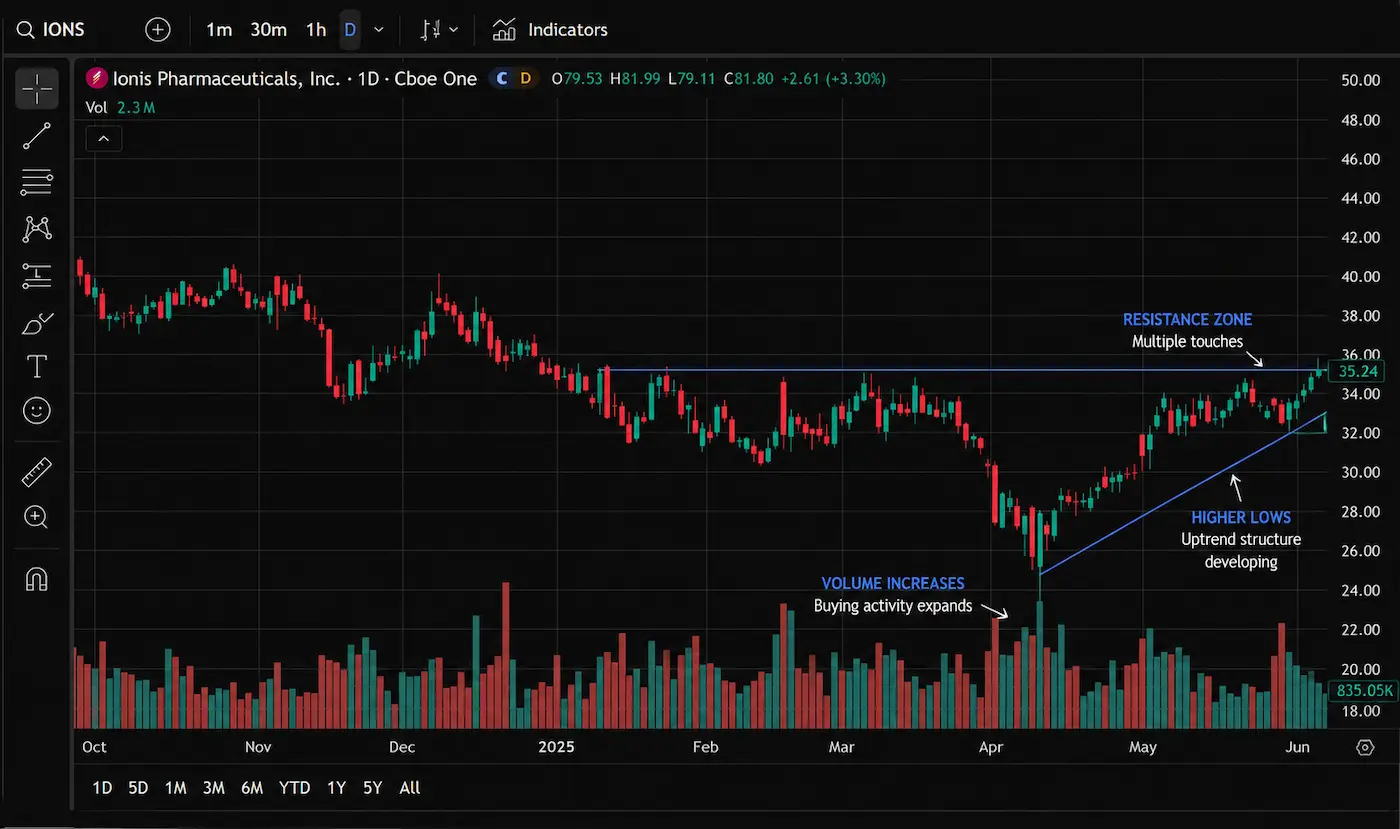
Ask yourself whether the overall structure appeared organised.
- Were higher highs developing?
- Were higher lows becoming more obvious?
- Was resistance clearly defined?
- Did the trend remain healthy?
Strong market structure is often one of the earliest characteristics visible before many successful breakouts.
Identify Accumulation
Next, study the consolidation period.
Look for signs that selling pressure was gradually being absorbed while buyers continued supporting higher prices.
Compare multiple historical examples and notice how accumulation often develops differently from one stock to another.
Review Resistance Touches
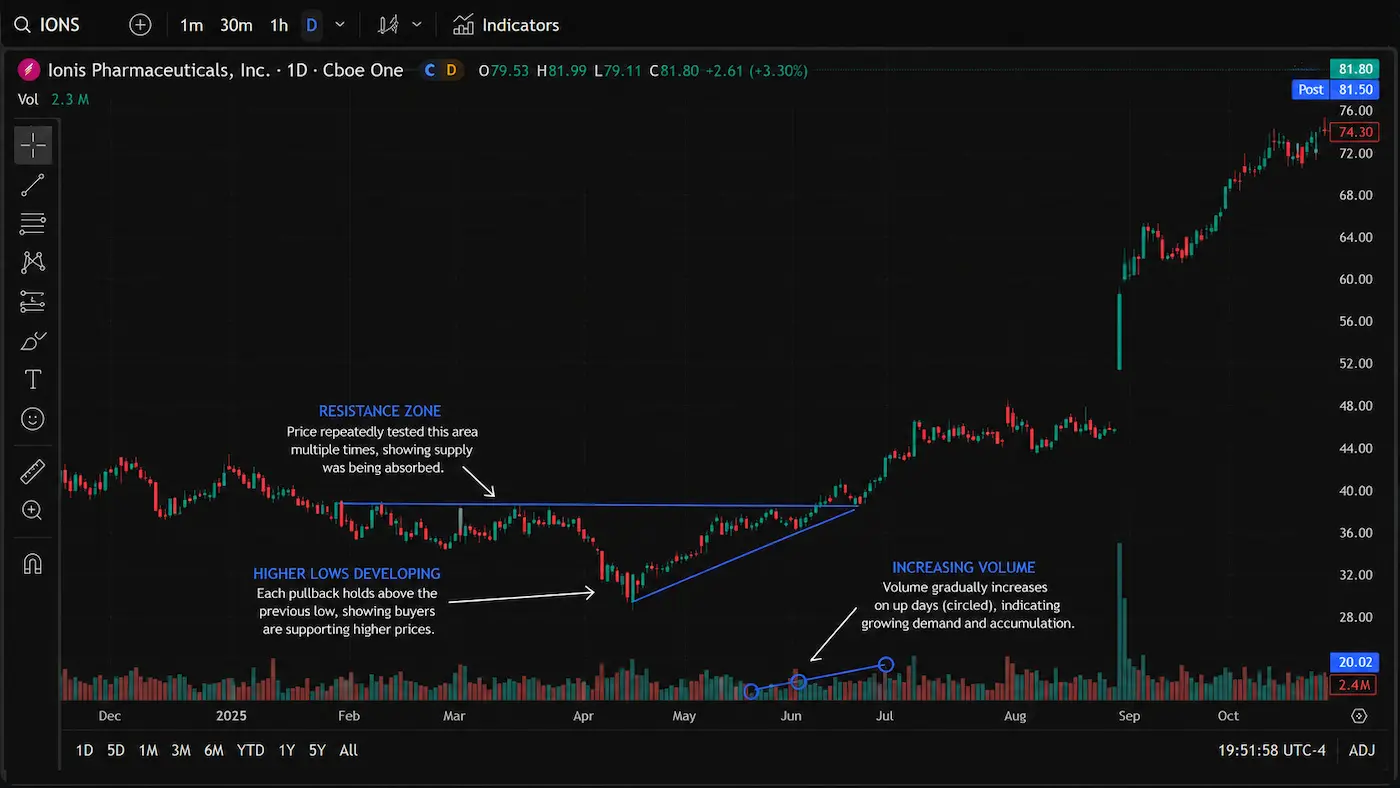
Count how many times price tested resistance before eventually breaking higher.
Notice how repeated testing often demonstrated growing buying pressure without immediately producing a breakout.
This is one of the reasons EdgeBreak places significant emphasis on resistance touches during the research process.
Observe the Volume
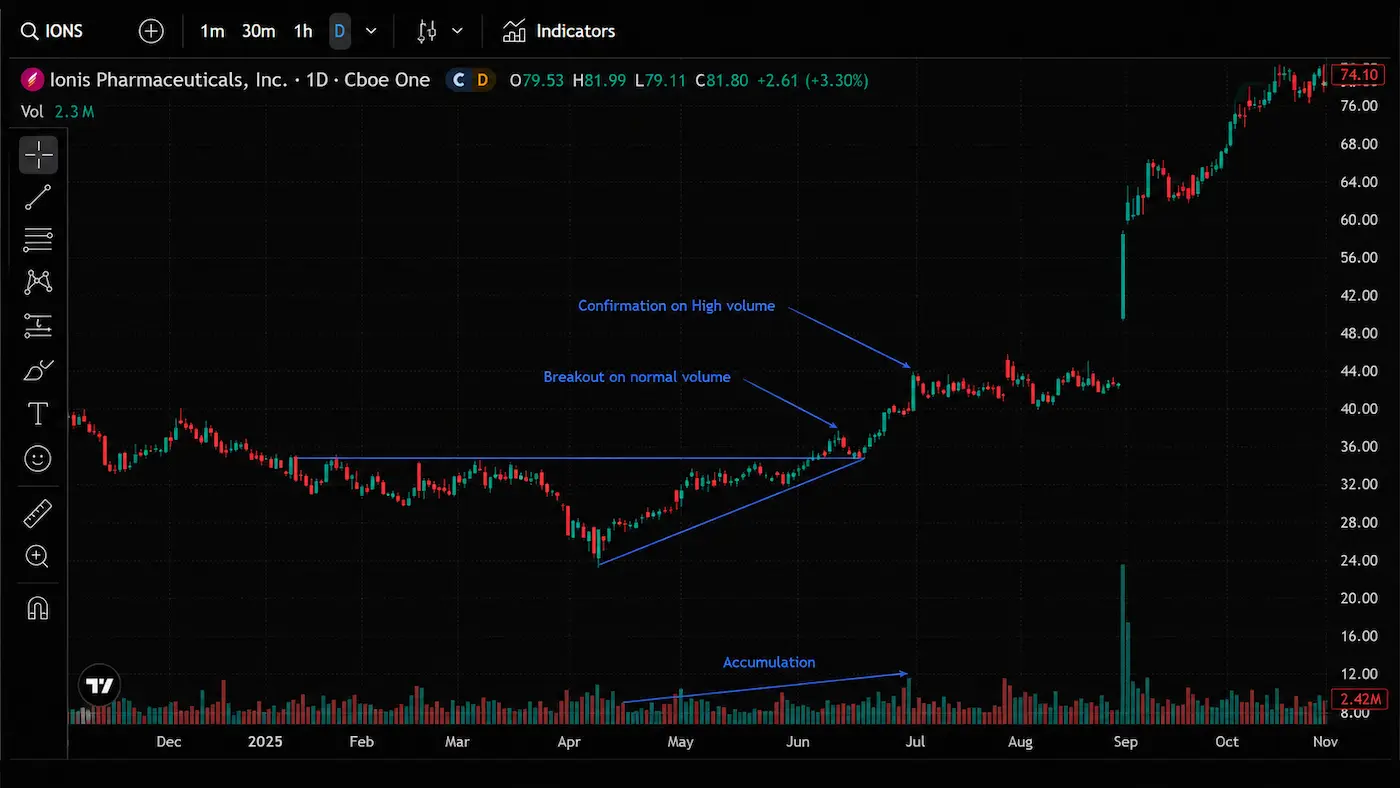
Review how trading activity changed throughout the entire pattern.
Some historical breakouts displayed increasing participation as price approached resistance, while others experienced relatively quiet consolidation before expanding higher.
Volume should always be interpreted alongside price action rather than in isolation.
Would EdgeBreak Have Found It?
One of the most valuable exercises is asking whether the historical stock would have appeared within the EdgeBreak platform.
Consider whether it may have qualified for:
- NASDAQ Scanner
- Resistance Touch filters
- Higher Lows filters
- Smart Money Filter
- Breakout Scanner
This exercise helps connect historical market behaviour with the modern research tools available inside EdgeBreak.
Comparison of Three Real Breakouts
Every breakout develops differently, but many successful breakouts display similar characteristics. Compare these three real examples and look for recurring patterns including resistance touches, higher lows, accumulation and volume behaviour.
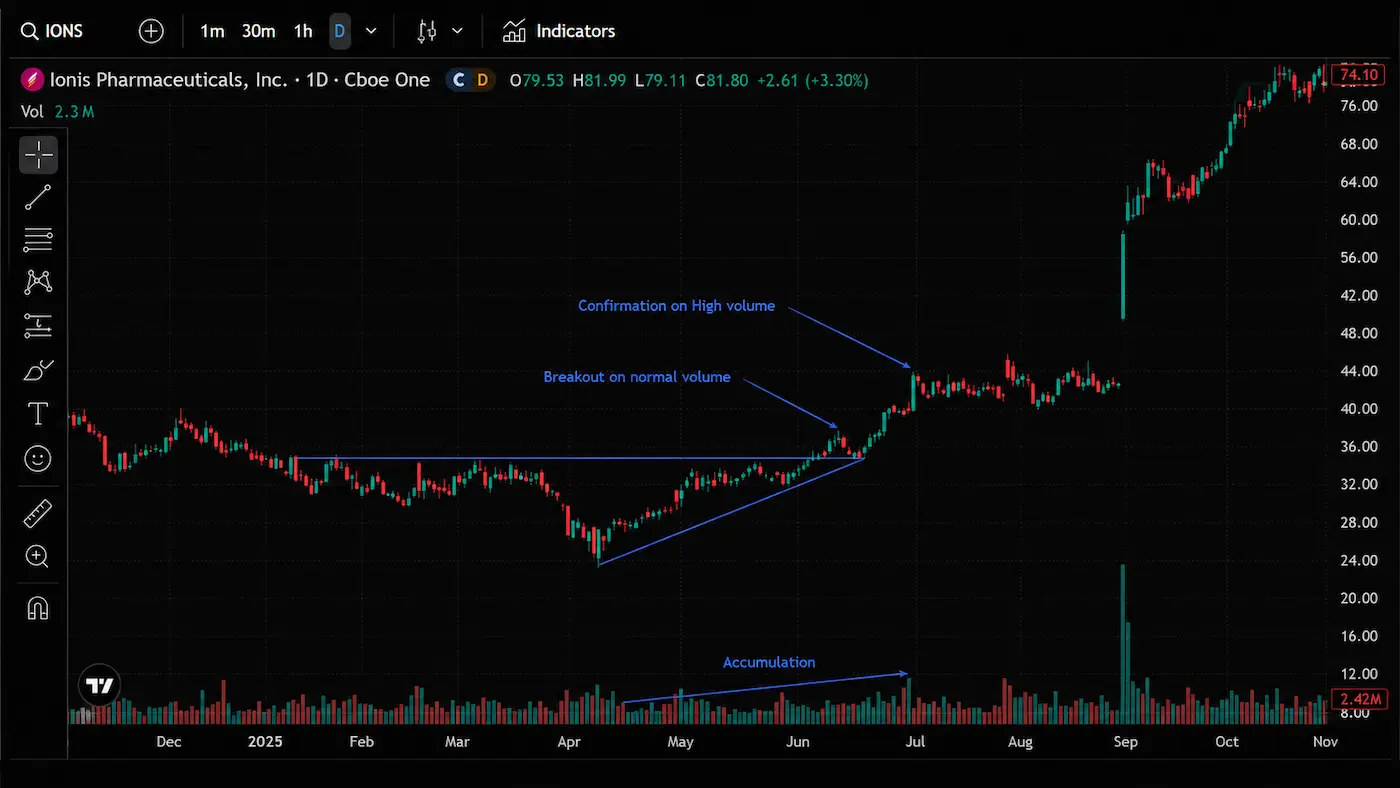
Accumulation, higher lows and confirmation after breakout.
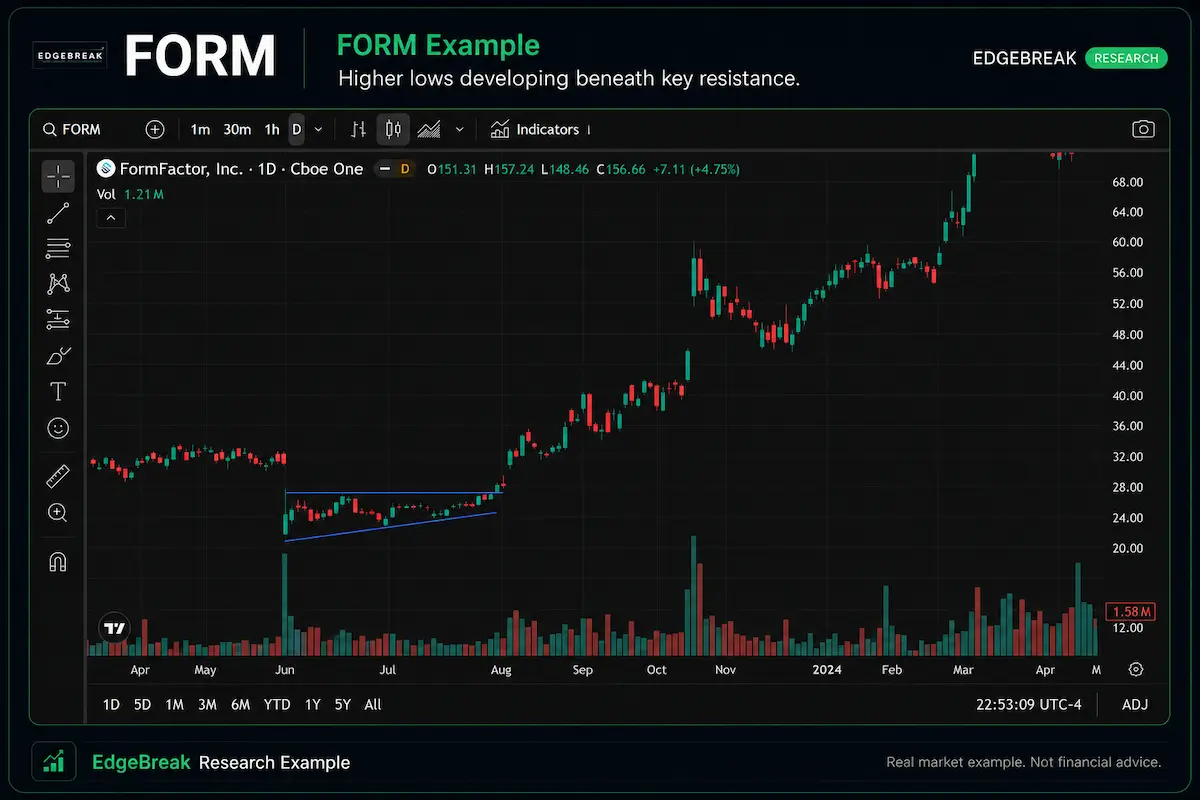
Multiple breakout phases with new resistance forming.
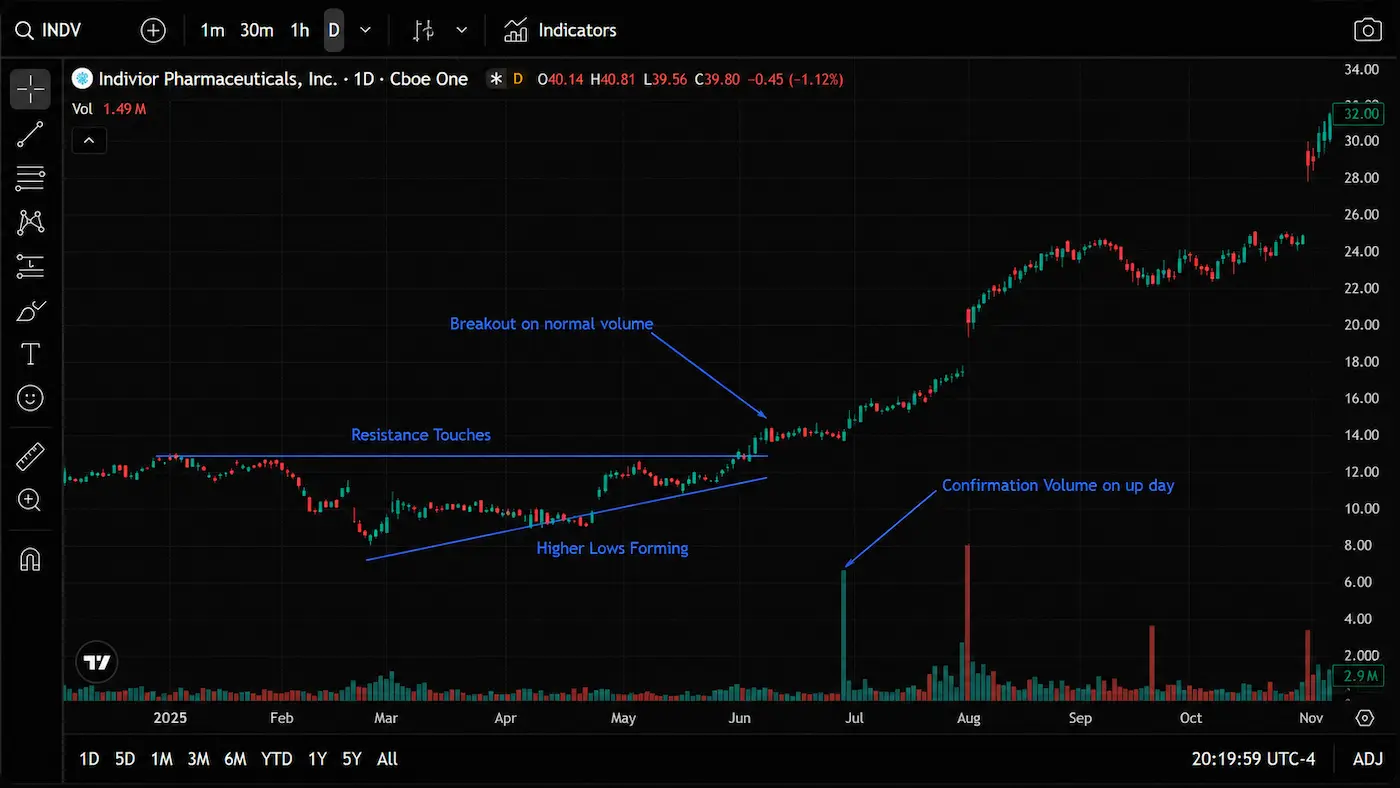
Resistance touches, higher lows and breakout confirmation.
Compare Multiple Historical Examples
Rather than studying only one successful breakout, compare several different historical charts.
Some may display textbook market structure while others develop through more complex consolidation patterns.
The more examples you study, the easier it becomes to recognise recurring characteristics in today's market.
Learning Never Stops
Historical research is one of the most effective ways to improve pattern recognition.
Even experienced investors regularly review previous market leaders to better understand how organised breakout structures developed.
Every chart you study becomes another reference point for future market research.
Lesson Summary
Historical breakout studies provide an opportunity to improve pattern recognition without the pressure of live markets. By reviewing market structure, resistance, higher lows, accumulation and volume across multiple historical examples, members can develop a deeper understanding of how breakout opportunities evolve over time. EdgeBreak's research tools can then be used to identify similar characteristics in today's NASDAQ market.
Key Takeaways
- Study the chart before the breakout occurs.
- Review market structure objectively.
- Compare multiple historical examples.
- Use historical charts to improve pattern recognition.
- Connect historical examples with the EdgeBreak research tools.
Practical Exercise
Select three historical NASDAQ breakout stocks and complete a structured review.
- Mark the resistance level.
- Identify the higher lows.
- Review the accumulation phase.
- Study the volume behaviour.
- Explain which EdgeBreak tools would likely have identified the stock before the breakout.
Congratulations!
You've now completed Module 5 – Real Market Research Examples.
By analysing both successful and unsuccessful historical breakout structures, you've strengthened your ability to recognise organised market behaviour and apply the complete EdgeBreak research framework using real-world examples.
These pattern recognition skills will continue improving as you research more charts and build experience using the EdgeBreak platform.
Research Reminder
Historical market examples are presented for educational purposes only. Past market behaviour should never be interpreted as an indication of future performance. EdgeBreak is designed to support independent market research through structured analysis and educational resources and does not provide financial advice or investment recommendations.
Congratulations!
Lesson 6.1 – Building Your Personal Research Plan
Bring everything you've learned together by creating your own structured market research plan. Learn how to build a repeatable routine, organise your workflow and continue developing as an independent market researcher using the complete EdgeBreak framework.