Understanding Institutional Accumulation
Many of the strongest breakout opportunities begin long before price moves above resistance. During this preparation phase, investors often research whether institutional buying may be occurring through periods of accumulation. While it is impossible to know exactly who is buying or selling, studying price action and volume behaviour can provide valuable clues about how market participants are positioning themselves.
What You'll Learn
- What institutional accumulation is.
- Why institutions buy differently from retail investors.
- Common characteristics of accumulation.
- How accumulation relates to breakout research.
- How EdgeBreak identifies Smart Money characteristics.
Who Are Institutional Investors?
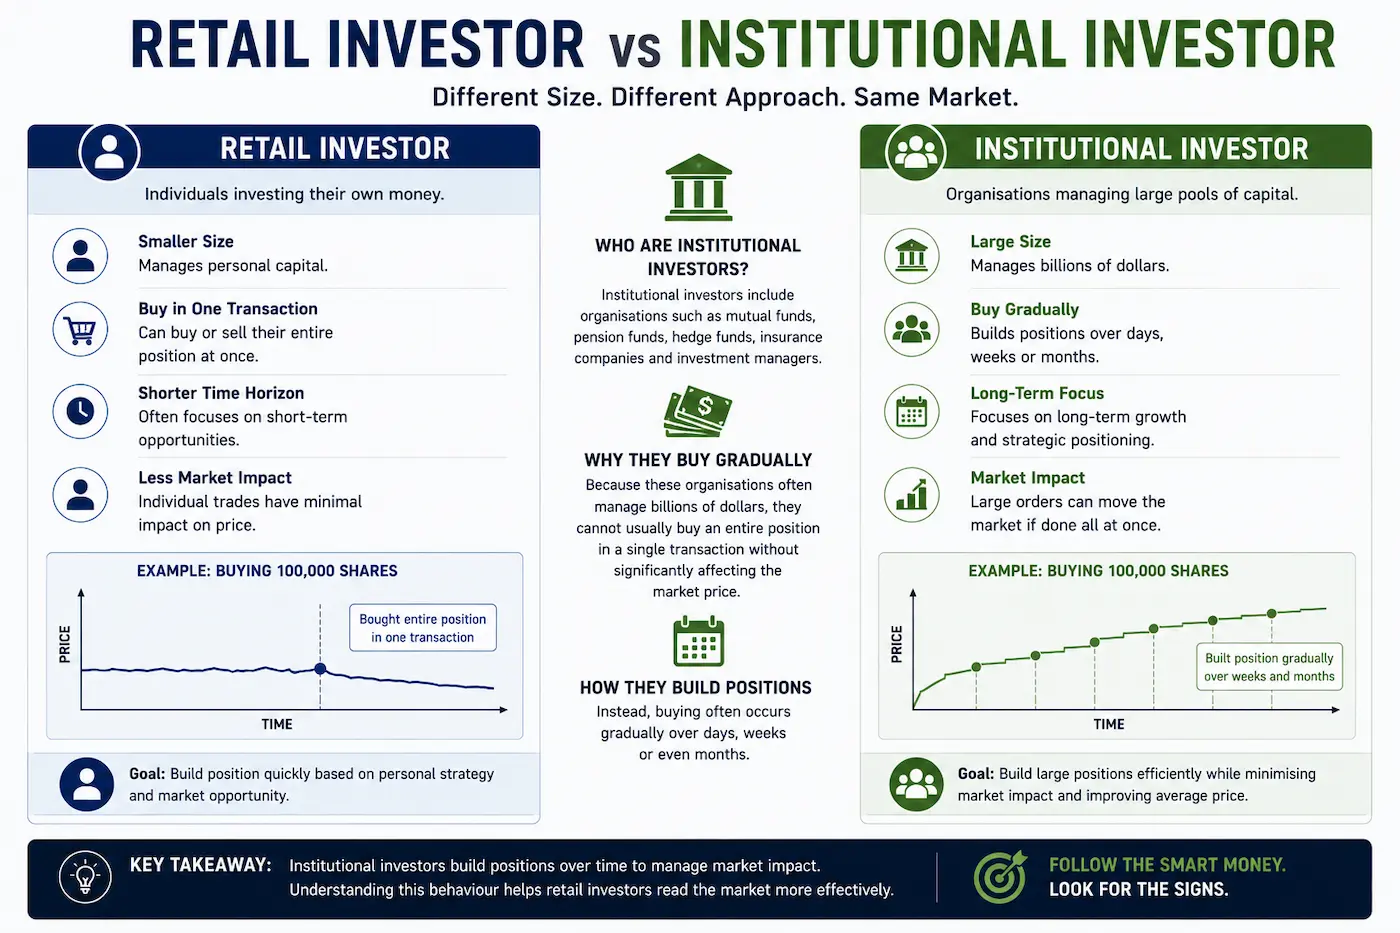
Institutional investors include organisations such as mutual funds, pension funds, hedge funds, insurance companies and investment managers.
Because these organisations often manage billions of dollars, they cannot usually buy an entire position in a single transaction without significantly affecting the market price.
Instead, buying often occurs gradually over days, weeks or even months.
What Is Accumulation?
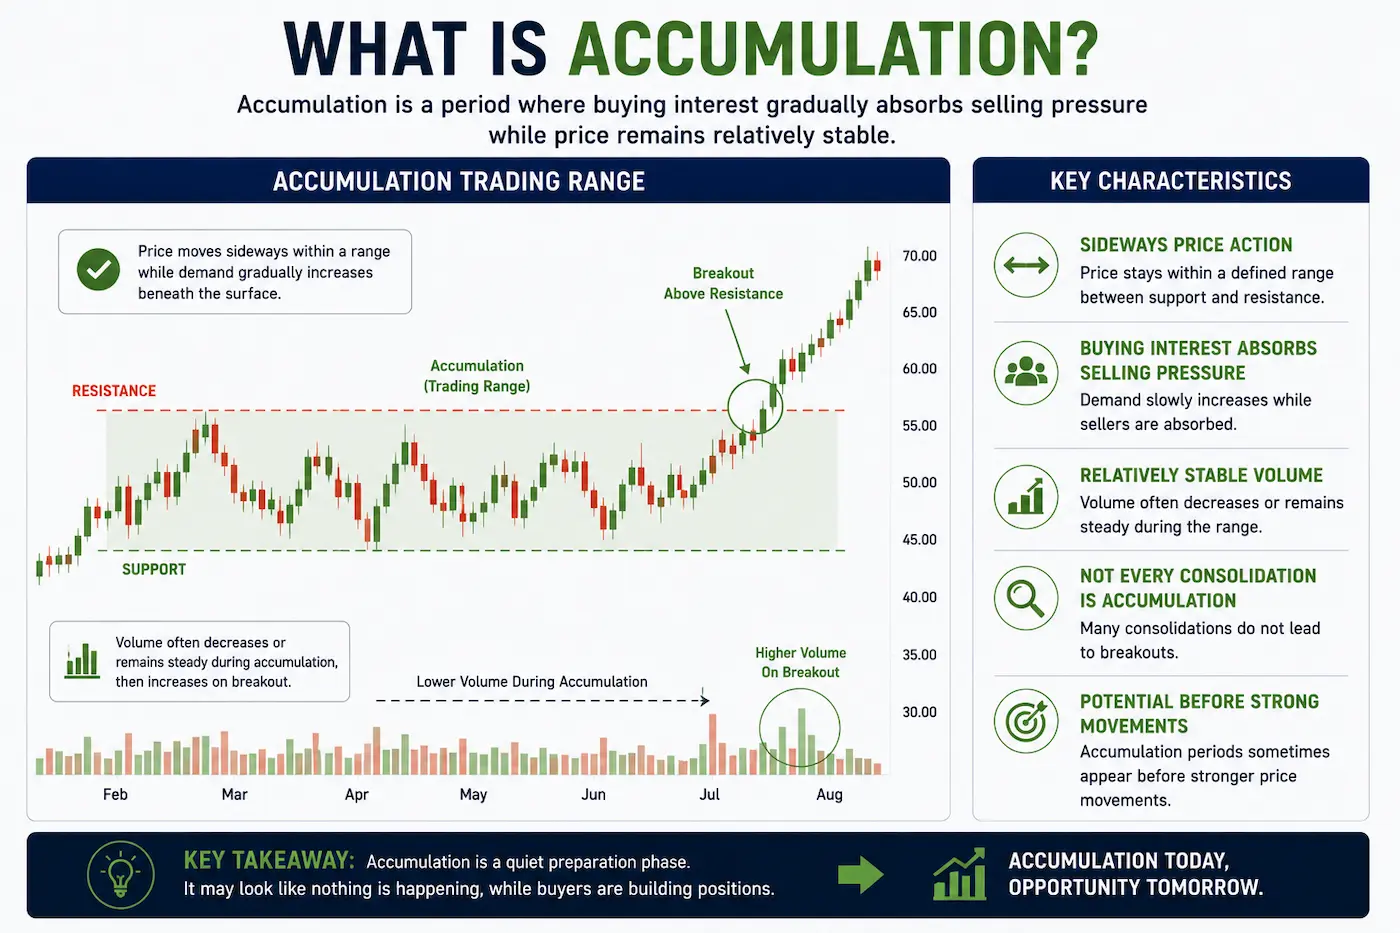
Accumulation refers to a period where buying interest gradually absorbs available selling pressure while price remains relatively stable.
During these periods, price may appear to move sideways even though demand is slowly increasing beneath the surface.
Not every consolidation represents accumulation, but many investors research these characteristics because they sometimes appear before stronger price movements.
Characteristics of Accumulation
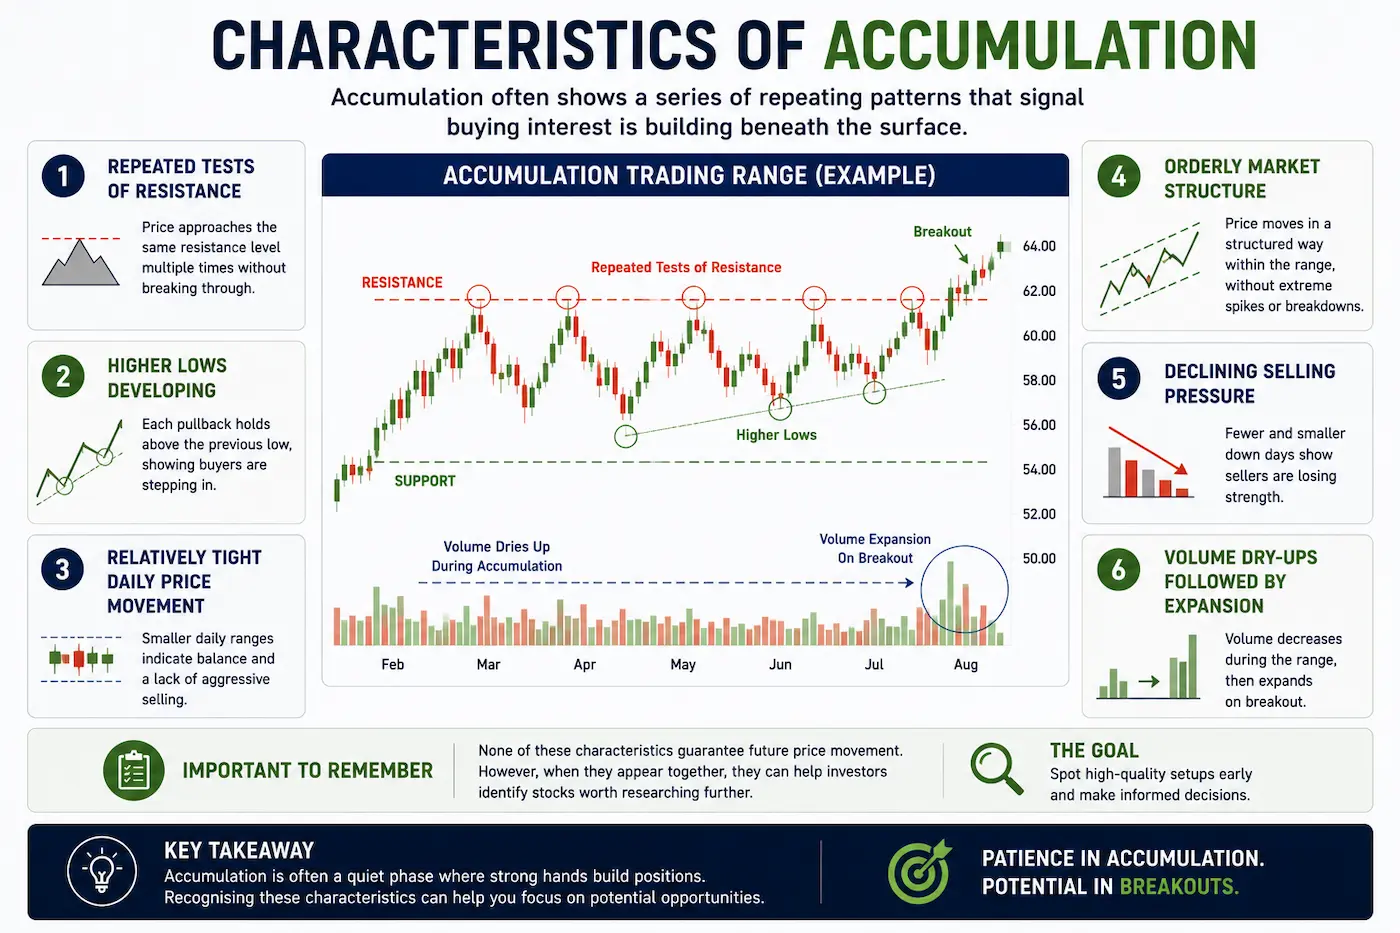
Although every stock behaves differently, accumulation often shares several common characteristics.
- Repeated tests of resistance.
- Higher lows developing beneath resistance.
- Relatively tight daily price movement.
- Orderly market structure.
- Declining selling pressure.
- Volume dry-ups followed by occasional expansion.
None of these characteristics guarantee future price movement, but together they can help investors identify stocks worth researching further.
Why Institutions Buy Slowly
Large institutions cannot usually purchase millions of shares at once without pushing prices significantly higher.
Instead, buying is often spread across multiple trading sessions, allowing positions to be built gradually while limiting market impact.
This gradual buying process is one reason why some stocks spend extended periods consolidating before eventually breaking above resistance.
Accumulation vs Distribution
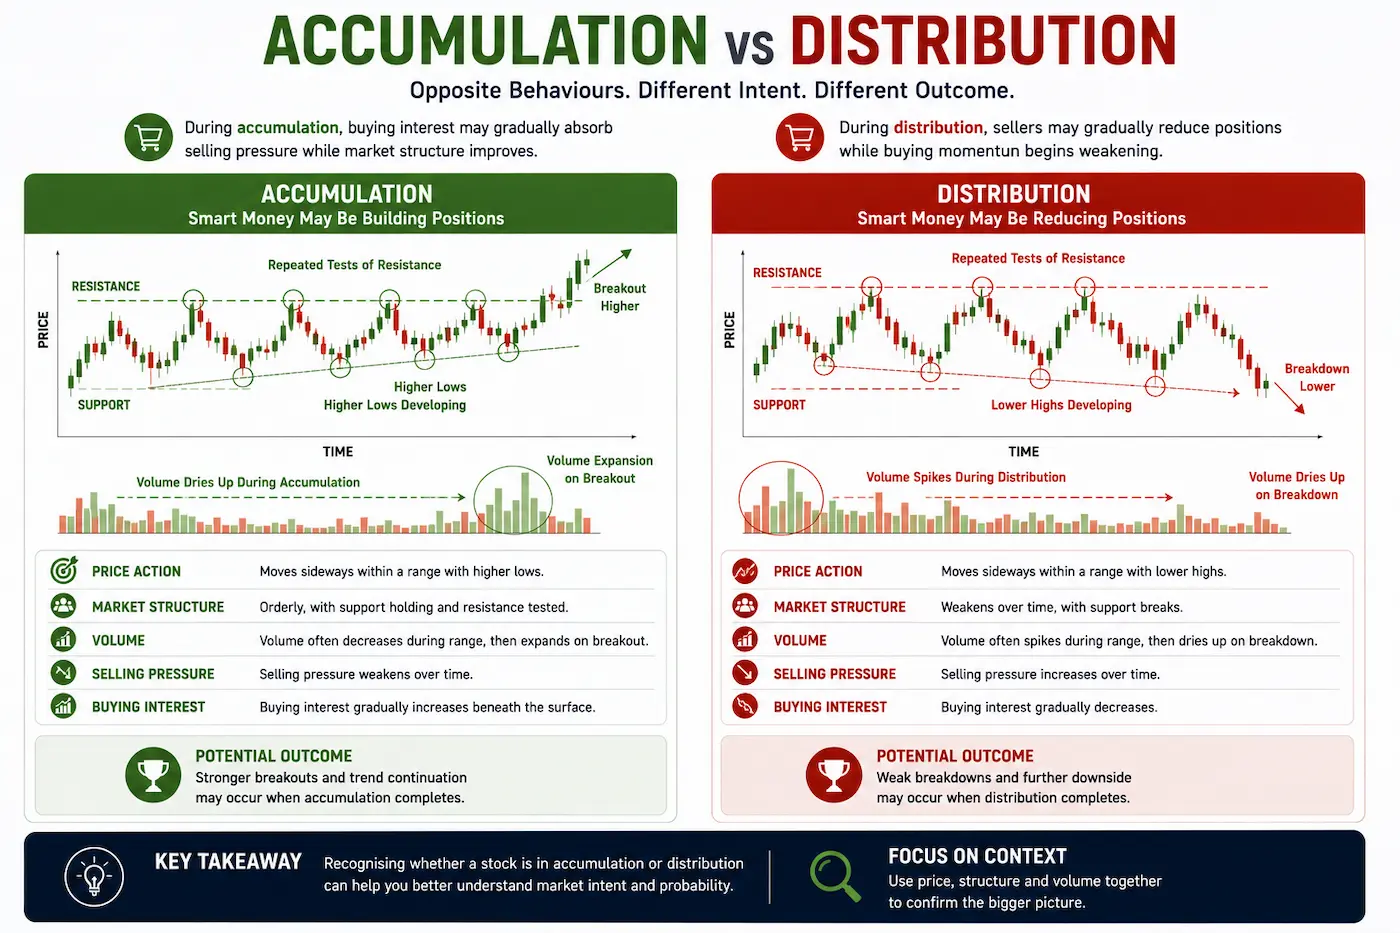
Accumulation and distribution represent opposite market behaviours.
During accumulation, buying interest may gradually absorb selling pressure while market structure improves.
During distribution, sellers may gradually reduce positions while buying momentum begins weakening.
Understanding this difference helps investors better interpret changing market conditions.
Smart Money Characteristics
Throughout EdgeBreak, the term Smart Money refers to a collection of market characteristics commonly associated with accumulation rather than identifying individual investors or institutions.
The Smart Money Filter searches for stocks displaying combinations of these characteristics, allowing members to narrow their research towards companies showing organised market behaviour.
The filter does not predict future price movement or identify actual institutional buying. Instead, it highlights stocks whose recent market behaviour may deserve further investigation.

Accumulation and Breakout Research
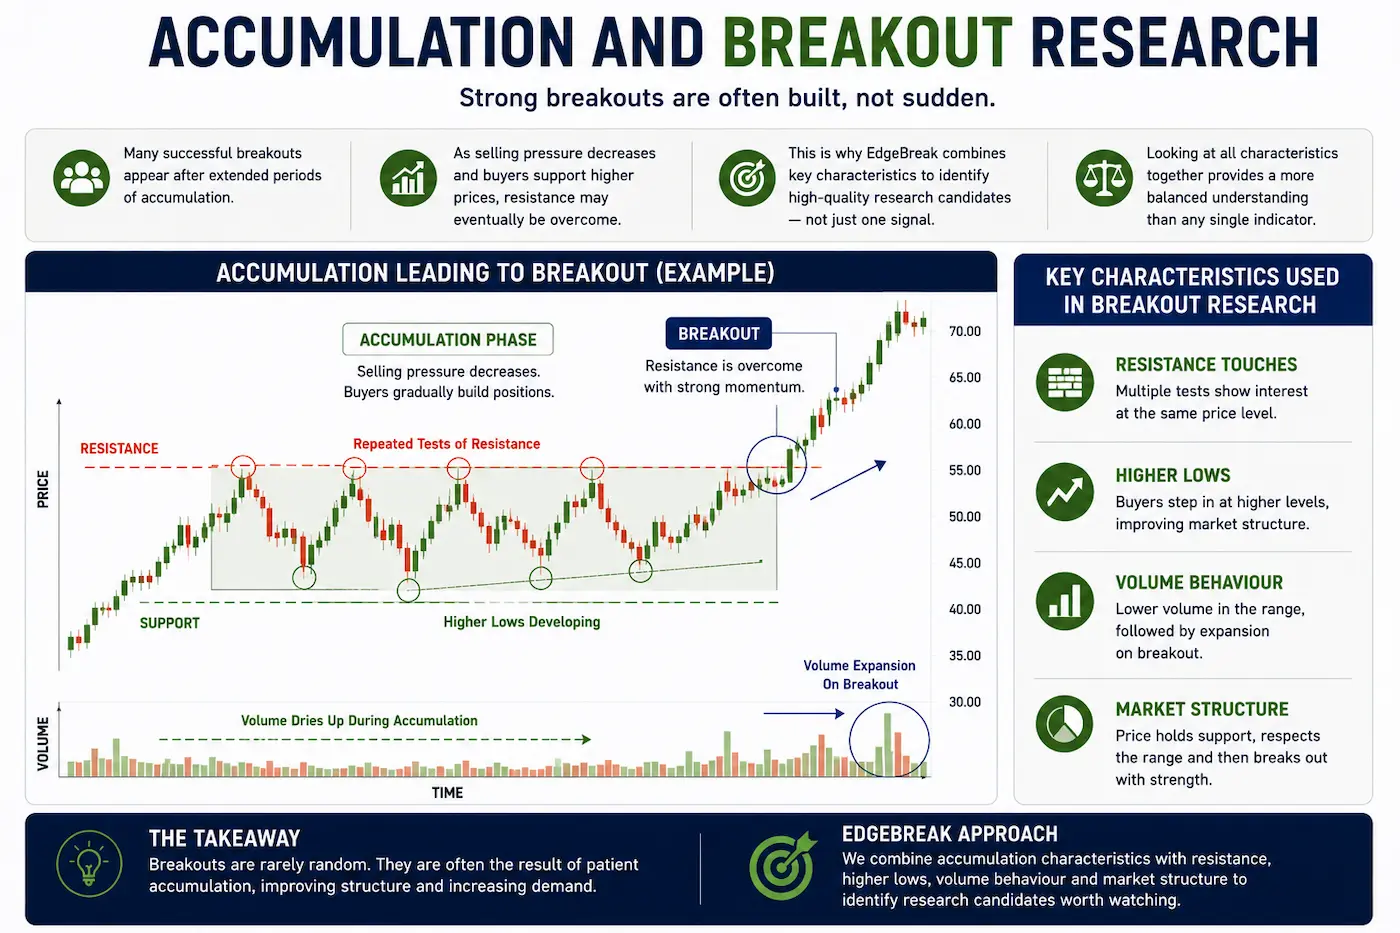
Many successful breakout structures appear after extended periods of accumulation.
As selling pressure gradually decreases and buyers continue supporting higher prices, resistance may eventually be overcome.
This is why EdgeBreak combines accumulation characteristics with resistance touches, higher lows, volume behaviour and overall market structure when identifying research candidates.
Looking at all of these characteristics together provides a more balanced understanding than focusing on any single indicator.
Patience Is Part of the Process
One of the most important lessons investors learn is that quality research takes time.
Stocks may remain in accumulation for weeks or months before market conditions change.
Rather than becoming impatient, many investors simply continue monitoring watchlists, reviewing charts and allowing market structure to develop naturally.
Lesson Summary
Institutional accumulation describes periods where buying interest may gradually absorb available selling pressure over time. While no investor can know exactly who is buying or selling, studying price structure, higher lows, resistance touches, volume behaviour and consolidation helps build a stronger understanding of developing market opportunities. EdgeBreak's Smart Money Filter combines these characteristics into a structured research tool that supports further analysis.
Key Takeaways
- Institutions often build positions gradually.
- Accumulation frequently develops during periods of consolidation.
- Higher lows and repeated resistance tests often accompany accumulation.
- Smart Money characteristics provide research opportunities, not predictions.
- Patience is one of the most valuable skills in breakout research.
Practical Exercise
Open the NASDAQ Scanner and apply the Smart Money Filter.
- Select three stocks from the results.
- Review each chart on the daily timeframe.
- Look for higher lows and repeated resistance touches.
- Check whether volume has remained orderly during consolidation.
- Save your strongest example to My Workspace for future monitoring.
Research Reminder
Institutional accumulation cannot be confirmed through price charts alone. EdgeBreak identifies market characteristics commonly associated with accumulation to support independent research. The platform does not provide financial advice, investment recommendations or identify actual institutional trading activity.
Continue Your Journey
Lesson 3.3 – Ranking Breakout Quality
Learn how to evaluate breakout quality by assessing market structure, resistance levels, higher lows, accumulation characteristics and volume. Discover how combining multiple factors helps you research stronger breakout opportunities with greater confidence.